GMS location: 1417
Random forest results
| names |
period |
power |
significance |
meanSquareError |
absError |
maxError |
CRPS |
IGN |
| baseline |
winter 2016 |
0.994 |
0.065 |
0.307 |
0.392 |
3.087 |
NaN |
NaN |
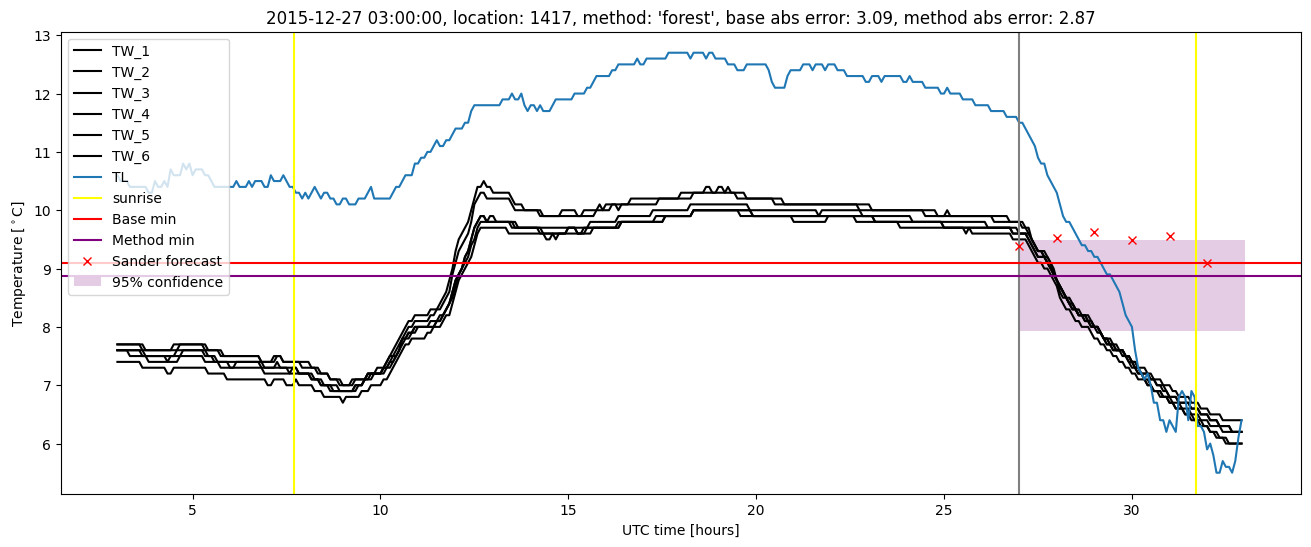
| forest |
winter 2016 |
0.994 |
0.032 |
0.267 |
0.367 |
2.874 |
0.474 |
3.902 |
| baseline |
winter 2017 |
0.981 |
0.023 |
0.370 |
0.449 |
1.725 |
NaN |
NaN |
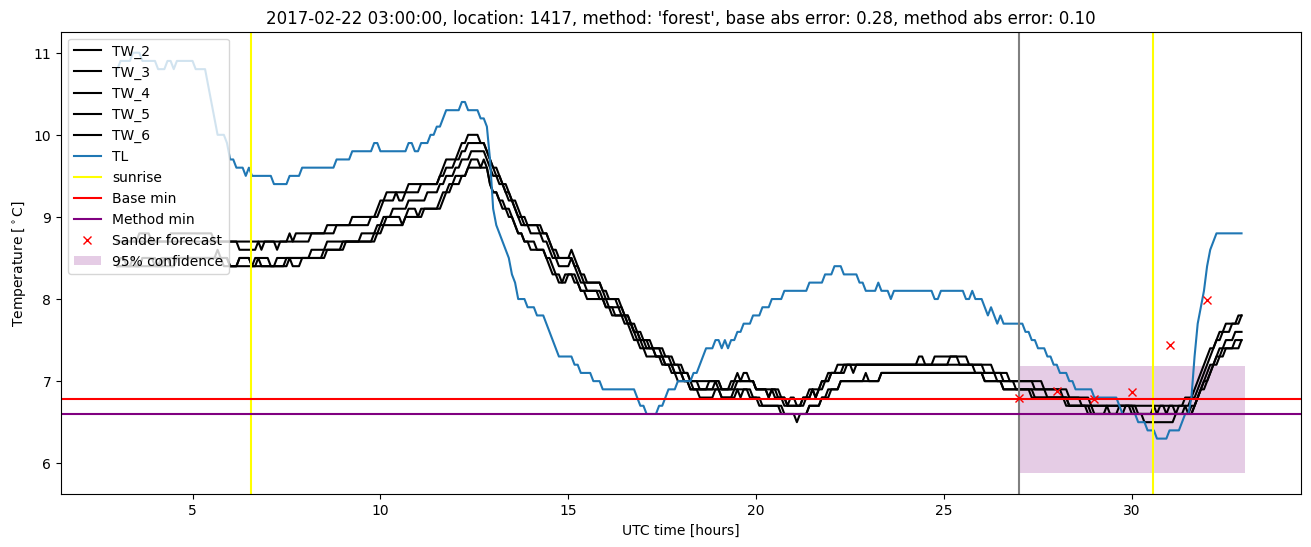
| forest |
winter 2017 |
0.990 |
0.045 |
0.295 |
0.407 |
1.473 |
0.472 |
3.646 |
| baseline |
winter 2018 |
0.986 |
0.059 |
0.364 |
0.416 |
2.703 |
NaN |
NaN |
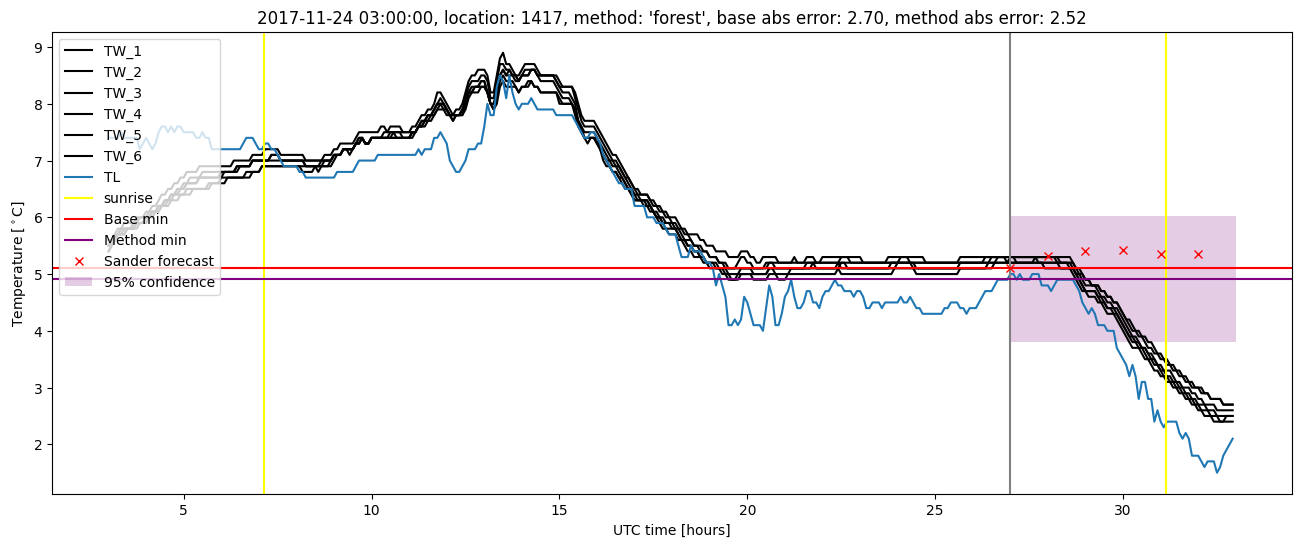
| forest |
winter 2018 |
0.972 |
0.088 |
0.294 |
0.368 |
2.522 |
0.465 |
2.951 |
| baseline |
winter 2019 |
0.979 |
0.118 |
0.417 |
0.479 |
1.941 |
NaN |
NaN |
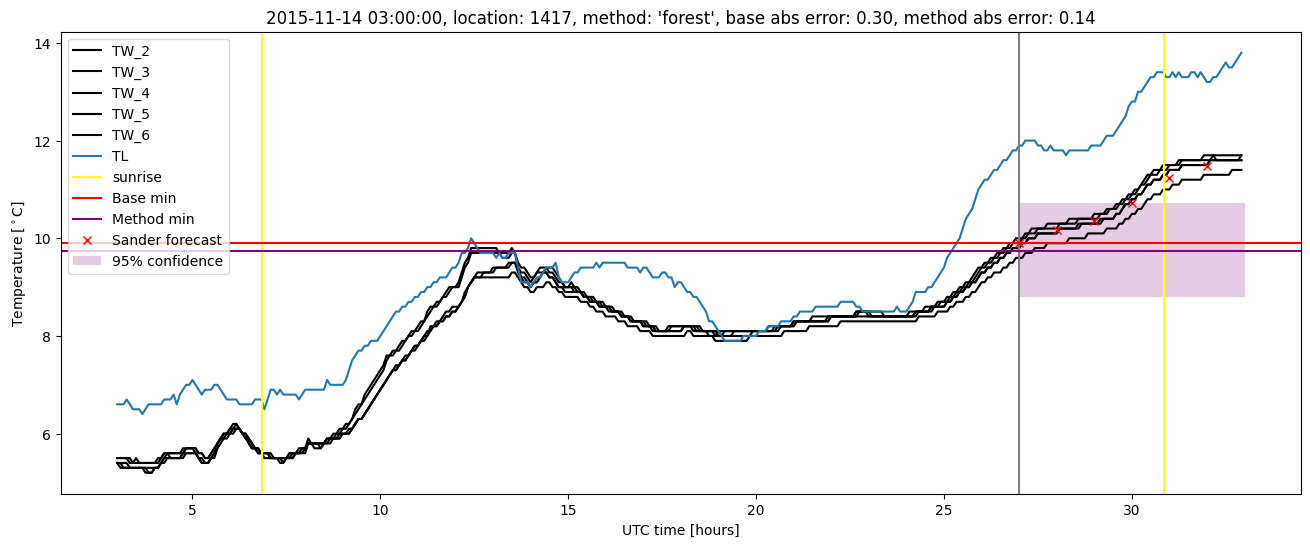
| forest |
winter 2019 |
1.000 |
0.118 |
0.307 |
0.411 |
1.683 |
0.452 |
3.013 |
| baseline |
all |
0.985 |
0.056 |
0.362 |
0.431 |
3.087 |
NaN |
NaN |
| forest |
all |
0.989 |
0.064 |
0.290 |
0.386 |
2.874 |
0.466 |
3.384 |
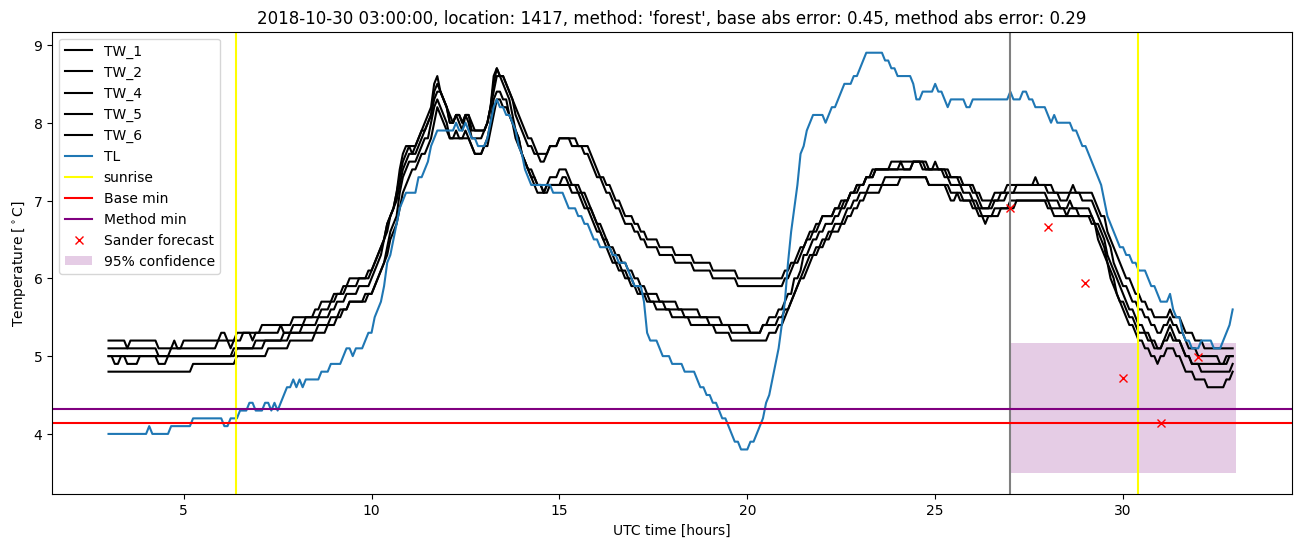
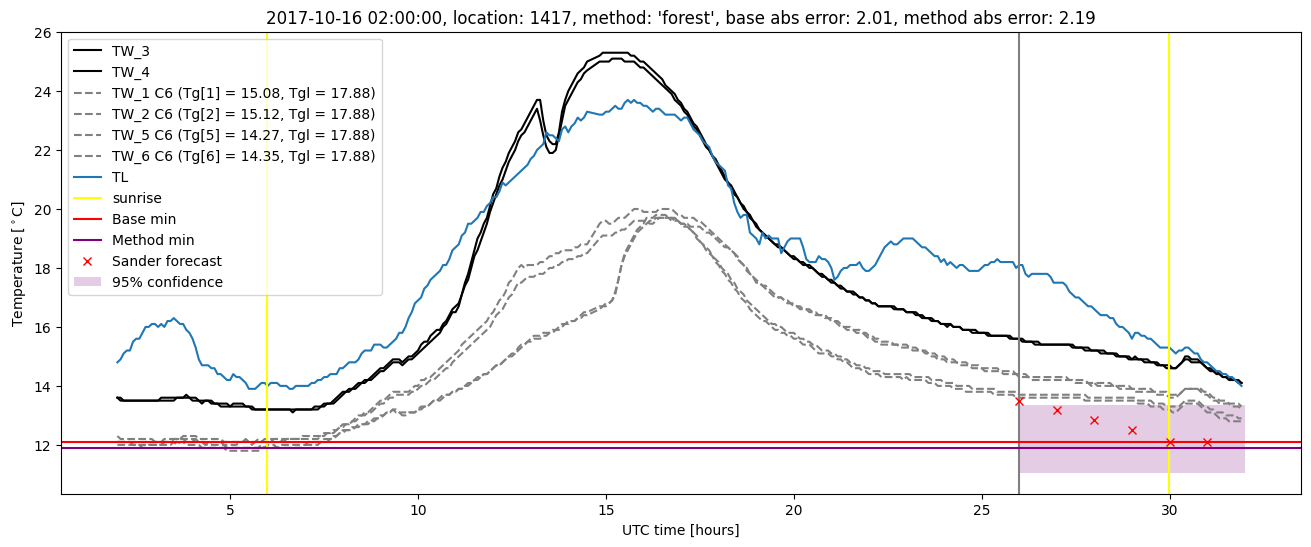
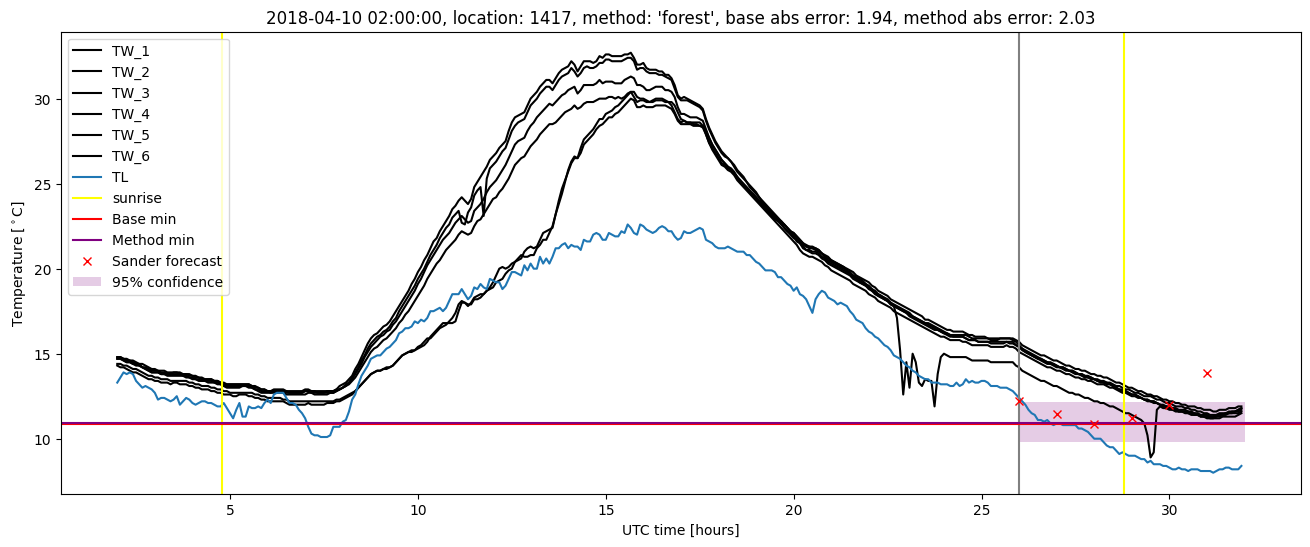
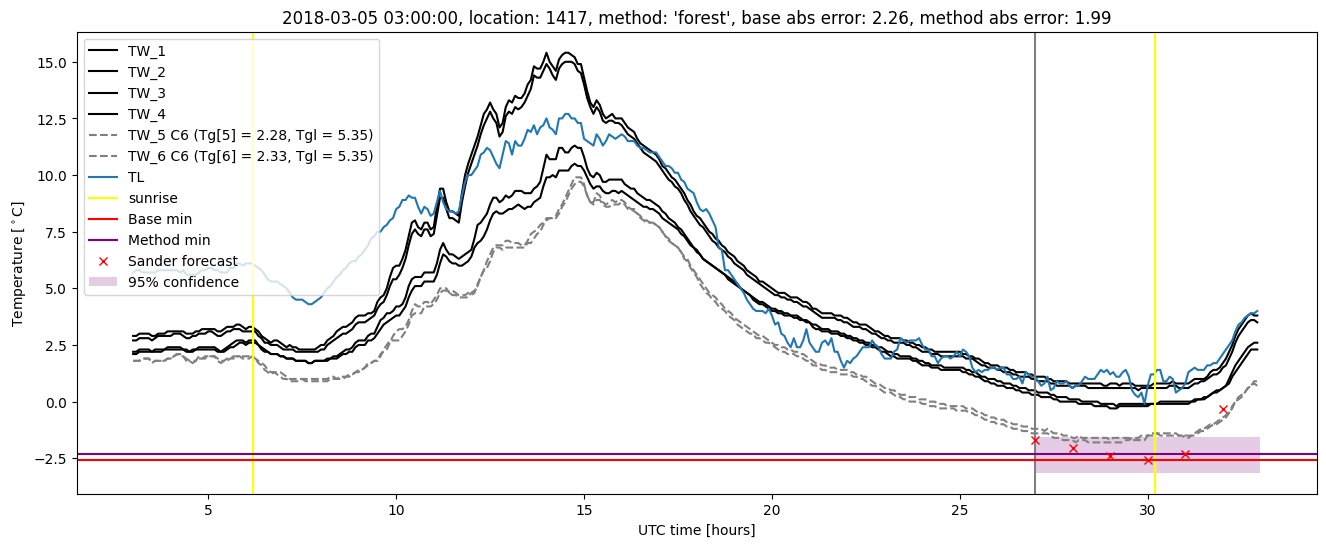
Random forest plots

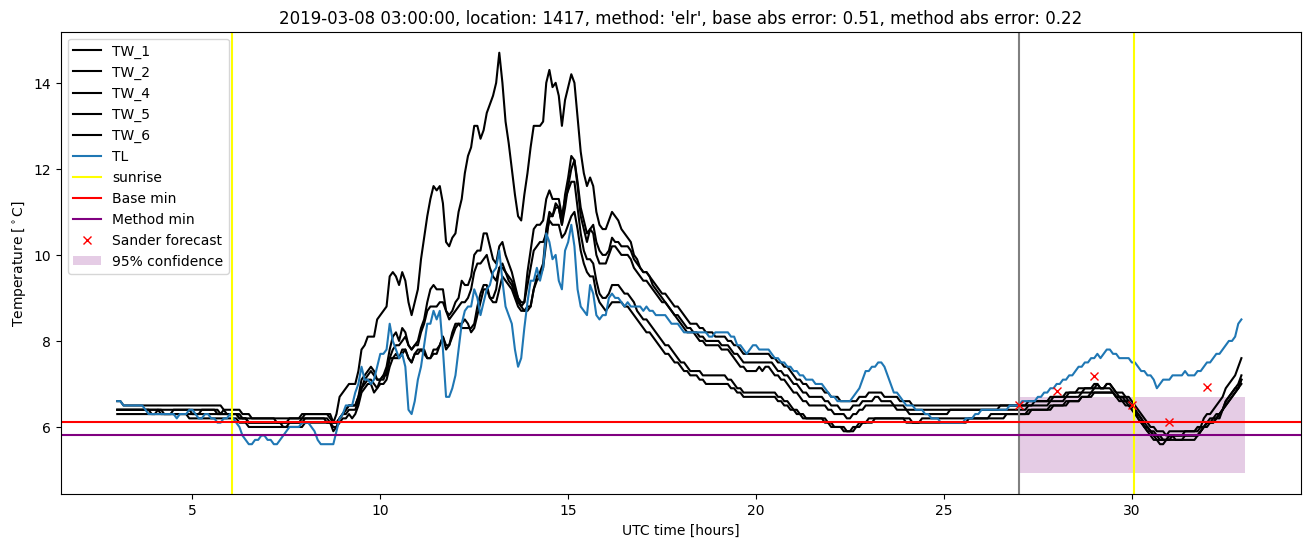
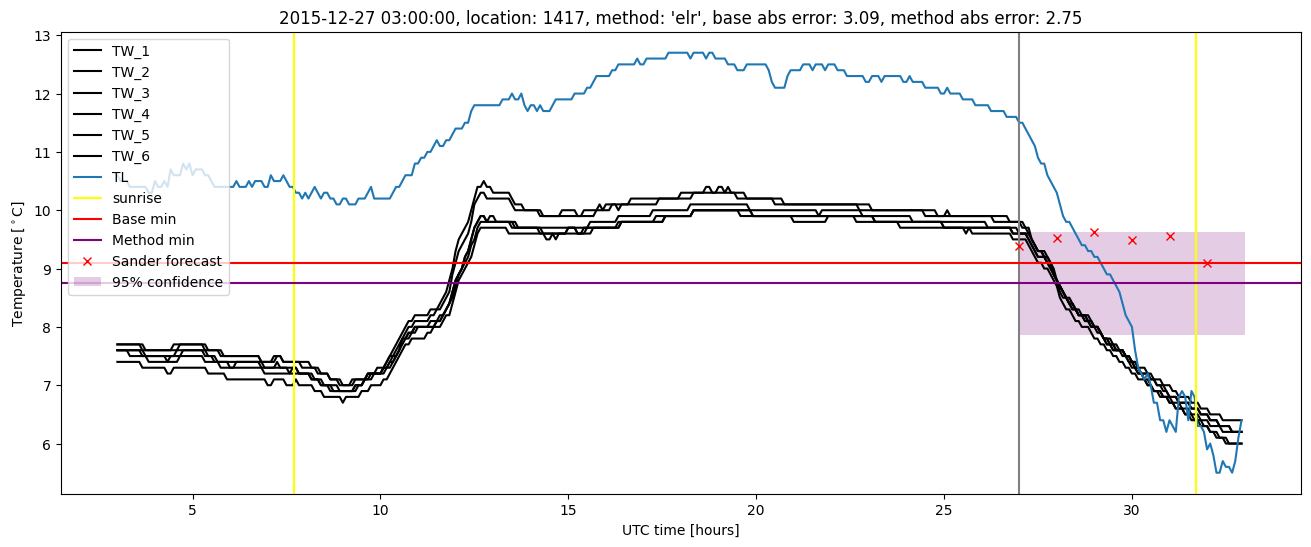
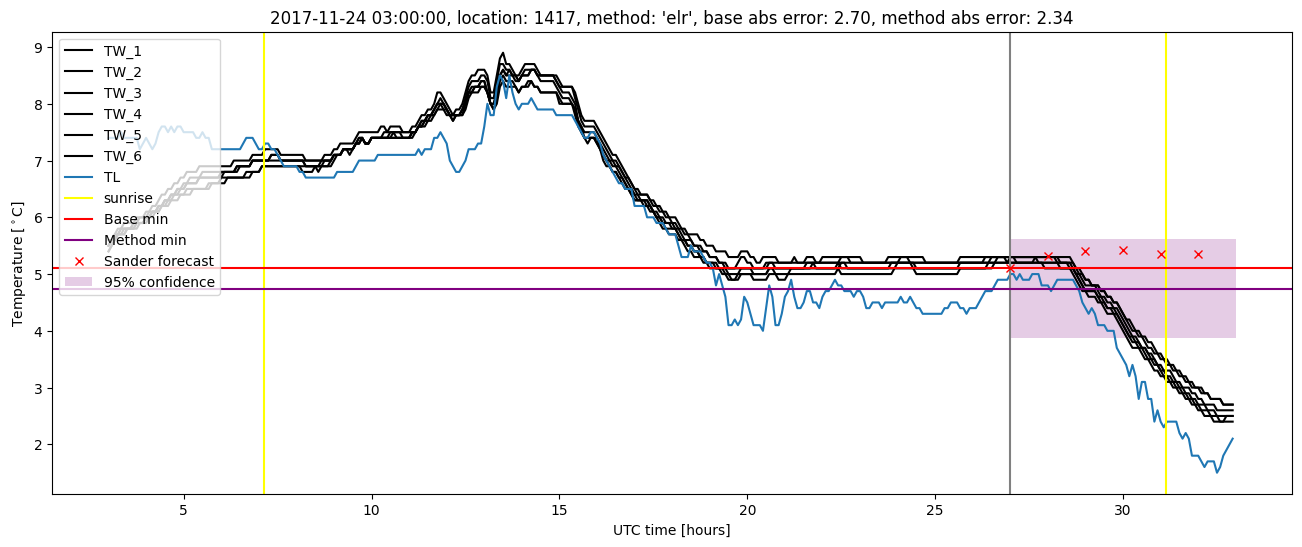
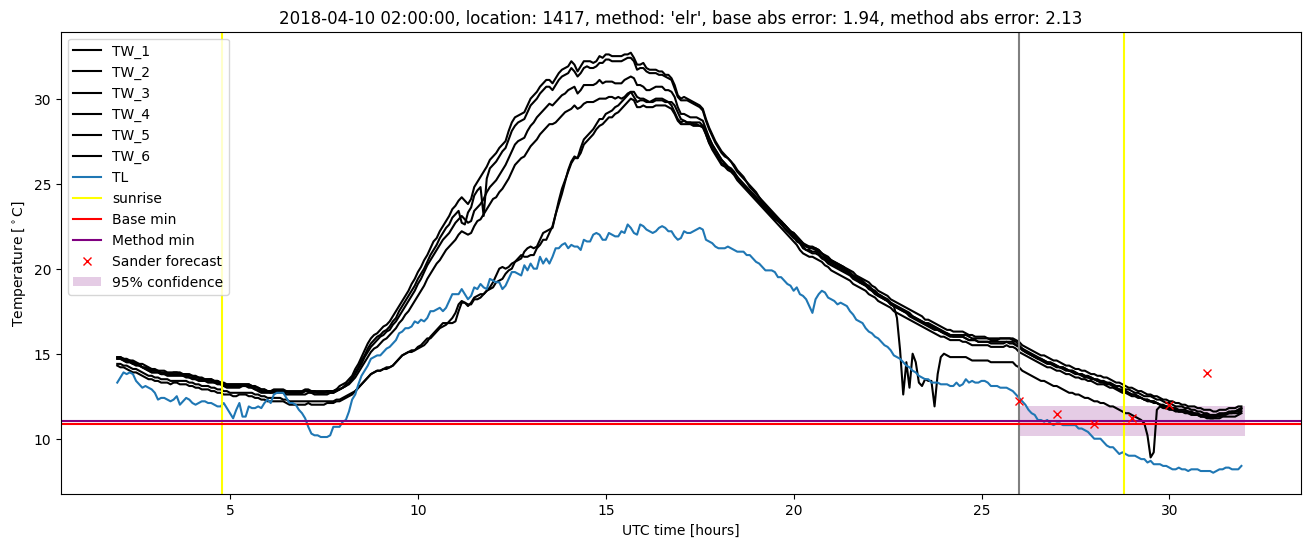
Extended logistic regression results
| names |
period |
power |
significance |
meanSquareError |
absError |
maxError |
CRPS |
IGN |
| baseline |
winter 2016 |
0.994 |
0.065 |
0.307 |
0.392 |
3.087 |
NaN |
NaN |
| elr |
winter 2016 |
1.000 |
0.097 |
0.286 |
0.396 |
2.750 |
0.532 |
3.990 |
| baseline |
winter 2017 |
0.981 |
0.023 |
0.370 |
0.449 |
1.725 |
NaN |
NaN |
| elr |
winter 2017 |
0.981 |
0.045 |
0.321 |
0.416 |
1.464 |
0.504 |
3.575 |
| baseline |
winter 2018 |
0.986 |
0.059 |
0.364 |
0.416 |
2.703 |
NaN |
NaN |
| elr |
winter 2018 |
0.986 |
0.088 |
0.295 |
0.376 |
2.343 |
0.533 |
4.285 |
| baseline |
winter 2019 |
0.979 |
0.118 |
0.417 |
0.479 |
1.941 |
NaN |
NaN |
| elr |
winter 2019 |
1.000 |
0.118 |
0.340 |
0.444 |
1.992 |
0.498 |
3.612 |
| baseline |
all |
0.985 |
0.056 |
0.362 |
0.431 |
3.087 |
NaN |
NaN |
| elr |
all |
0.993 |
0.079 |
0.309 |
0.406 |
2.750 |
0.518 |
3.889 |
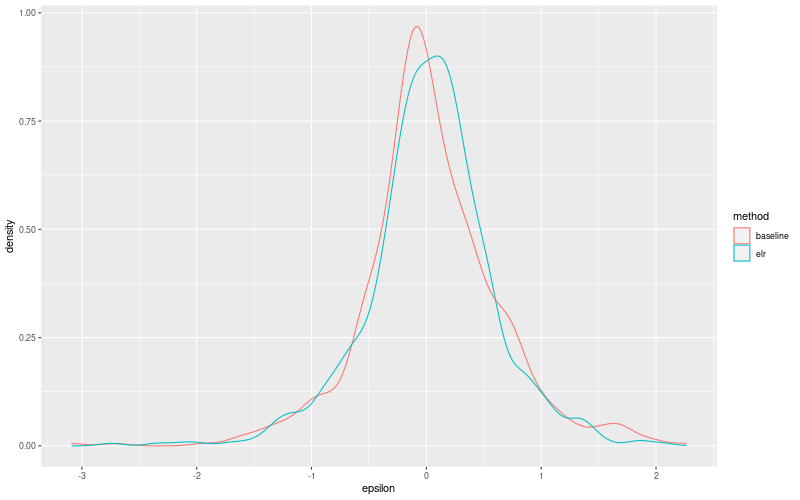
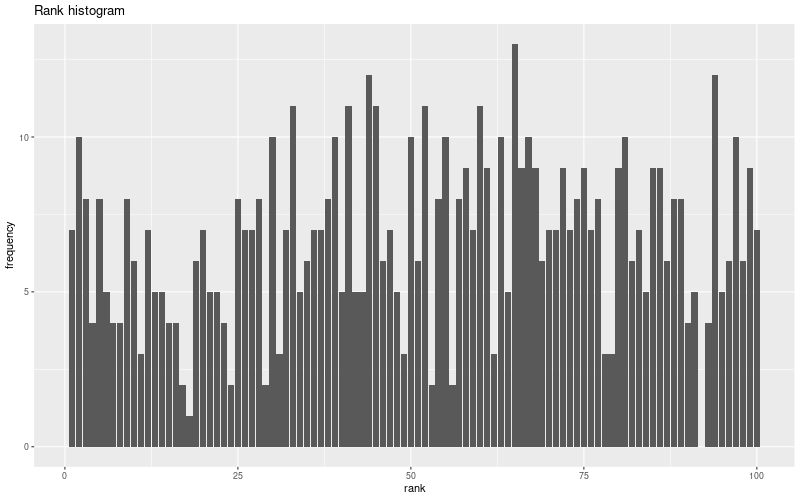
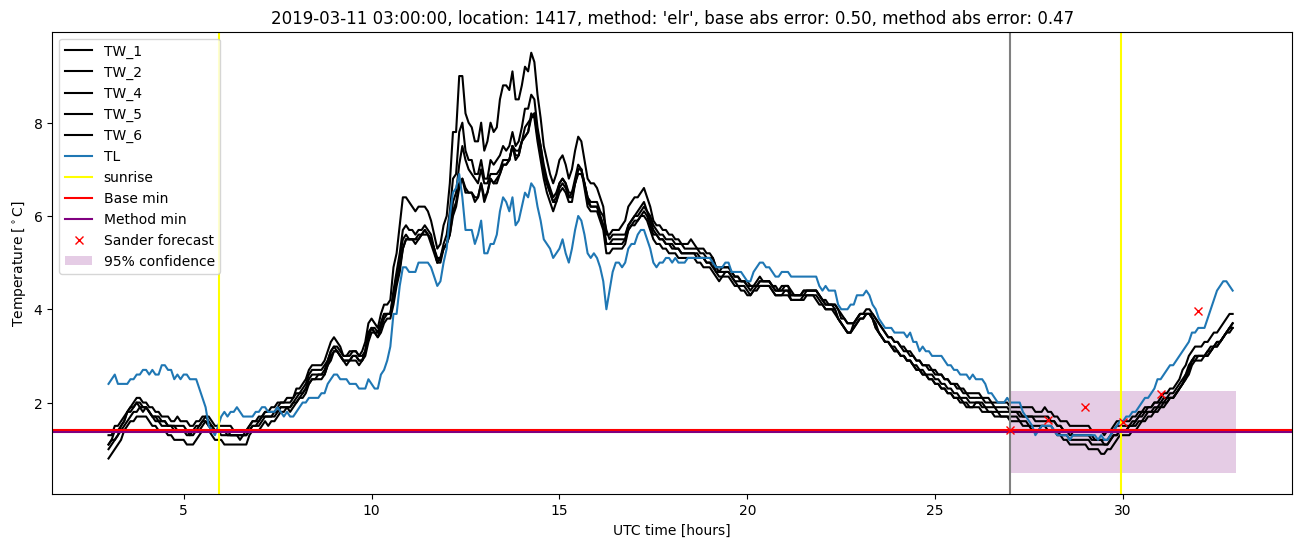
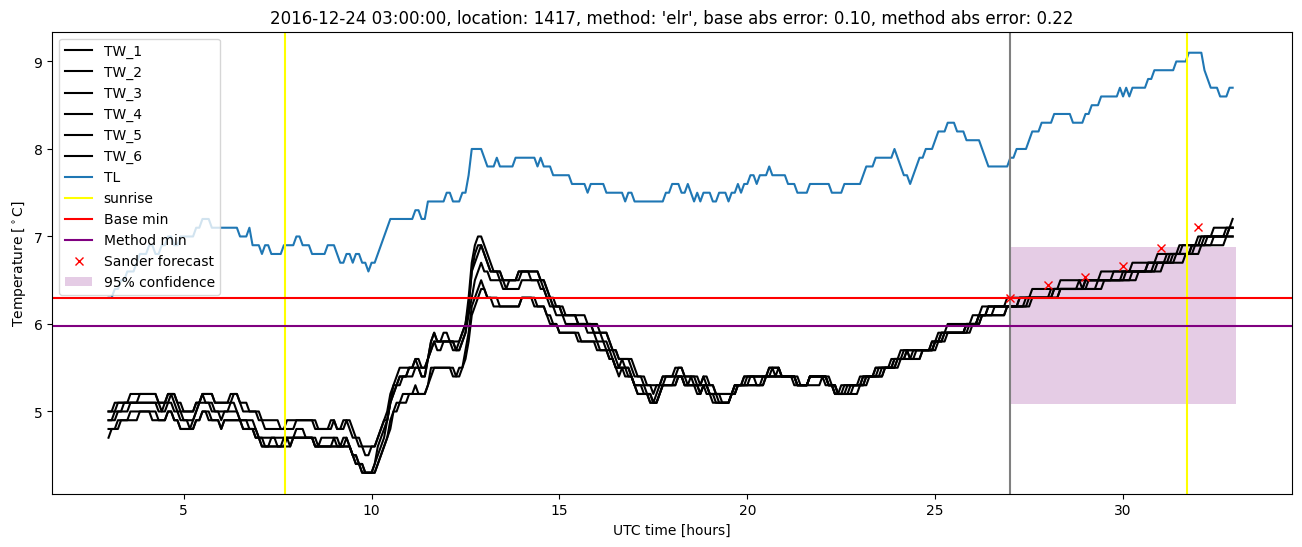
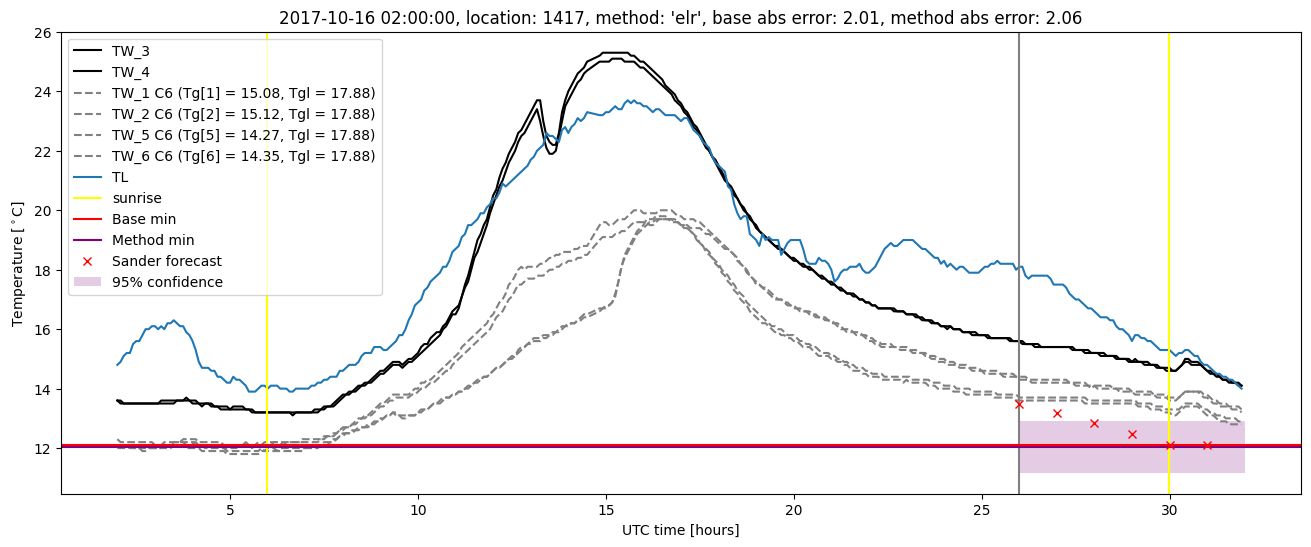
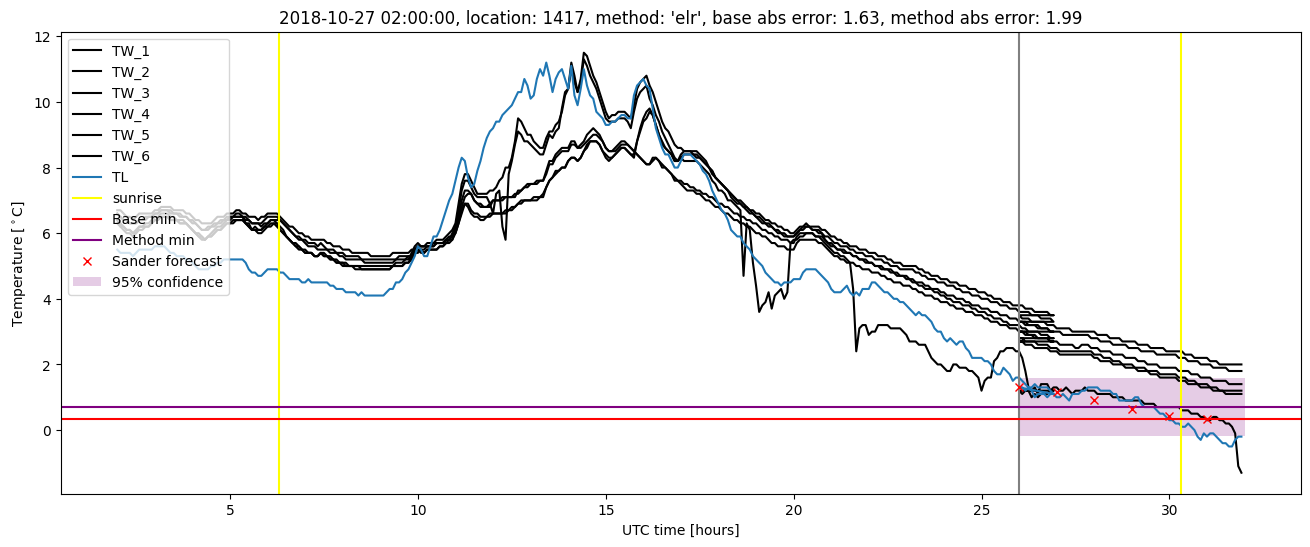
Extended logistic regression plots