GMS location: 1416
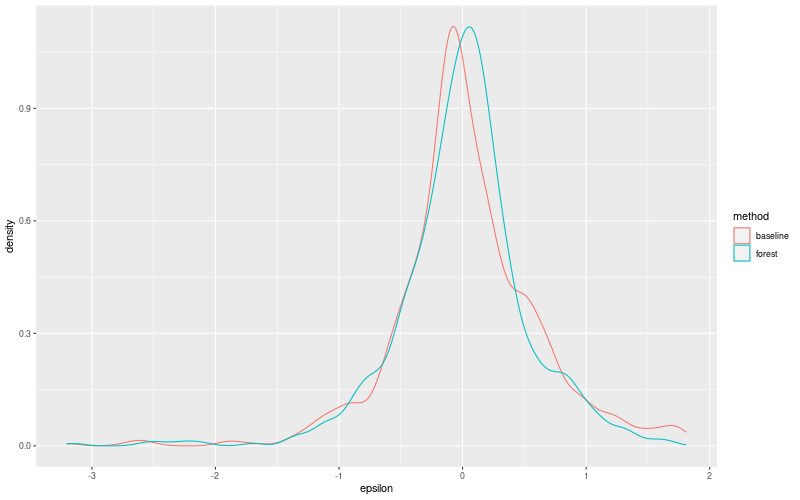
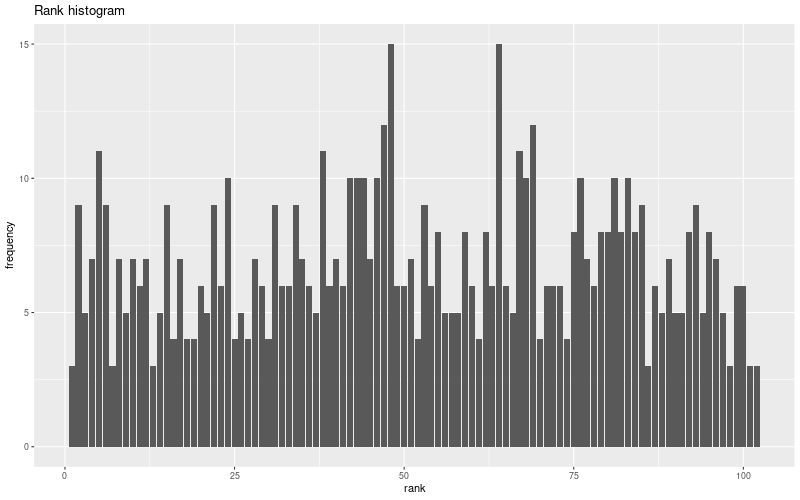
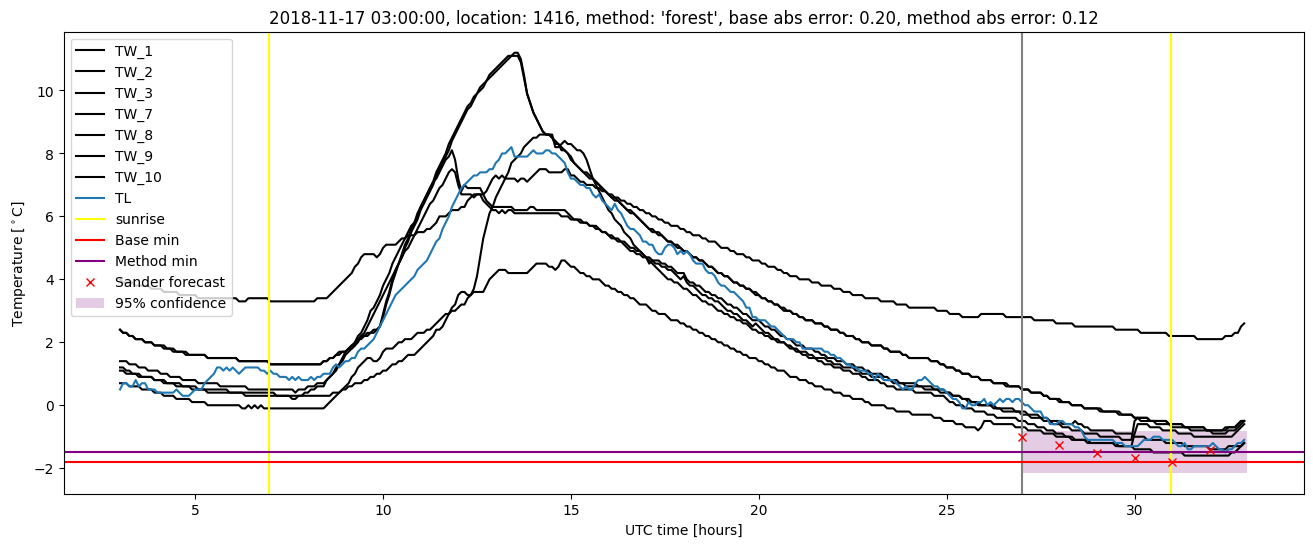
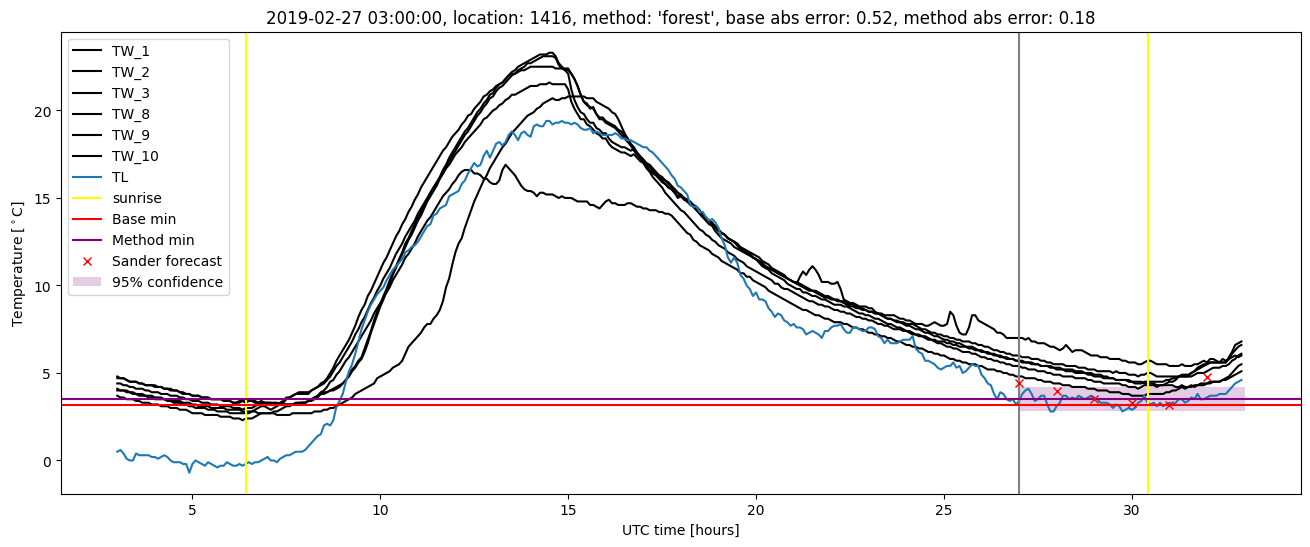
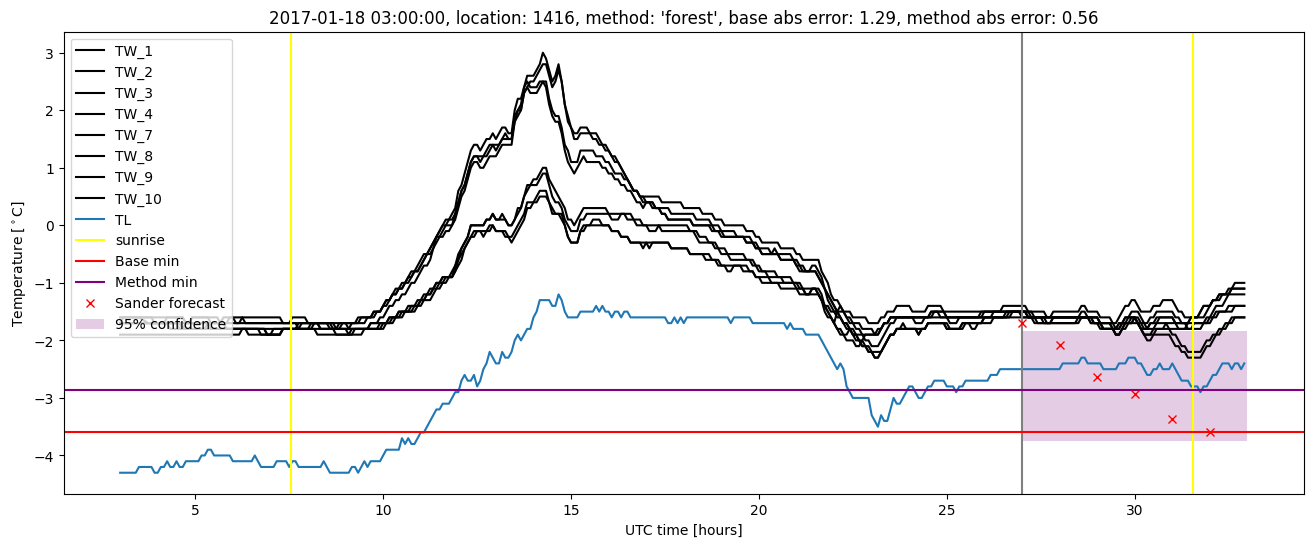
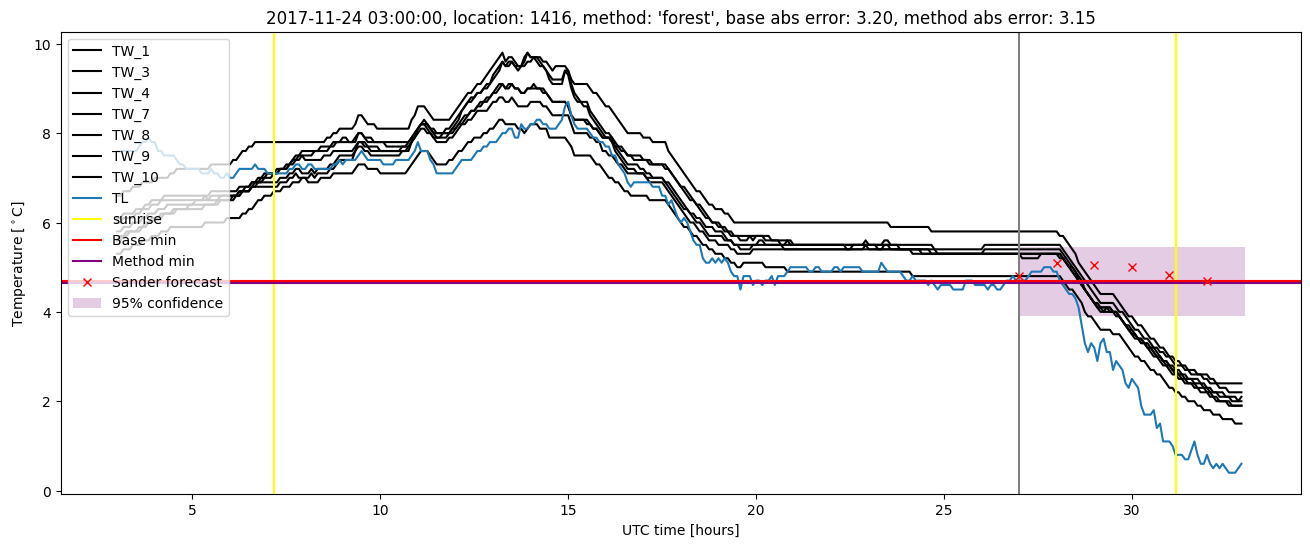
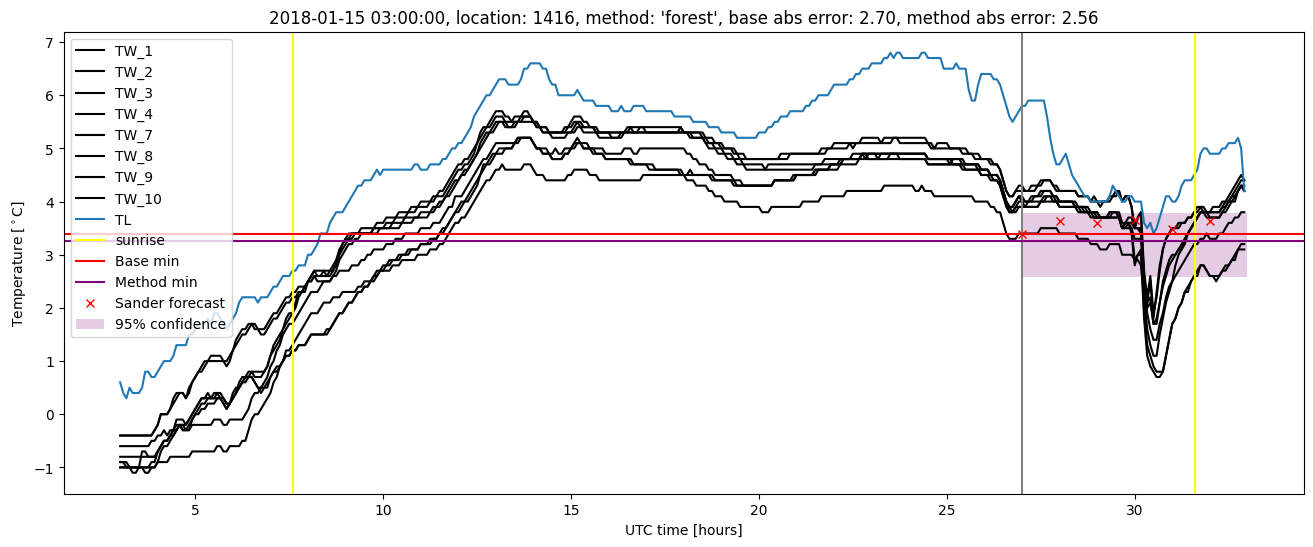
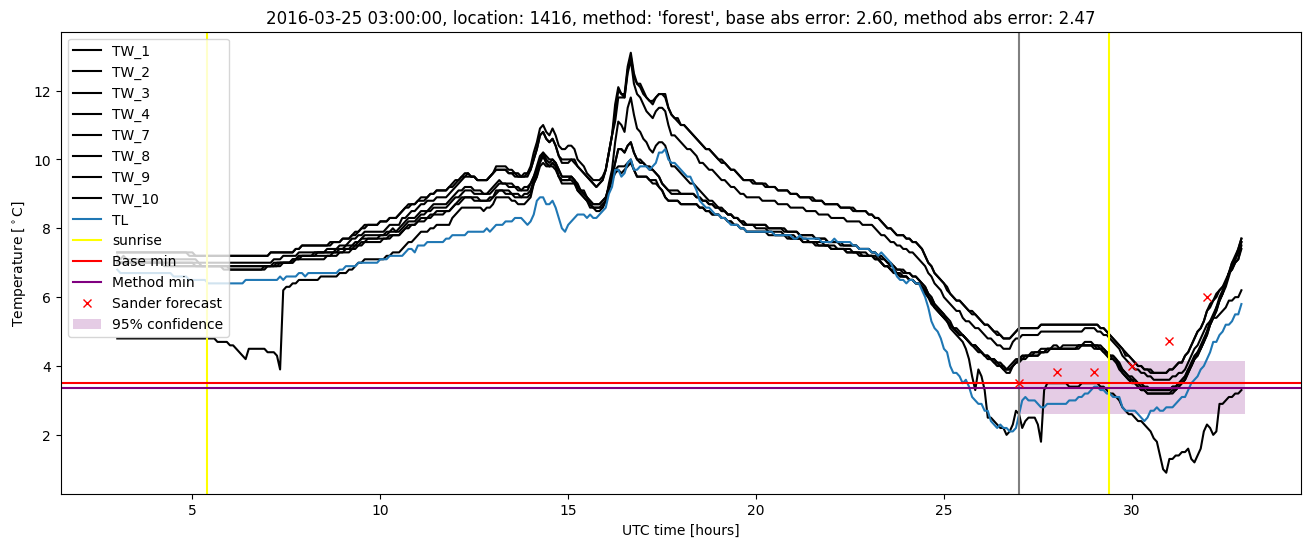
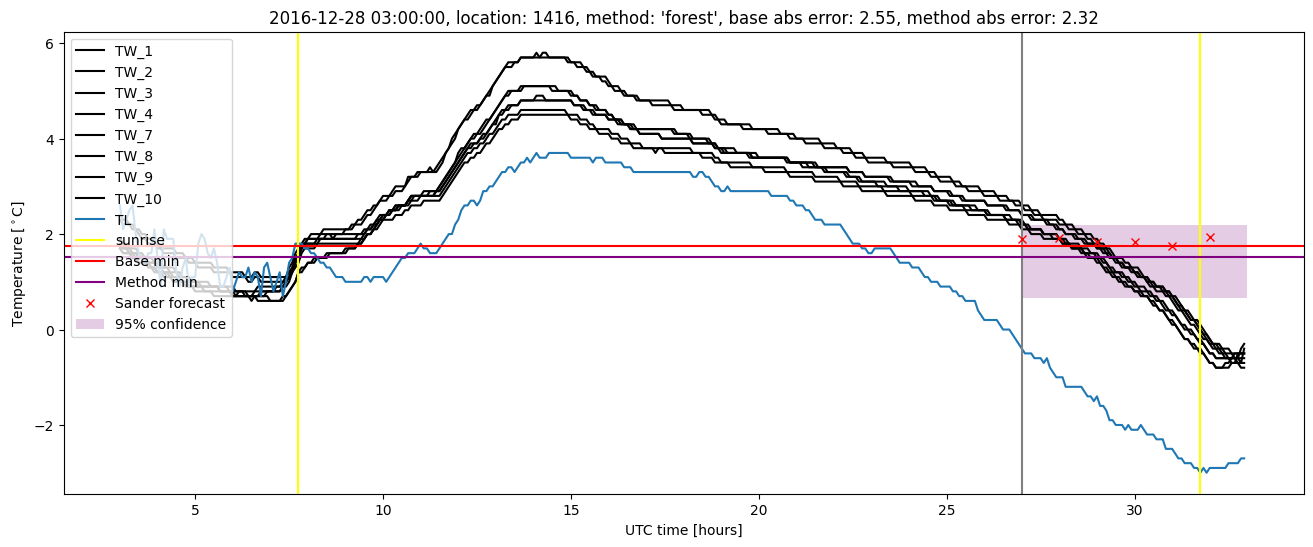
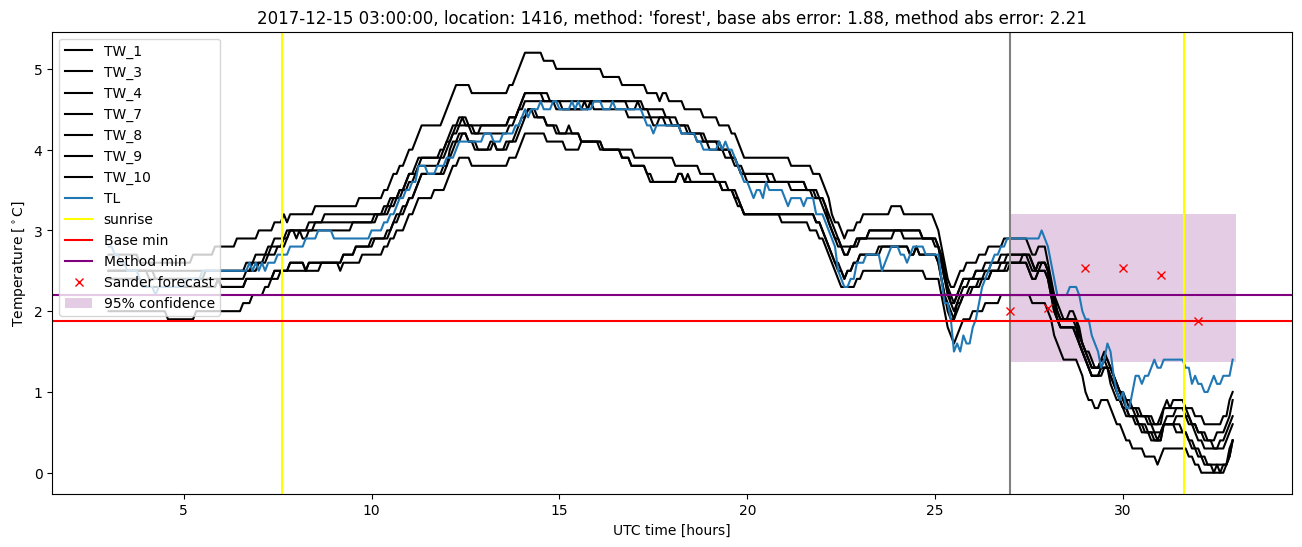
Random forest results
| names |
period |
power |
significance |
meanSquareError |
absError |
maxError |
CRPS |
IGN |
| baseline |
winter 2016 |
0.994 |
0.065 |
0.310 |
0.391 |
2.601 |
NaN |
NaN |
| forest |
winter 2016 |
0.994 |
0.065 |
0.264 |
0.358 |
2.470 |
0.472 |
2.942 |
| baseline |
winter 2017 |
0.991 |
0.065 |
0.348 |
0.399 |
2.553 |
NaN |
NaN |
| forest |
winter 2017 |
0.991 |
0.065 |
0.272 |
0.367 |
2.316 |
0.472 |
2.707 |
| baseline |
winter 2018 |
0.986 |
0.026 |
0.401 |
0.428 |
3.200 |
NaN |
NaN |
| forest |
winter 2018 |
0.978 |
0.026 |
0.329 |
0.374 |
3.149 |
0.476 |
4.164 |
| baseline |
winter 2019 |
0.986 |
0.053 |
0.327 |
0.431 |
1.757 |
NaN |
NaN |
| forest |
winter 2019 |
0.993 |
0.053 |
0.252 |
0.384 |
1.370 |
0.458 |
2.590 |
| baseline |
all |
0.989 |
0.052 |
0.345 |
0.411 |
3.200 |
NaN |
NaN |
| forest |
all |
0.989 |
0.052 |
0.280 |
0.370 |
3.149 |
0.470 |
3.119 |
Random forest plots
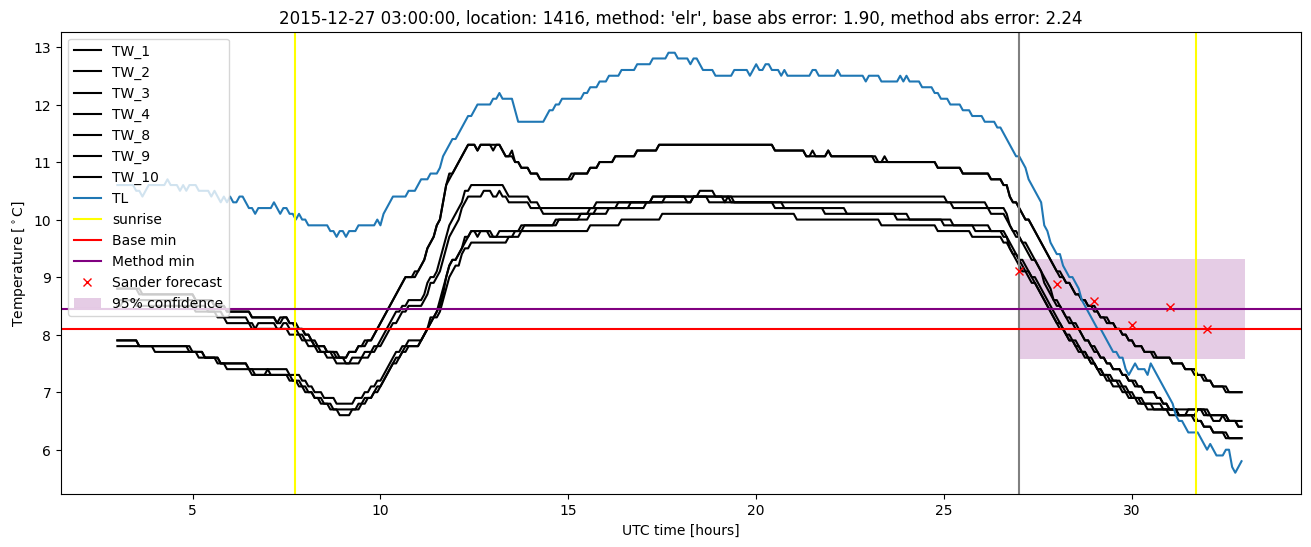
Extended logistic regression results
| names |
period |
power |
significance |
meanSquareError |
absError |
maxError |
CRPS |
IGN |
| baseline |
winter 2016 |
0.994 |
0.065 |
0.310 |
0.391 |
2.601 |
NaN |
NaN |
| elr |
winter 2016 |
0.994 |
0.065 |
0.267 |
0.367 |
2.388 |
0.550 |
4.672 |
| baseline |
winter 2017 |
0.991 |
0.065 |
0.348 |
0.399 |
2.553 |
NaN |
NaN |
| elr |
winter 2017 |
0.981 |
0.065 |
0.326 |
0.418 |
2.303 |
0.532 |
4.493 |
| baseline |
winter 2018 |
0.986 |
0.026 |
0.401 |
0.428 |
3.200 |
NaN |
NaN |
| elr |
winter 2018 |
0.978 |
0.026 |
0.338 |
0.413 |
2.928 |
0.553 |
5.084 |
| baseline |
winter 2019 |
0.986 |
0.053 |
0.327 |
0.431 |
1.757 |
NaN |
NaN |
| elr |
winter 2019 |
0.993 |
0.053 |
0.275 |
0.408 |
1.575 |
0.532 |
4.276 |
| baseline |
all |
0.989 |
0.052 |
0.345 |
0.411 |
3.200 |
NaN |
NaN |
| elr |
all |
0.988 |
0.052 |
0.300 |
0.399 |
2.928 |
0.543 |
4.646 |
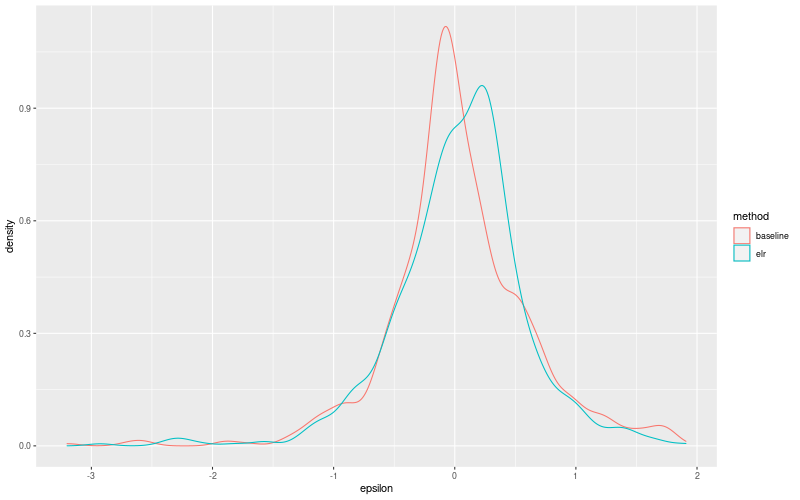
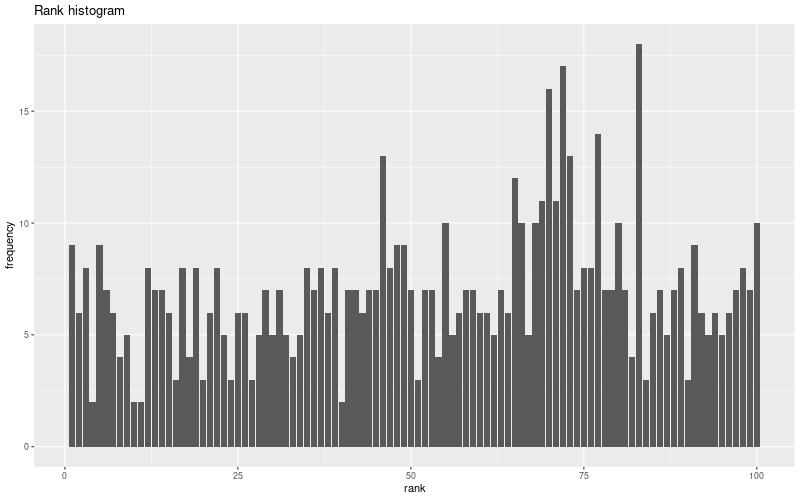
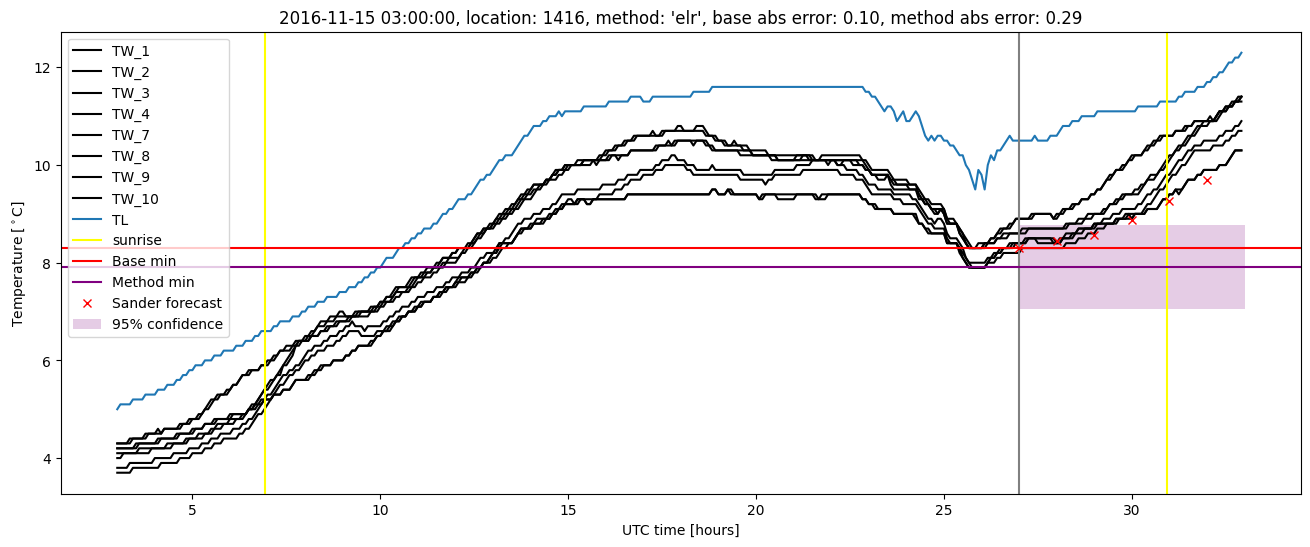
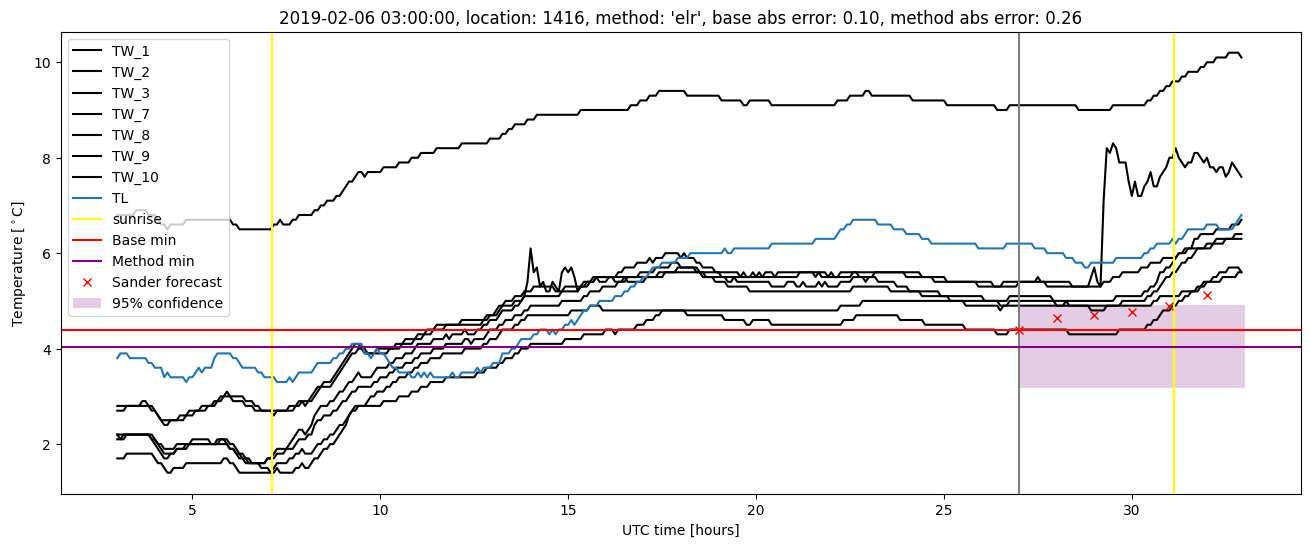
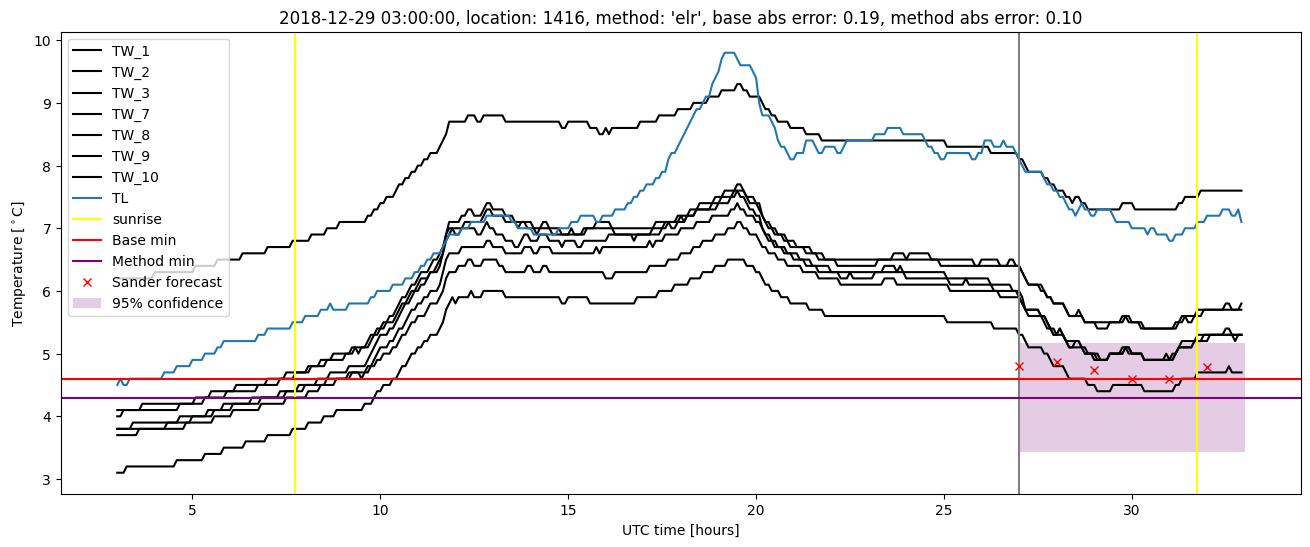
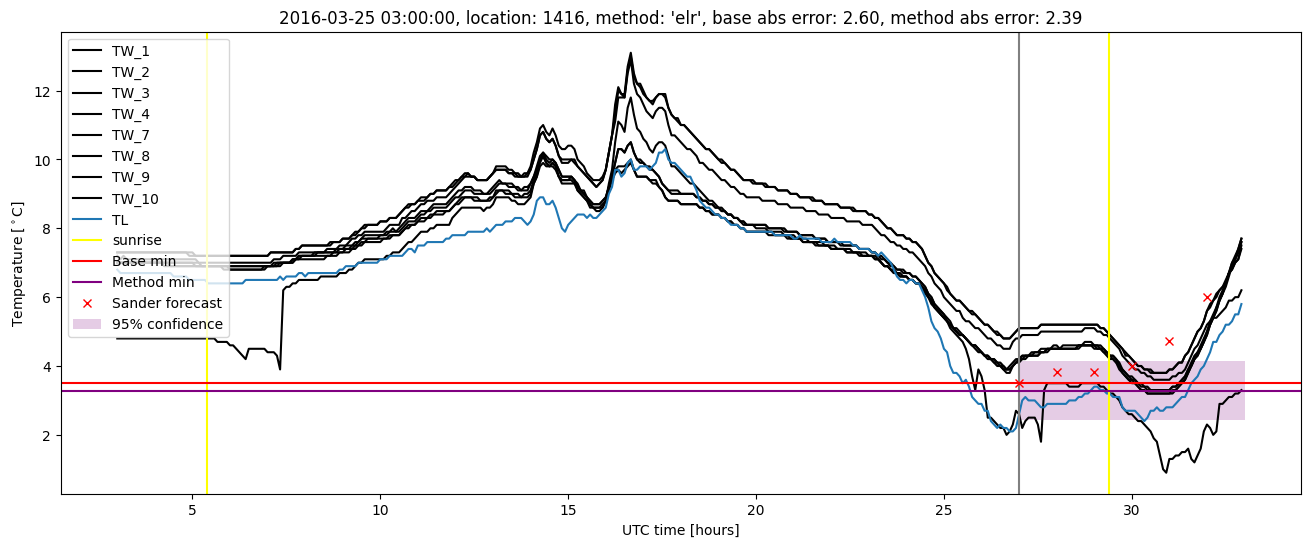
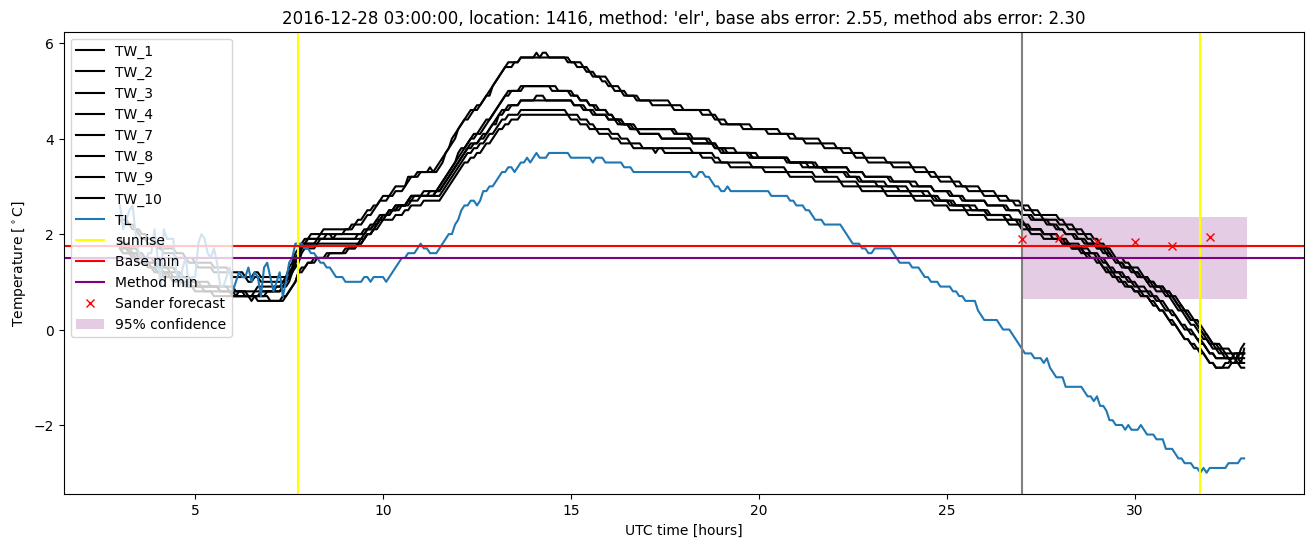
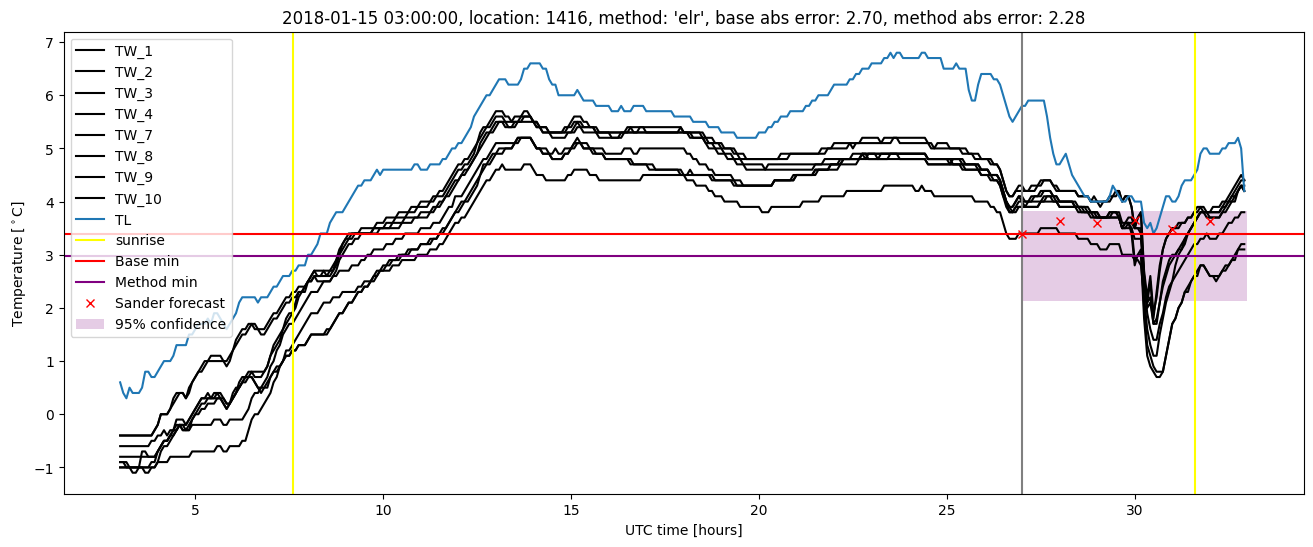
Extended logistic regression plots