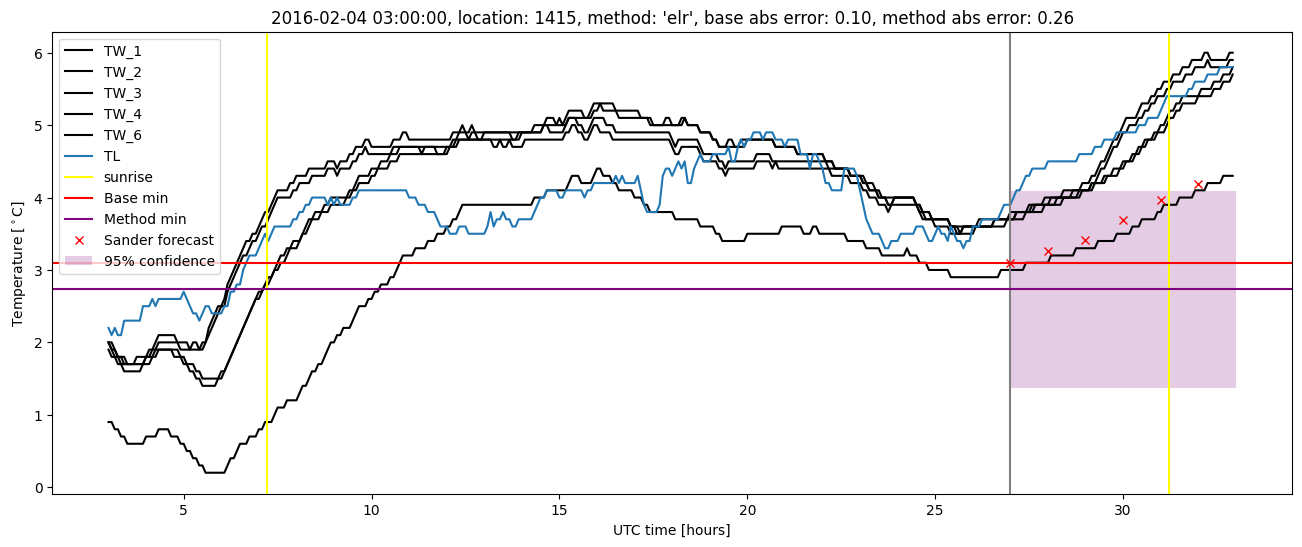
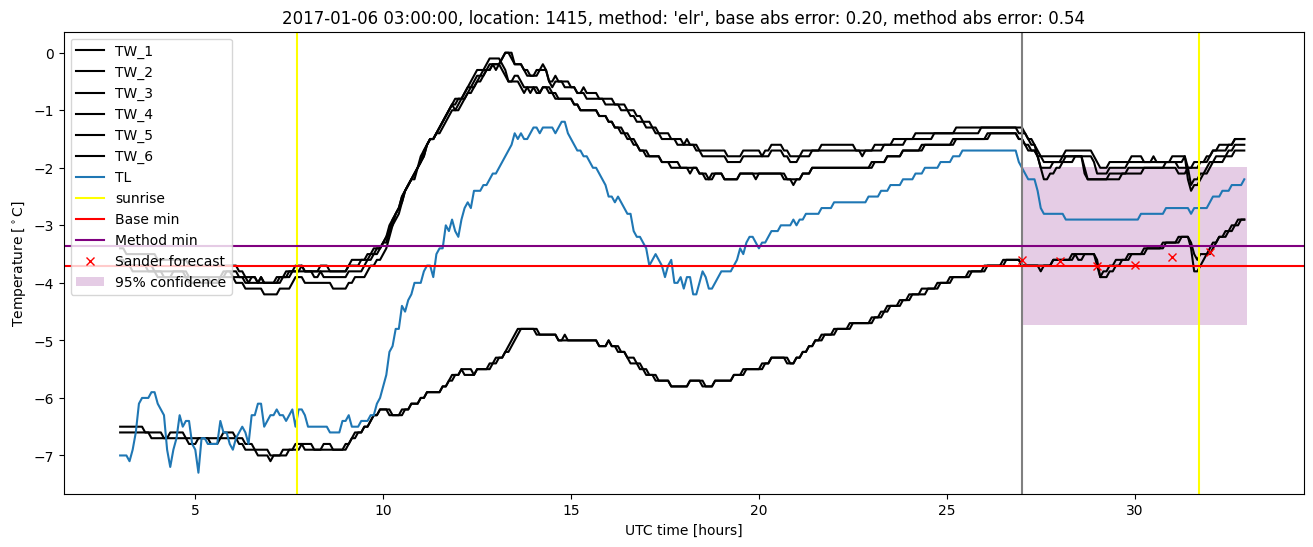
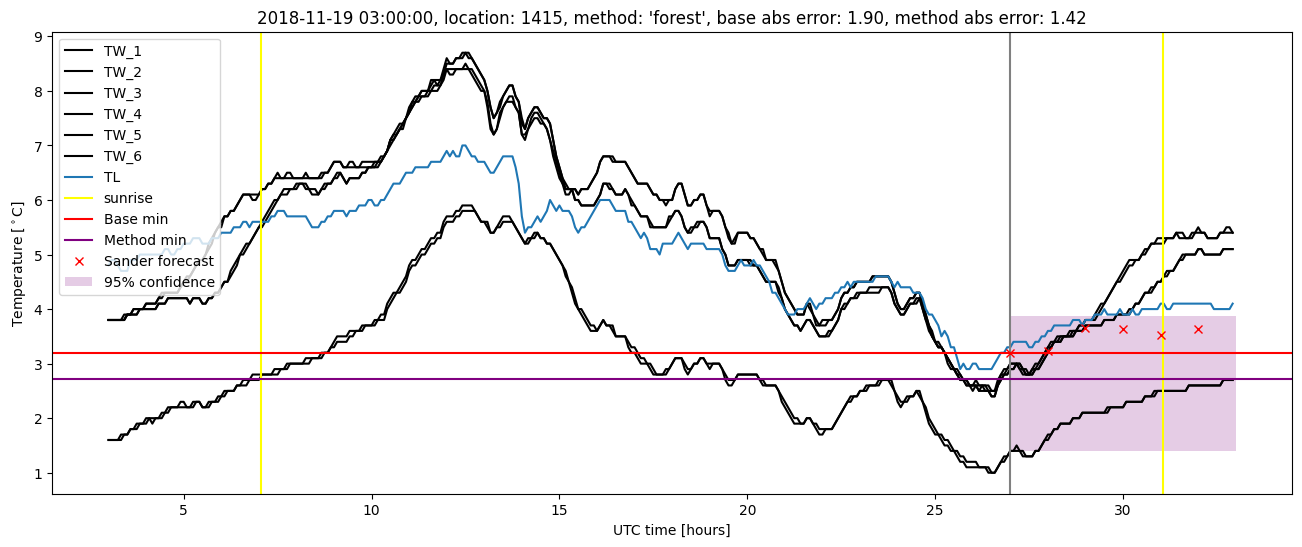
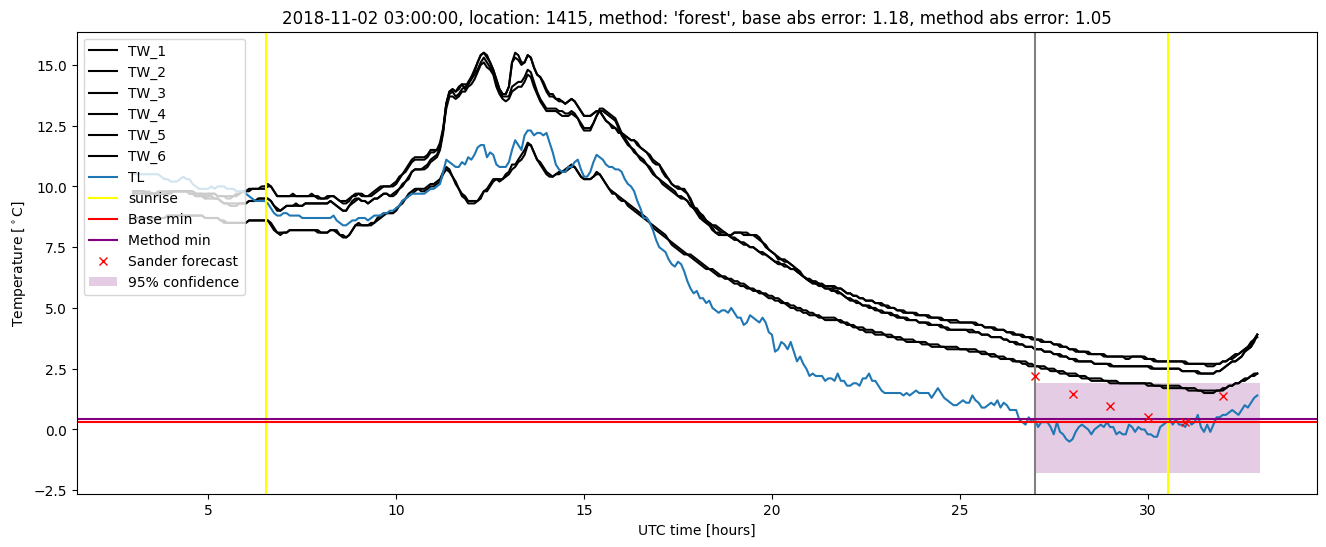
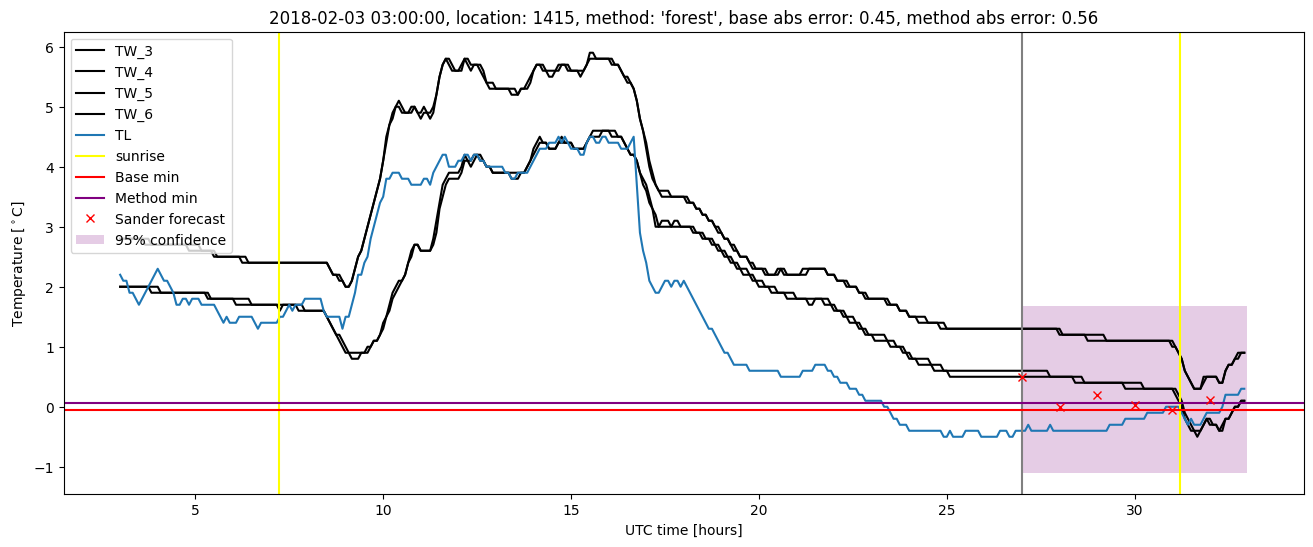
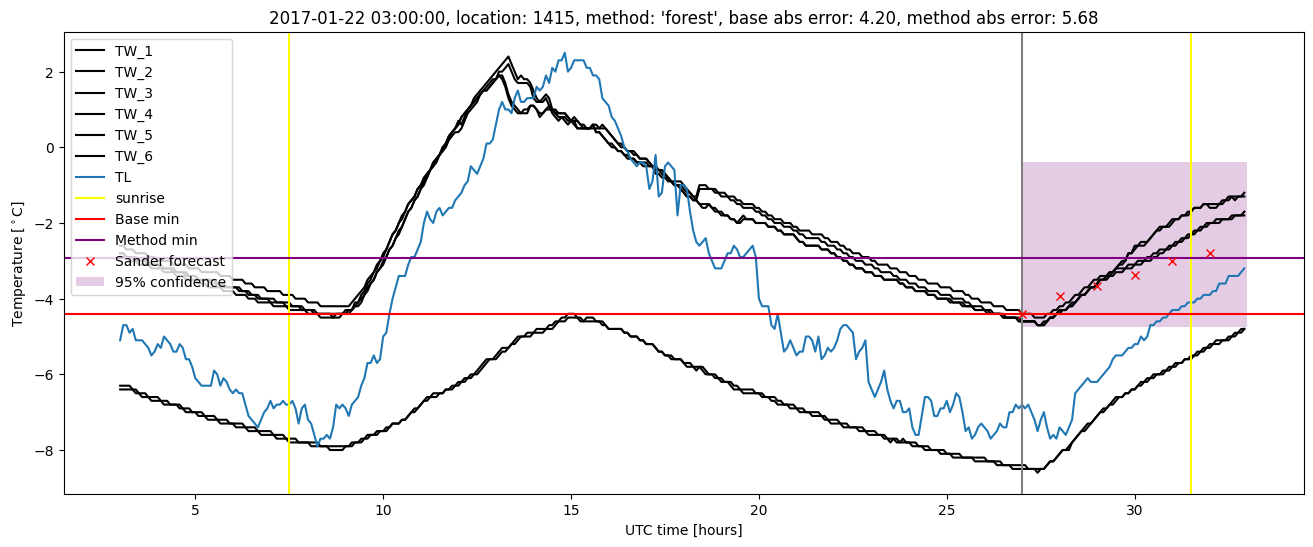
GMS location: 1415
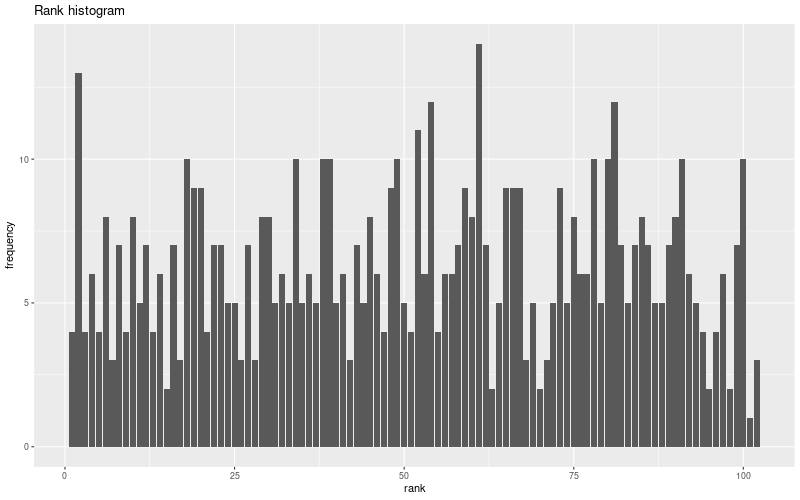
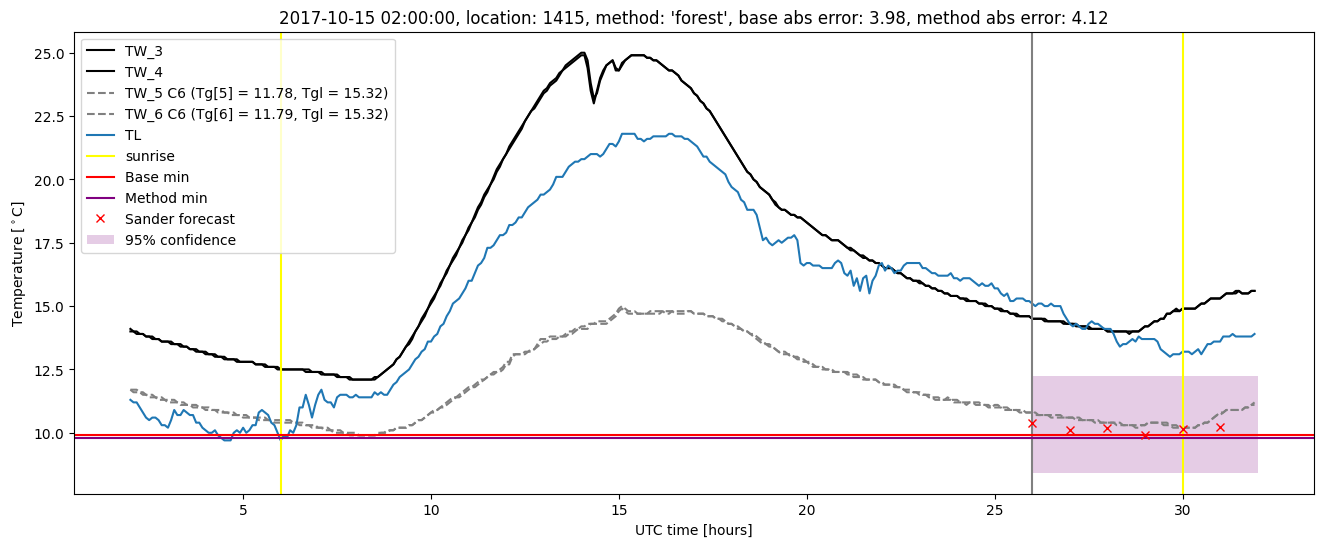
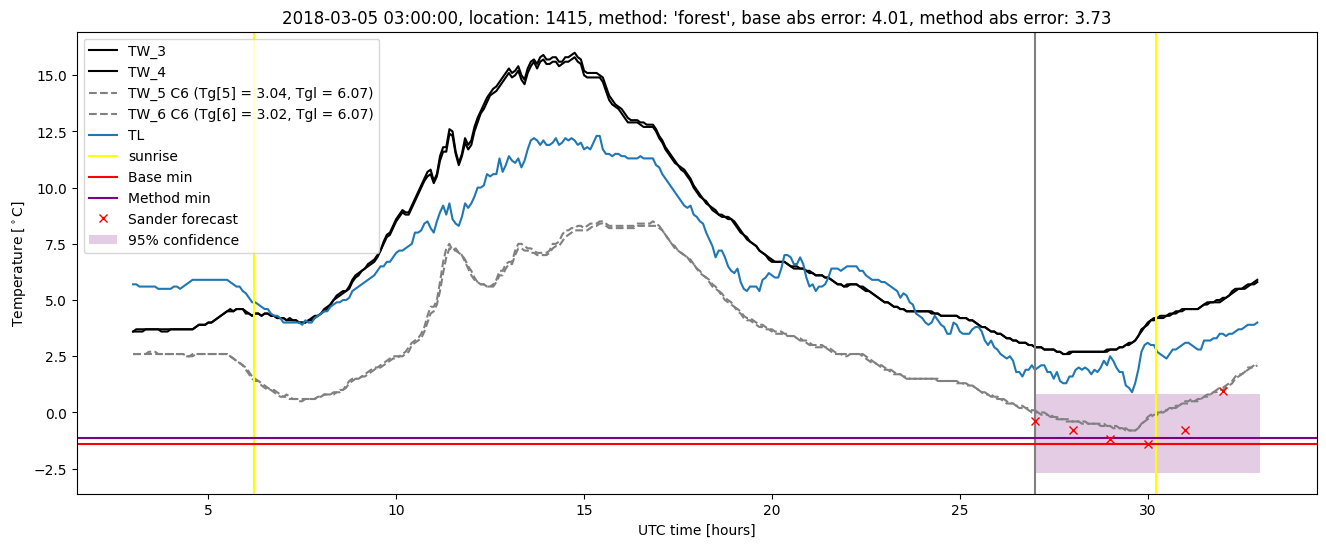
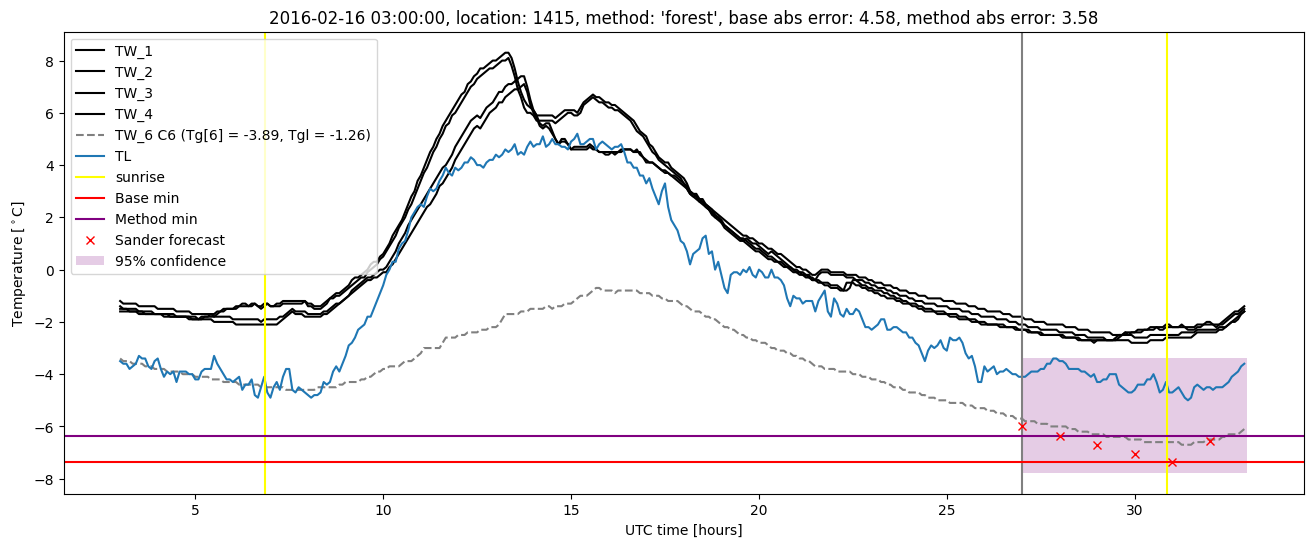
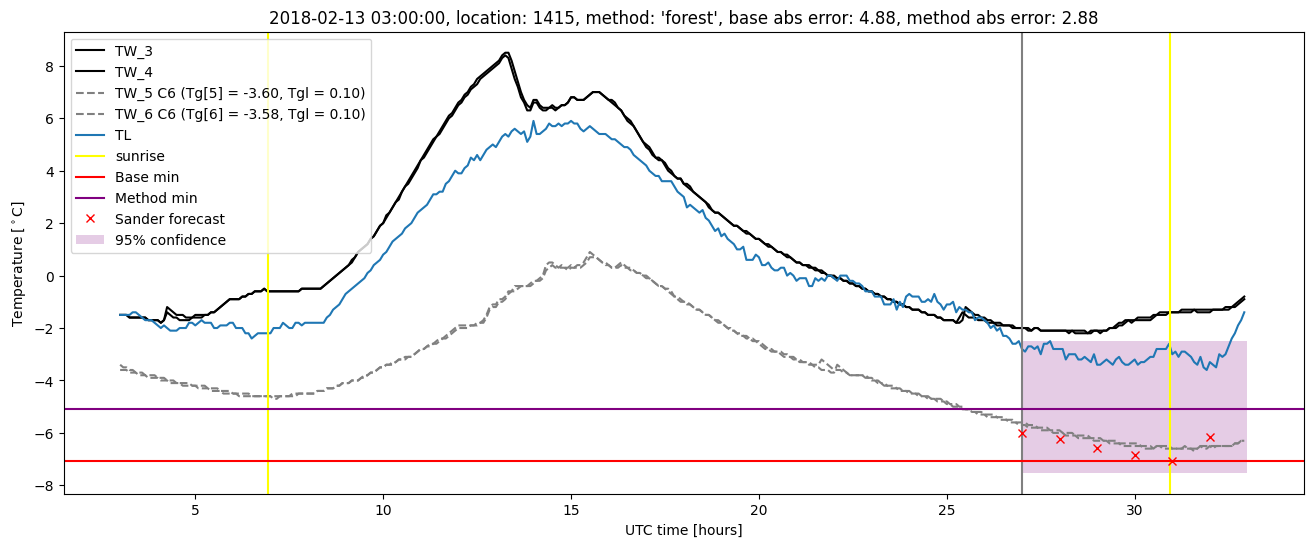
Random forest results
| names |
period |
power |
significance |
meanSquareError |
absError |
maxError |
CRPS |
IGN |
| baseline |
winter 2016 |
0.987 |
0.121 |
0.724 |
0.585 |
4.577 |
NaN |
NaN |
| forest |
winter 2016 |
0.974 |
0.030 |
0.619 |
0.545 |
3.578 |
0.486 |
1.439 |
| baseline |
winter 2017 |
0.971 |
0.085 |
1.012 |
0.677 |
4.200 |
NaN |
NaN |
| forest |
winter 2017 |
0.981 |
0.085 |
0.852 |
0.619 |
5.679 |
0.516 |
1.599 |
| baseline |
winter 2018 |
0.967 |
0.026 |
1.230 |
0.682 |
4.876 |
NaN |
NaN |
| forest |
winter 2018 |
0.950 |
0.053 |
0.909 |
0.649 |
4.118 |
0.542 |
1.662 |
| baseline |
winter 2019 |
0.984 |
0.136 |
0.492 |
0.491 |
2.483 |
NaN |
NaN |
| forest |
winter 2019 |
0.984 |
0.091 |
0.408 |
0.470 |
2.675 |
0.480 |
1.400 |
| baseline |
all |
0.978 |
0.086 |
0.862 |
0.609 |
4.876 |
NaN |
NaN |
| forest |
all |
0.972 |
0.064 |
0.696 |
0.571 |
5.679 |
0.506 |
1.522 |
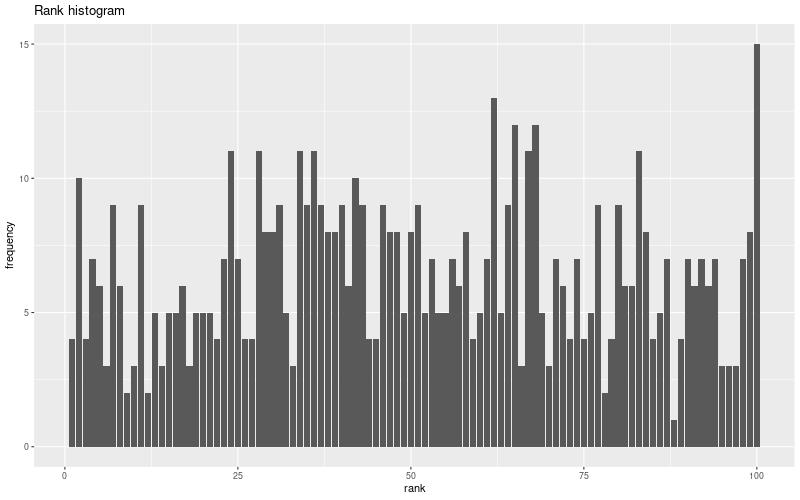
Random forest plots
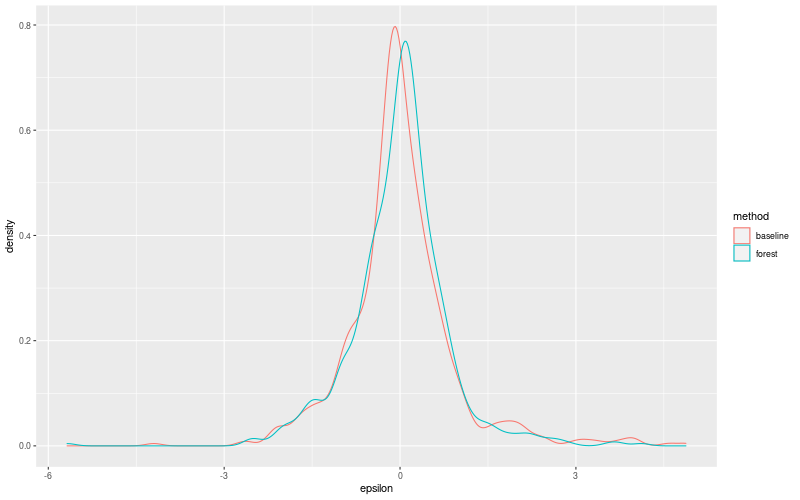
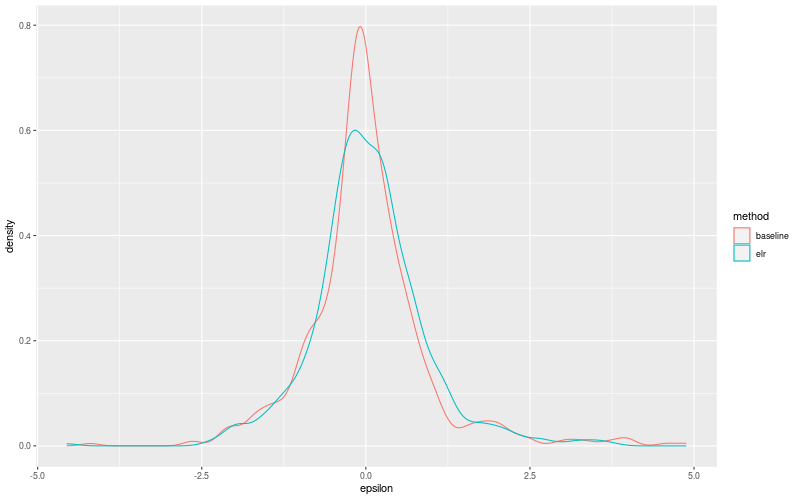
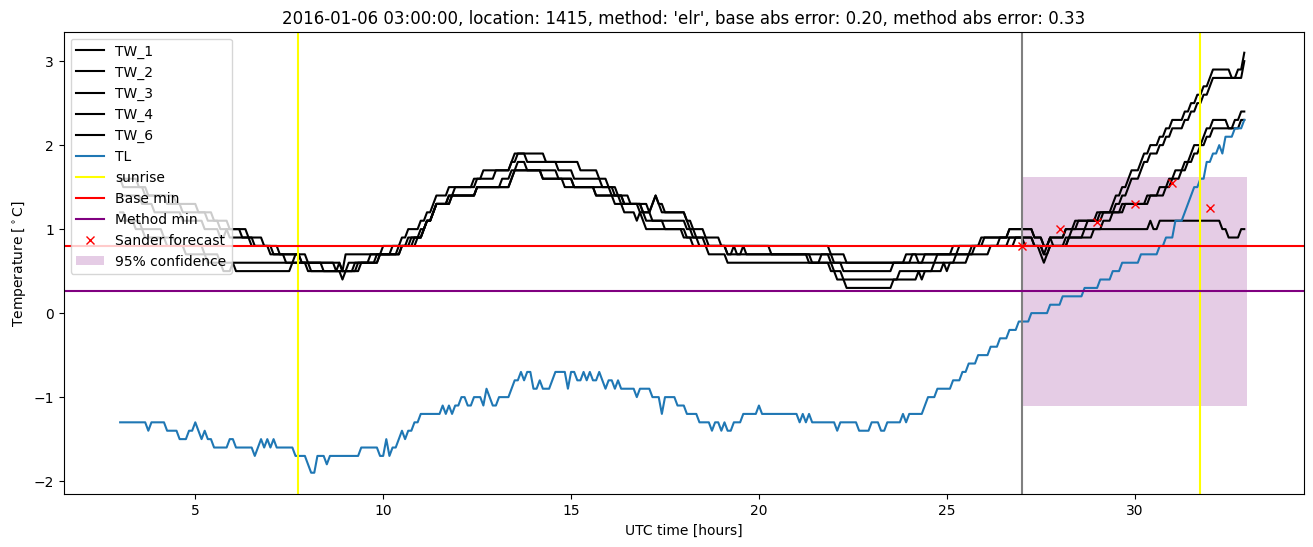
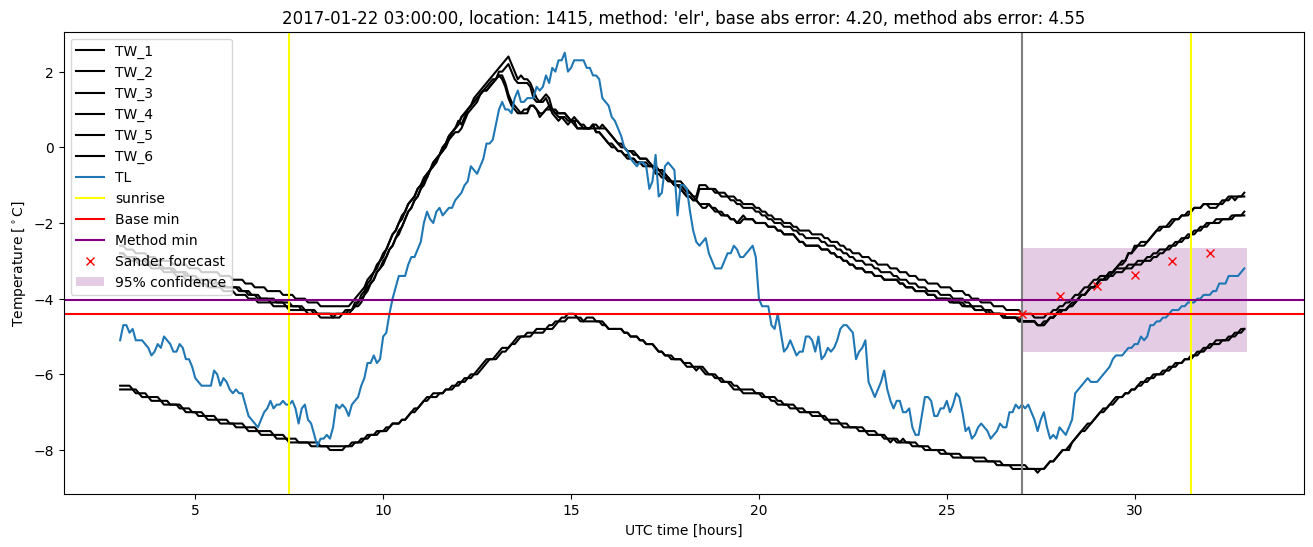
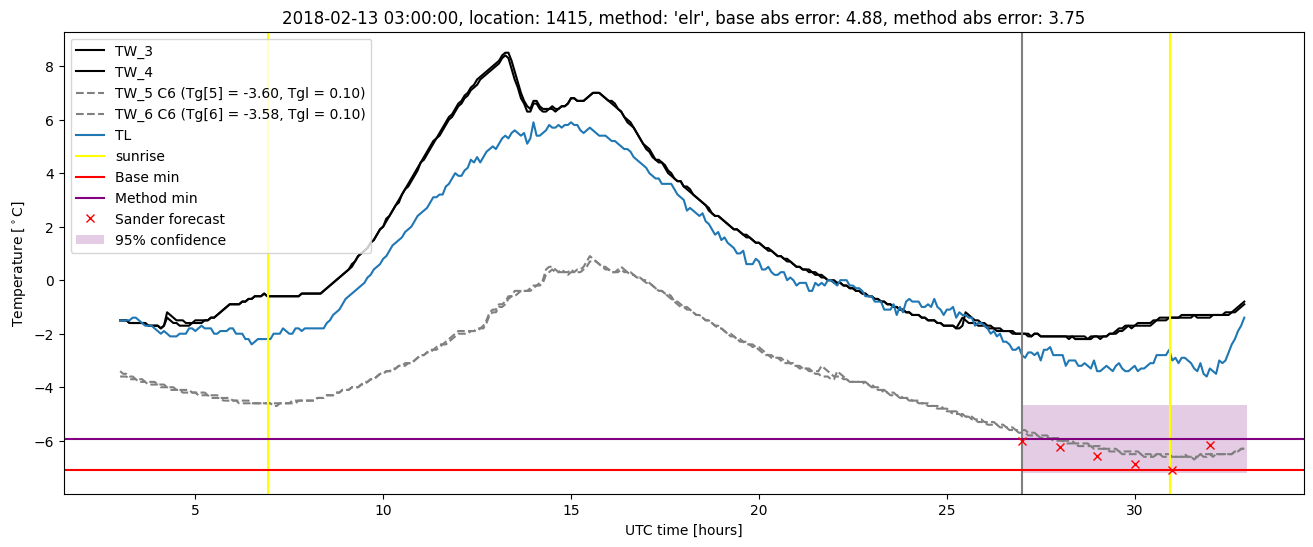
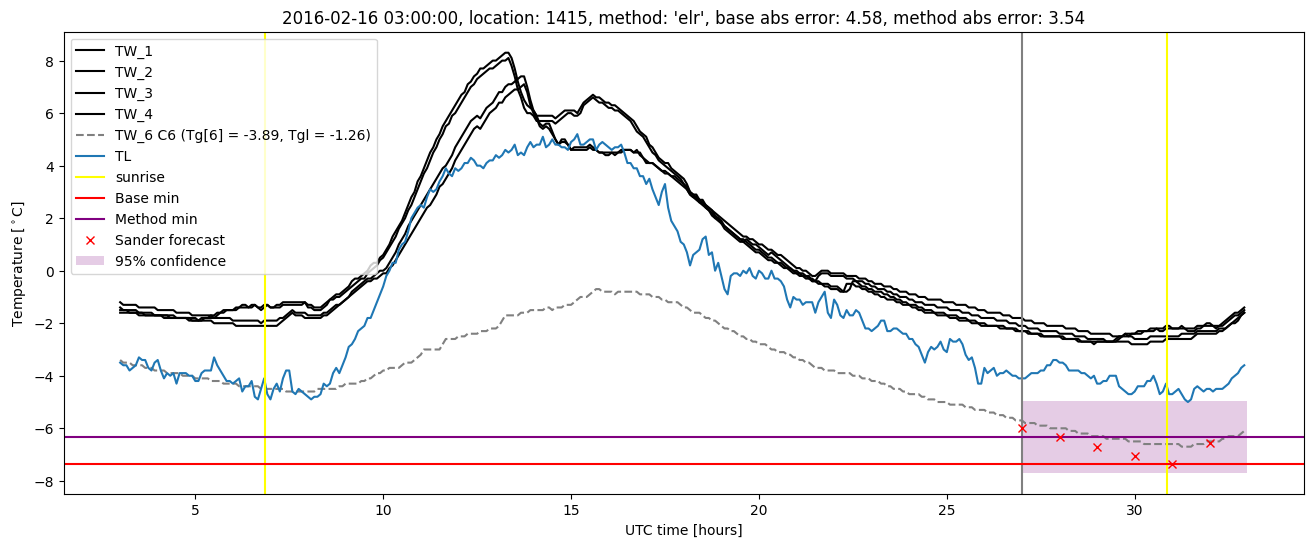
Extended logistic regression results
| names |
period |
power |
significance |
meanSquareError |
absError |
maxError |
CRPS |
IGN |
| baseline |
winter 2016 |
0.987 |
0.121 |
0.724 |
0.585 |
4.577 |
NaN |
NaN |
| elr |
winter 2016 |
0.981 |
0.091 |
0.576 |
0.562 |
3.539 |
0.530 |
1.460 |
| baseline |
winter 2017 |
0.971 |
0.085 |
1.012 |
0.677 |
4.200 |
NaN |
NaN |
| elr |
winter 2017 |
0.971 |
0.128 |
0.968 |
0.666 |
4.552 |
0.439 |
1.163 |
| baseline |
winter 2018 |
0.967 |
0.026 |
1.230 |
0.682 |
4.876 |
NaN |
NaN |
| elr |
winter 2018 |
0.958 |
0.079 |
0.939 |
0.693 |
3.747 |
0.519 |
1.568 |
| baseline |
winter 2019 |
0.984 |
0.136 |
0.492 |
0.491 |
2.483 |
NaN |
NaN |
| elr |
winter 2019 |
0.984 |
0.182 |
0.536 |
0.561 |
2.249 |
0.560 |
1.524 |
| baseline |
all |
0.978 |
0.086 |
0.862 |
0.609 |
4.876 |
NaN |
NaN |
| elr |
all |
0.974 |
0.114 |
0.748 |
0.618 |
4.552 |
0.513 |
1.431 |
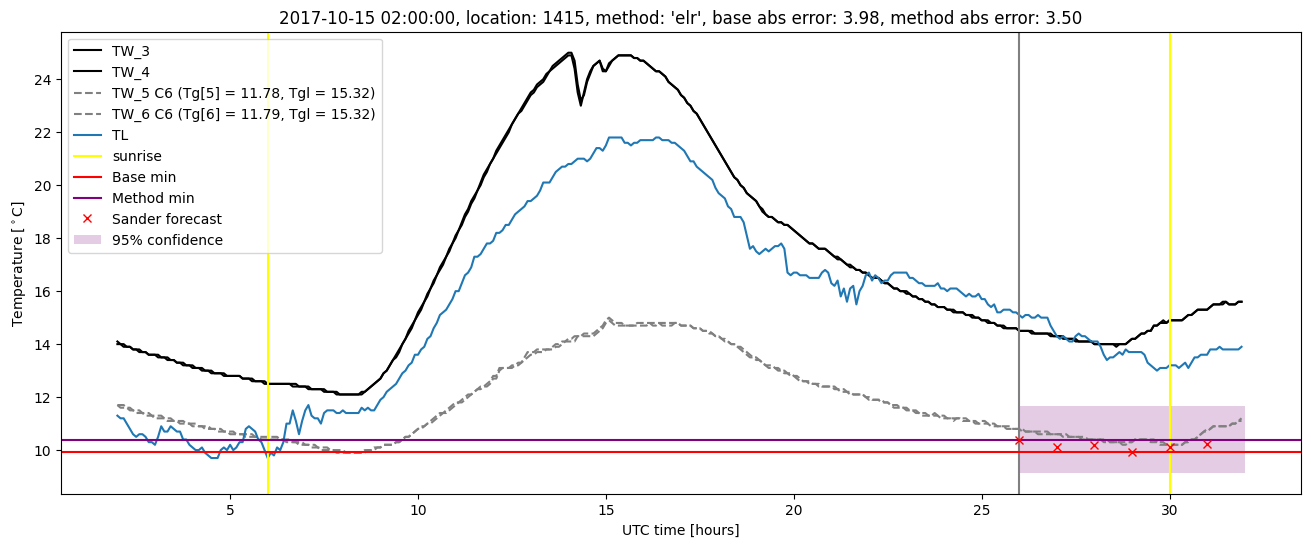
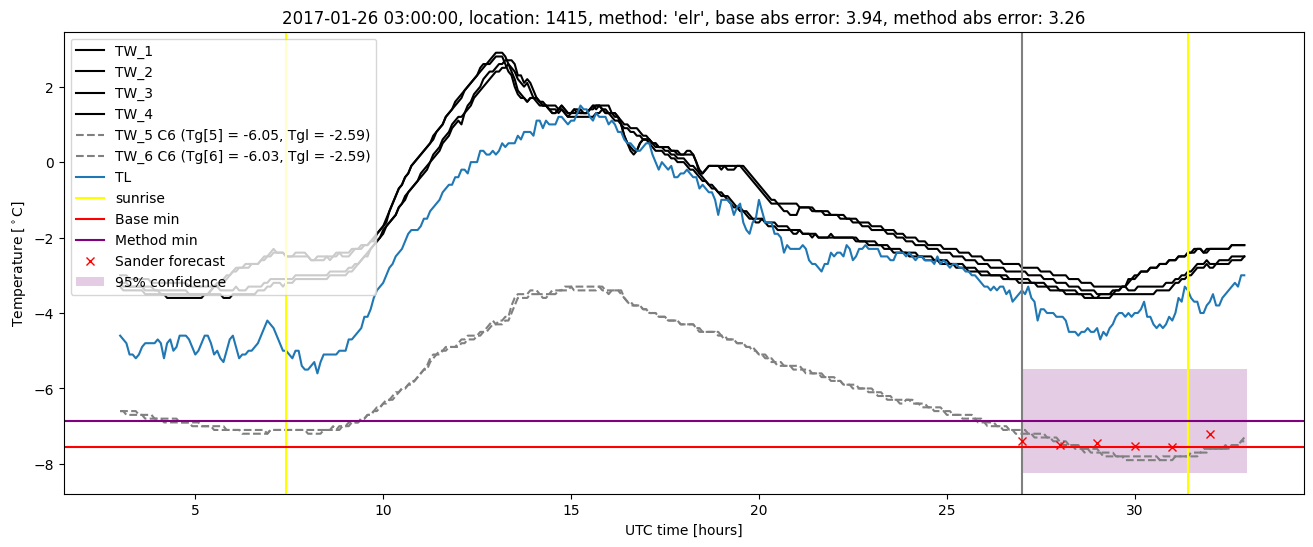
Extended logistic regression plots