GMS location: 1414
Random forest results
| names |
period |
power |
significance |
meanSquareError |
absError |
maxError |
CRPS |
IGN |
| baseline |
winter 2016 |
0.994 |
0.083 |
0.383 |
0.450 |
1.855 |
NaN |
NaN |
| forest |
winter 2016 |
0.994 |
0.056 |
0.356 |
0.451 |
1.829 |
0.545 |
2.921 |
| baseline |
winter 2017 |
0.978 |
0.048 |
0.487 |
0.501 |
2.846 |
NaN |
NaN |
| forest |
winter 2017 |
0.967 |
0.048 |
0.430 |
0.473 |
2.208 |
0.528 |
3.697 |
| baseline |
winter 2018 |
0.986 |
0.051 |
0.370 |
0.454 |
1.996 |
NaN |
NaN |
| forest |
winter 2018 |
0.978 |
0.051 |
0.340 |
0.437 |
1.871 |
0.519 |
2.845 |
| baseline |
winter 2019 |
0.993 |
0.158 |
0.334 |
0.419 |
1.946 |
NaN |
NaN |
| forest |
winter 2019 |
0.993 |
0.158 |
0.297 |
0.412 |
1.806 |
0.534 |
2.689 |
| baseline |
all |
0.989 |
0.073 |
0.389 |
0.454 |
2.846 |
NaN |
NaN |
| forest |
all |
0.985 |
0.066 |
0.353 |
0.443 |
2.208 |
0.532 |
3.001 |
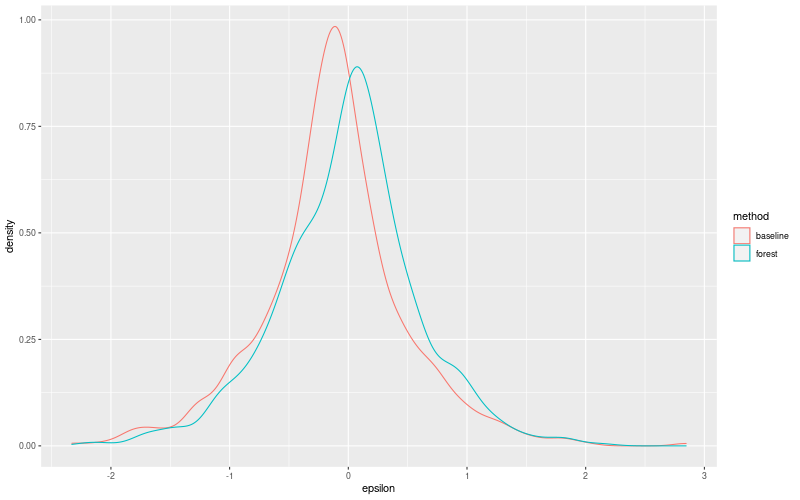
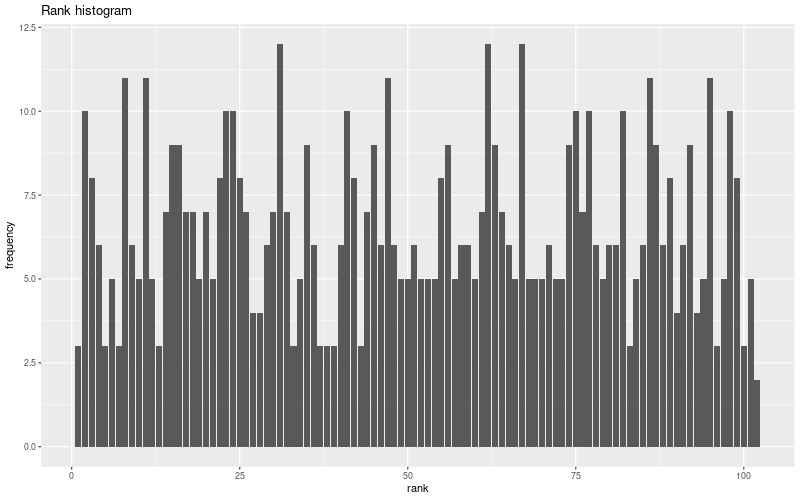
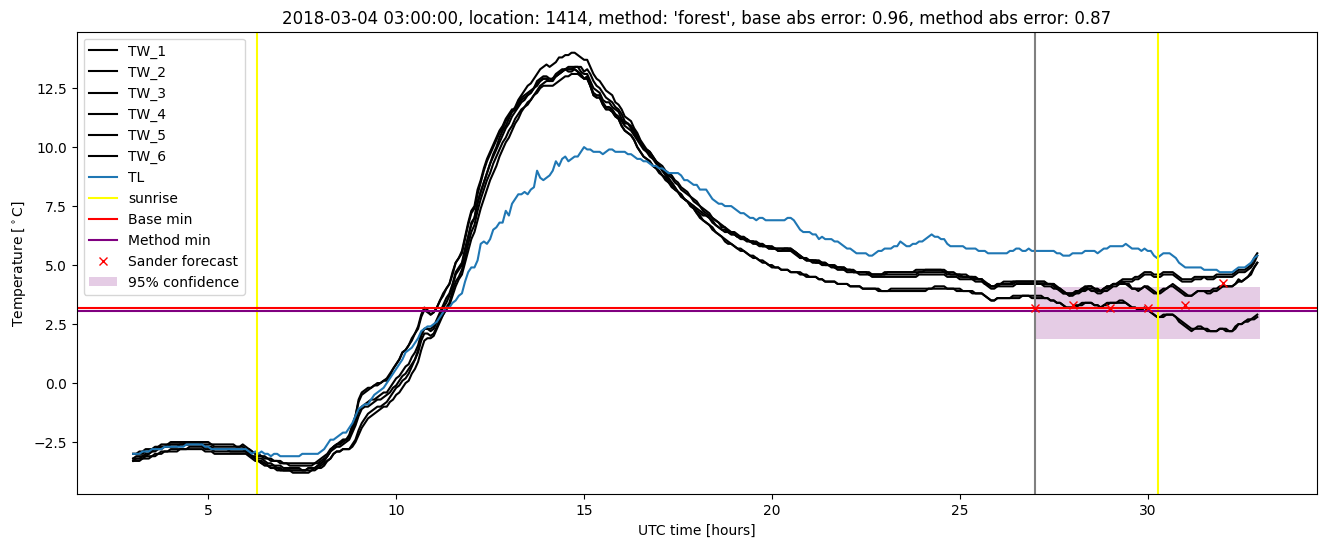
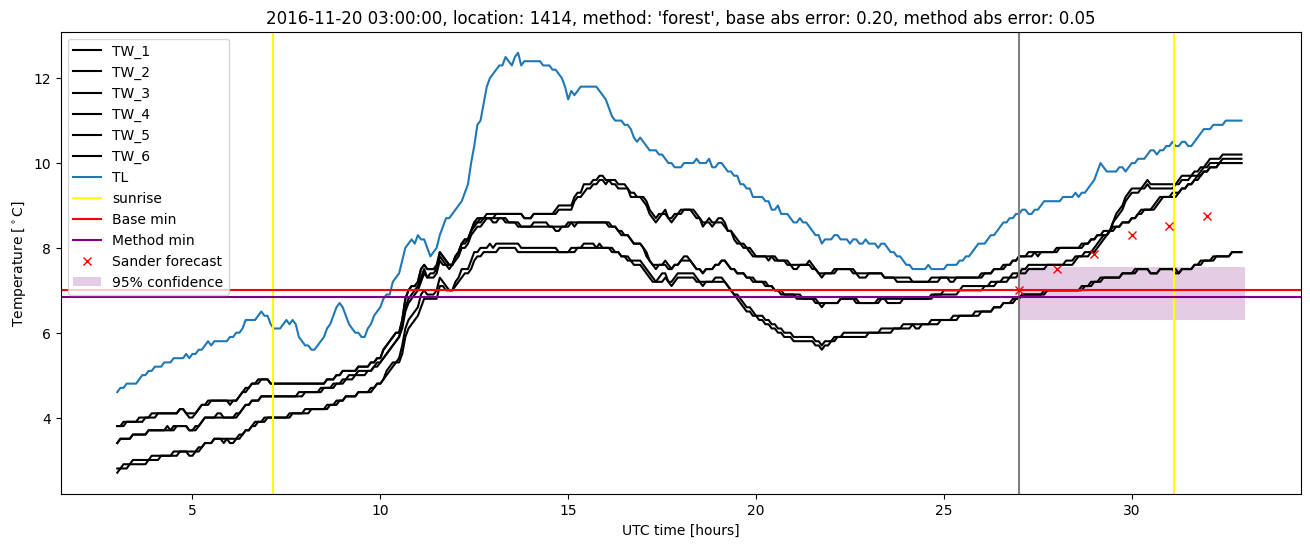
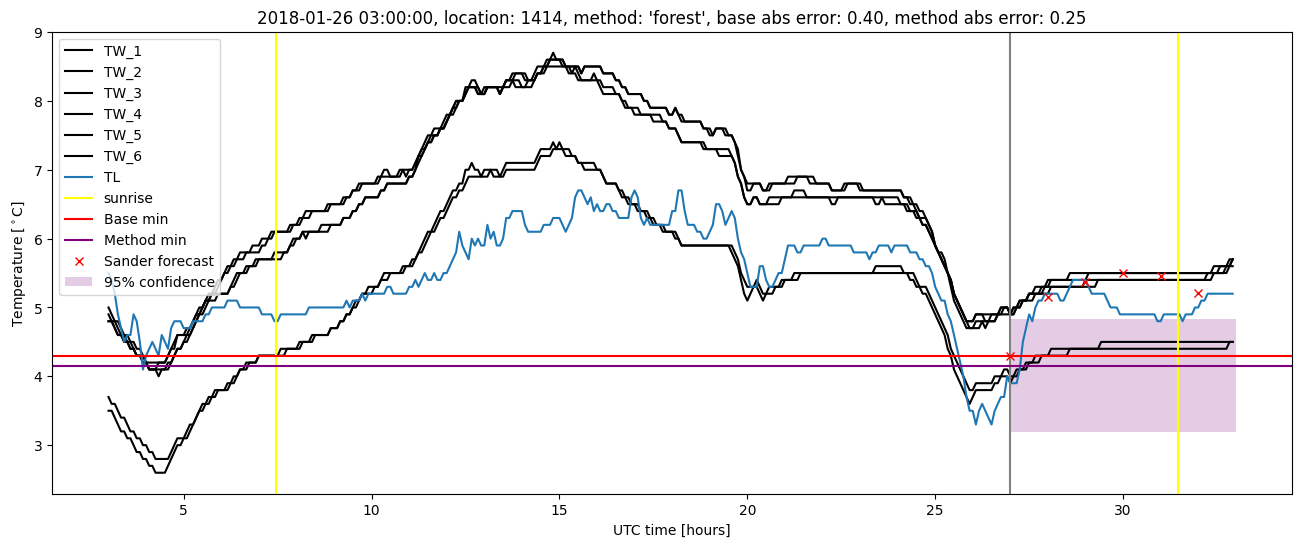
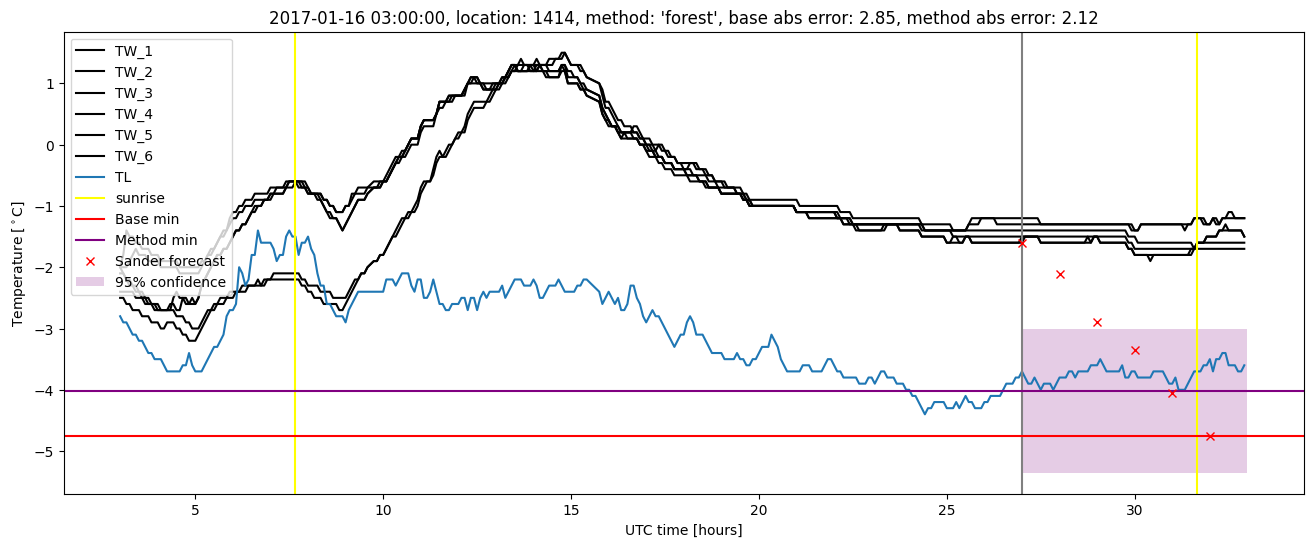
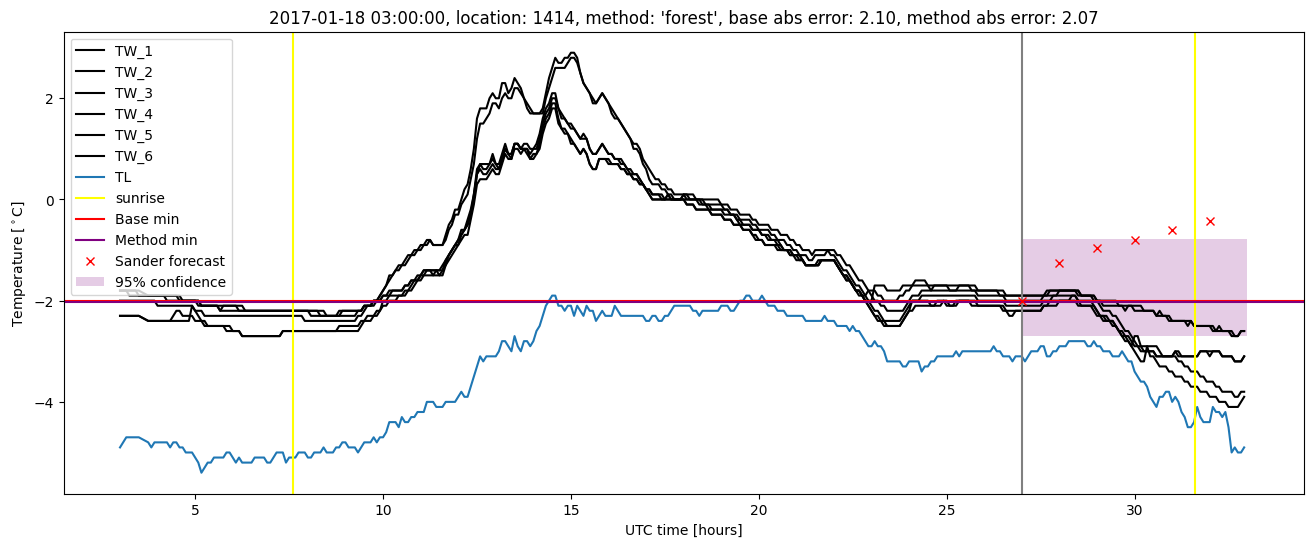
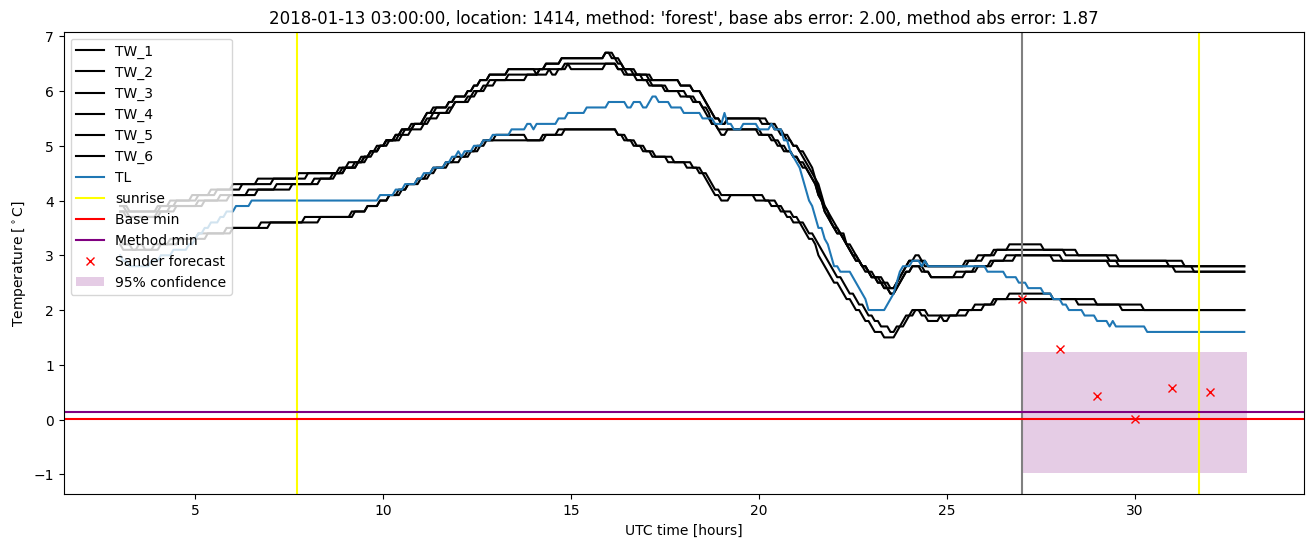
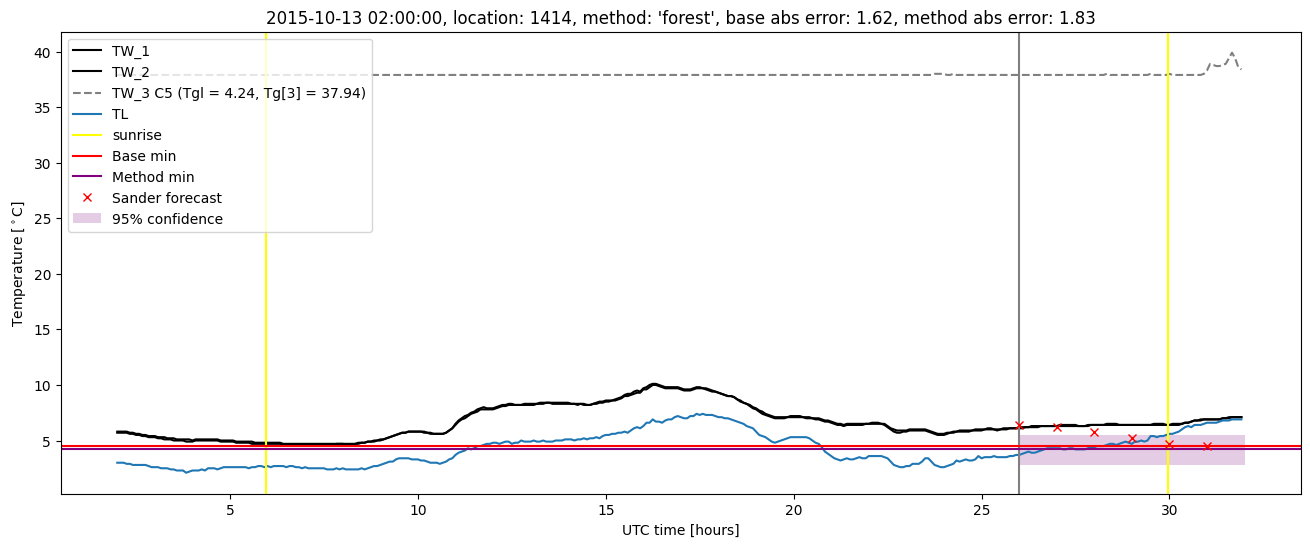
Random forest plots

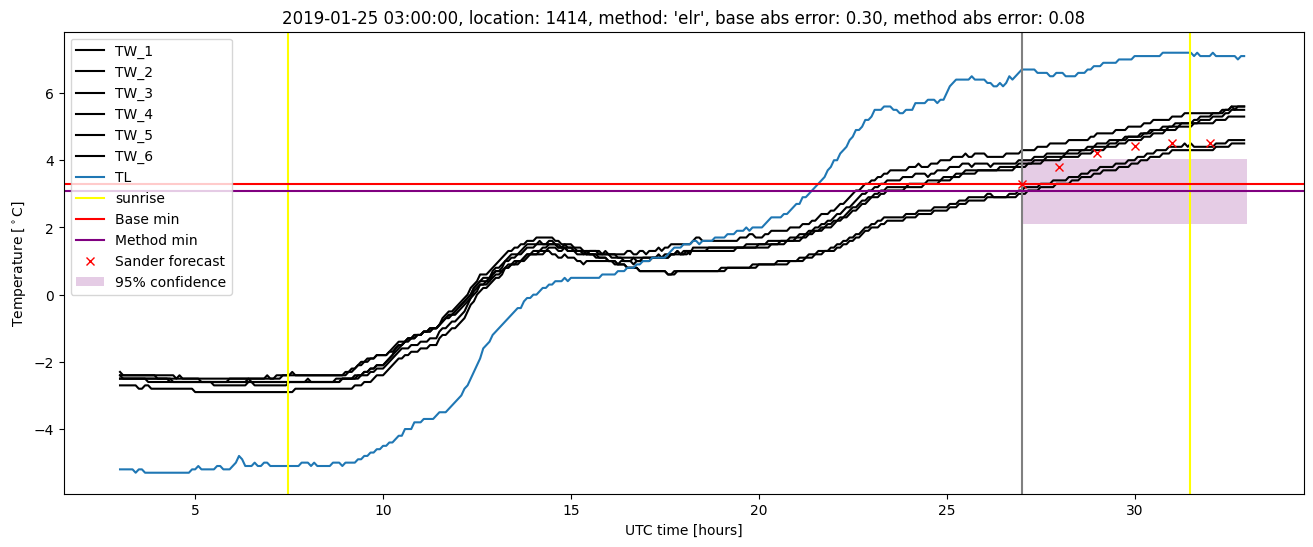
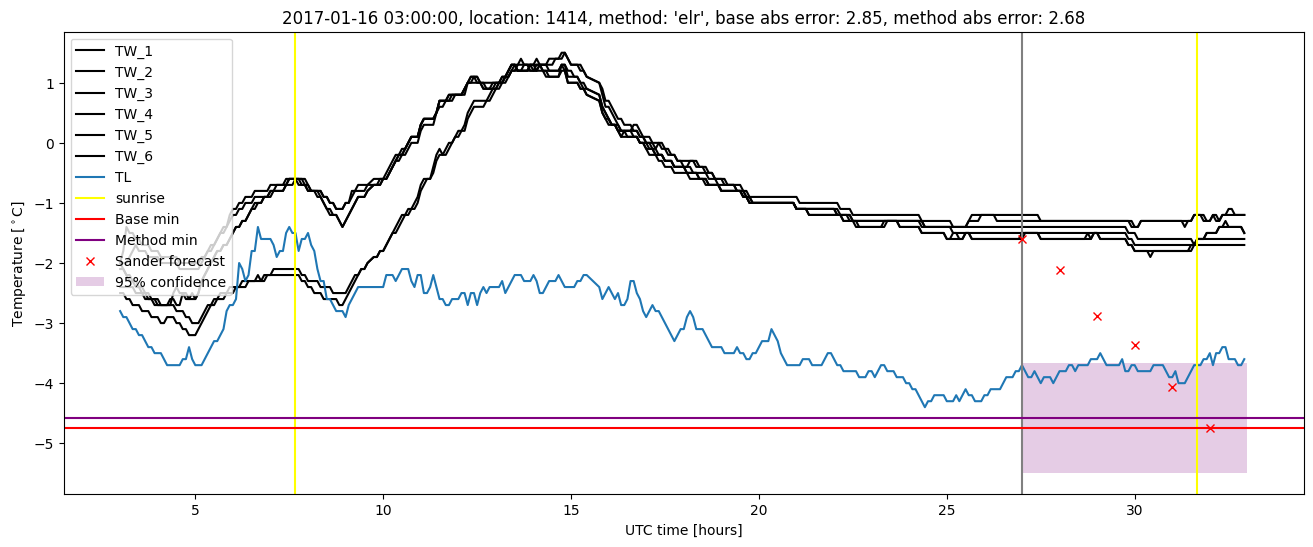
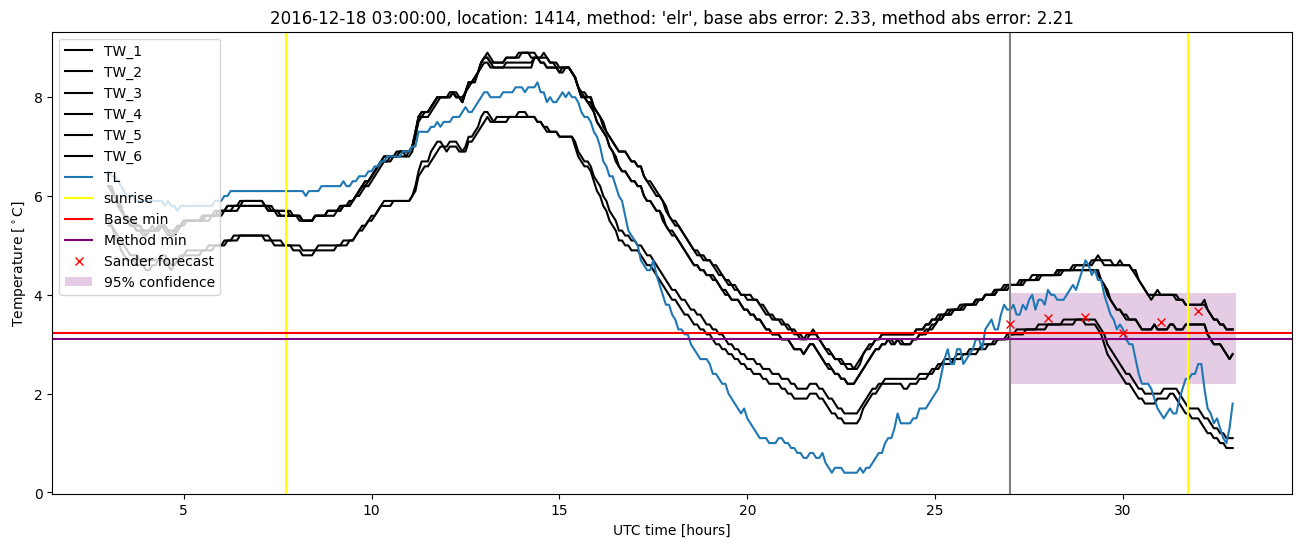
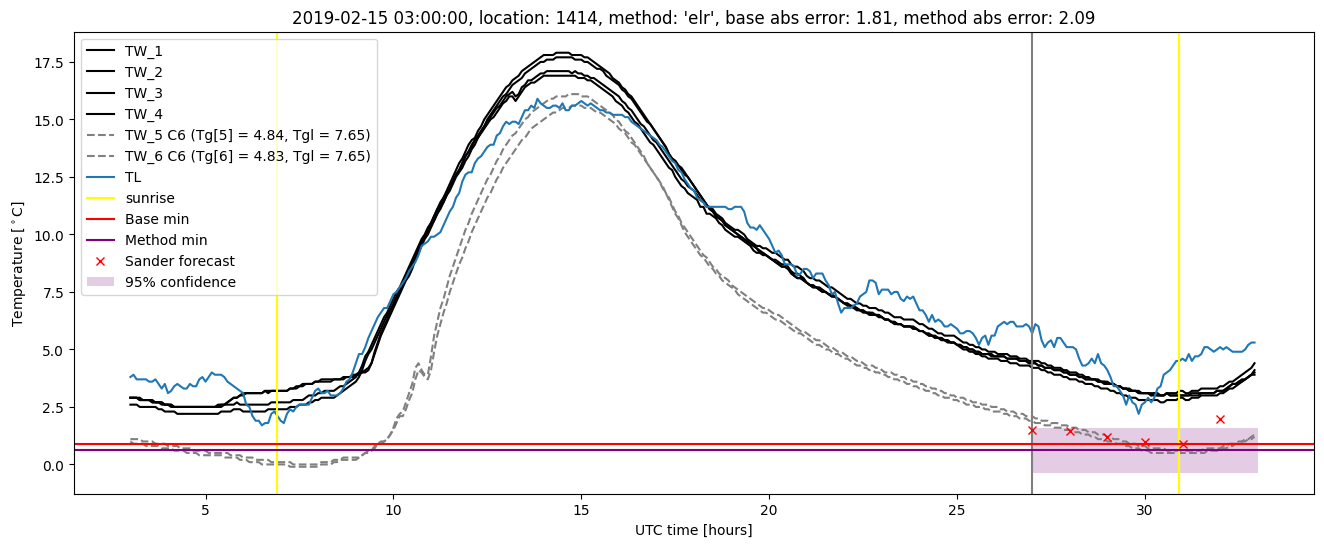
Extended logistic regression results
| names |
period |
power |
significance |
meanSquareError |
absError |
maxError |
CRPS |
IGN |
| baseline |
winter 2016 |
0.994 |
0.083 |
0.383 |
0.450 |
1.855 |
NaN |
NaN |
| elr |
winter 2016 |
0.994 |
0.028 |
0.352 |
0.457 |
1.751 |
0.599 |
4.505 |
| baseline |
winter 2017 |
0.978 |
0.048 |
0.487 |
0.501 |
2.846 |
NaN |
NaN |
| elr |
winter 2017 |
0.967 |
0.071 |
0.455 |
0.492 |
2.675 |
0.573 |
4.131 |
| baseline |
winter 2018 |
0.986 |
0.051 |
0.370 |
0.454 |
1.996 |
NaN |
NaN |
| elr |
winter 2018 |
0.971 |
0.051 |
0.401 |
0.484 |
2.070 |
0.596 |
4.209 |
| baseline |
winter 2019 |
0.993 |
0.158 |
0.334 |
0.419 |
1.946 |
NaN |
NaN |
| elr |
winter 2019 |
0.993 |
0.105 |
0.317 |
0.414 |
2.085 |
0.573 |
3.414 |
| baseline |
all |
0.989 |
0.073 |
0.389 |
0.454 |
2.846 |
NaN |
NaN |
| elr |
all |
0.983 |
0.059 |
0.377 |
0.461 |
2.675 |
0.587 |
4.100 |
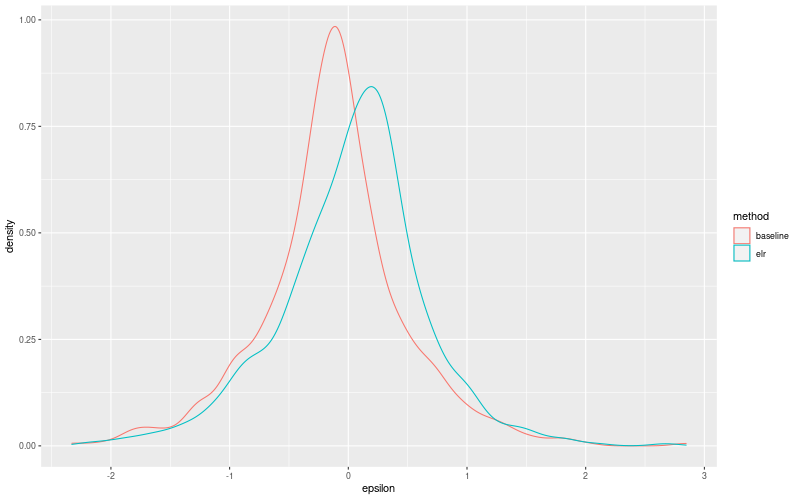
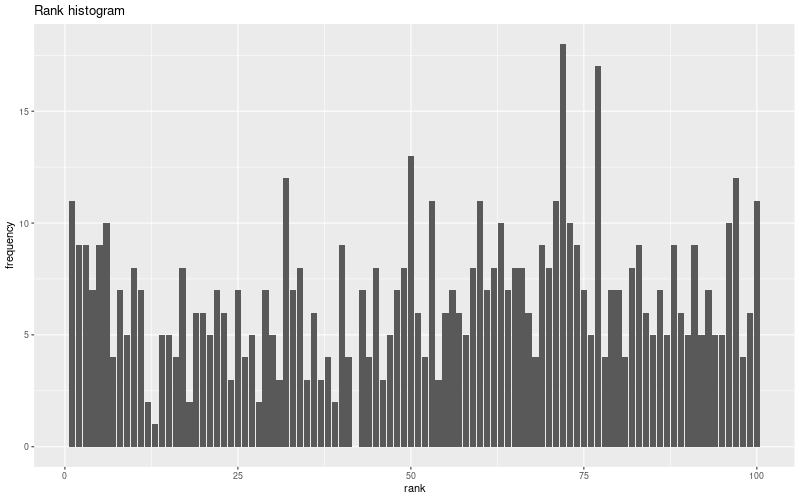
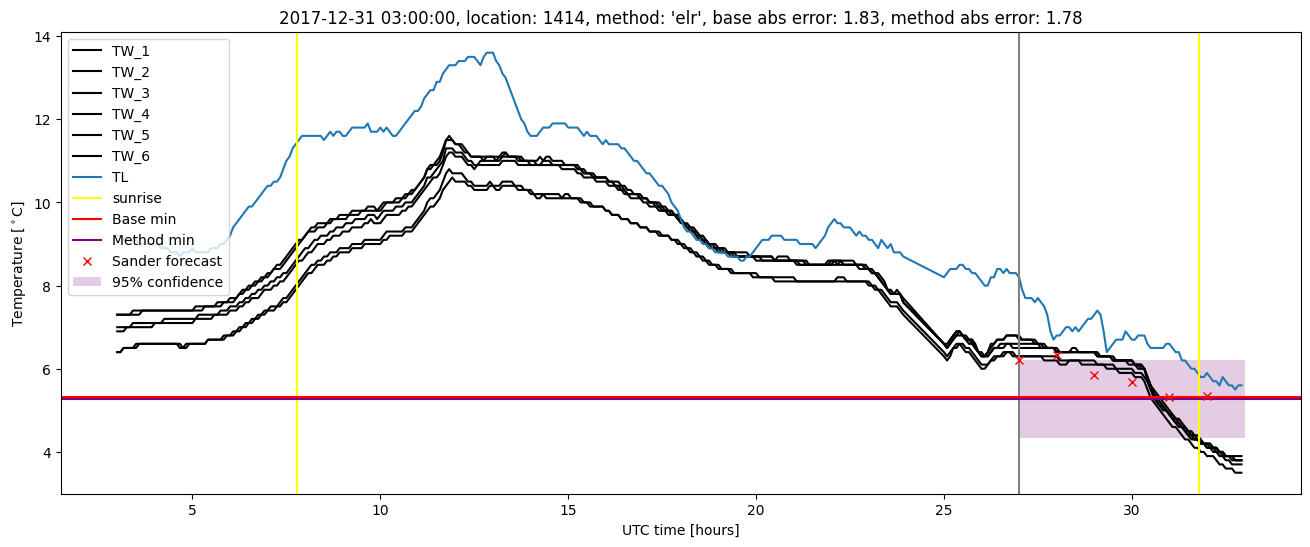
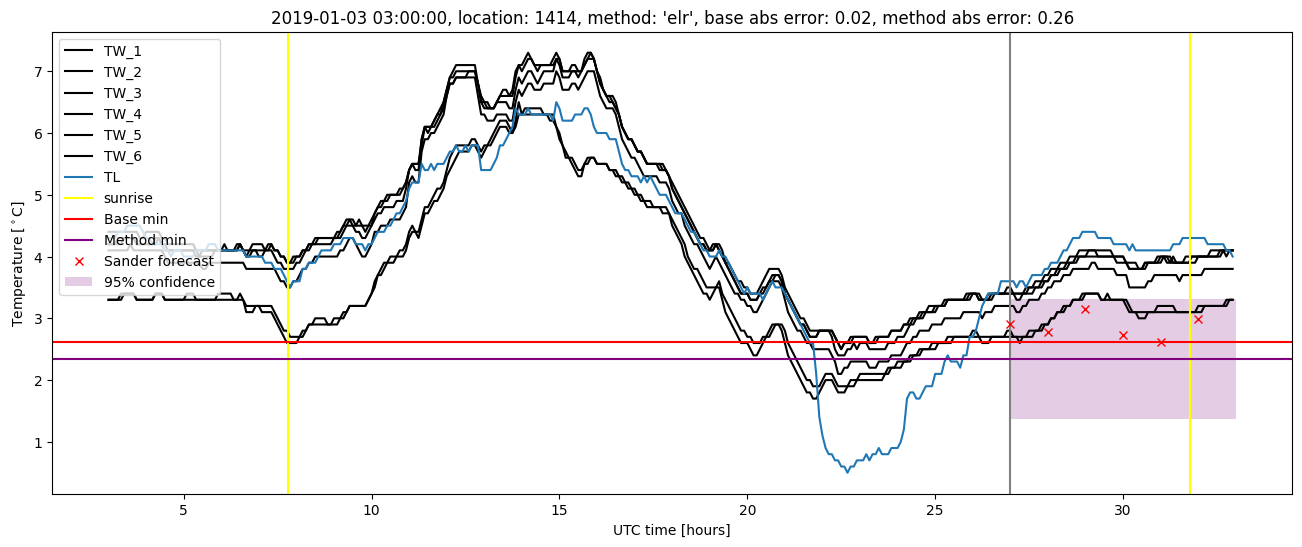
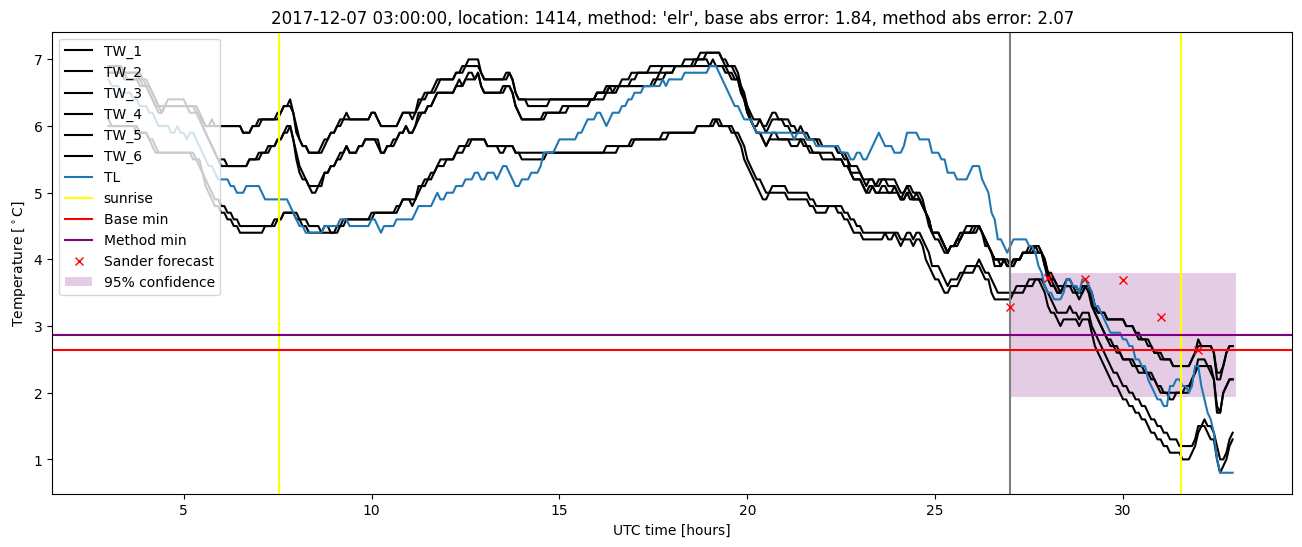
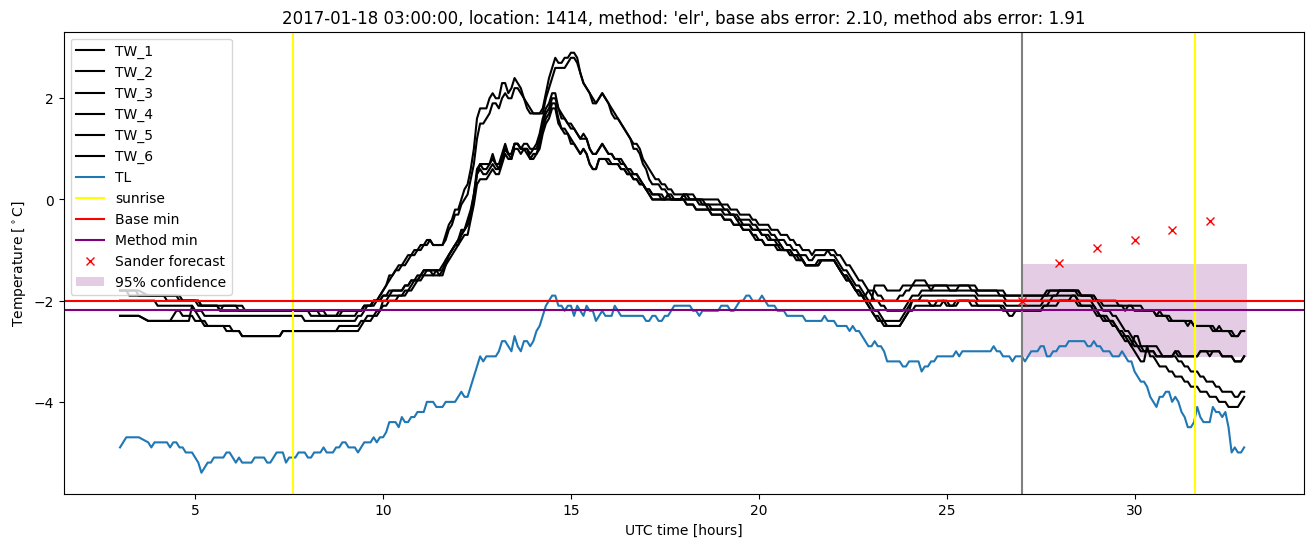
Extended logistic regression plots