GMS location: 1413
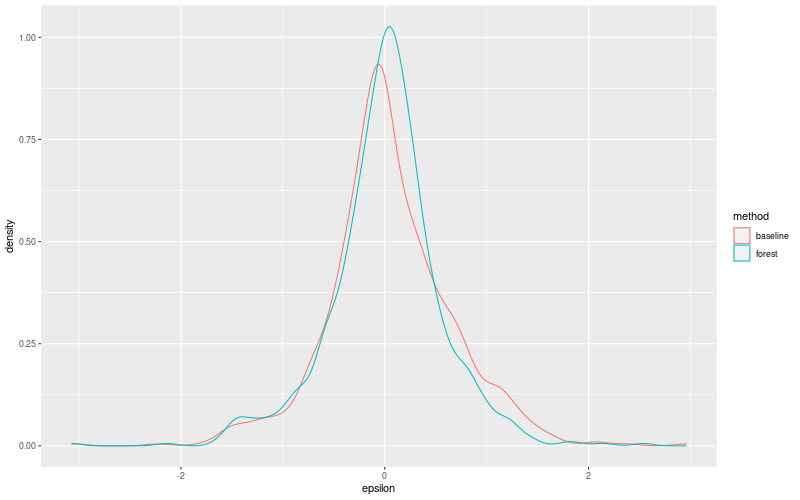
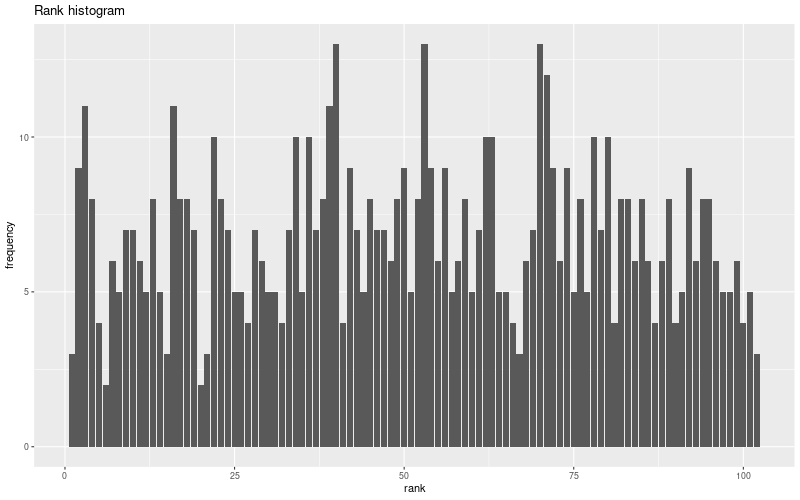
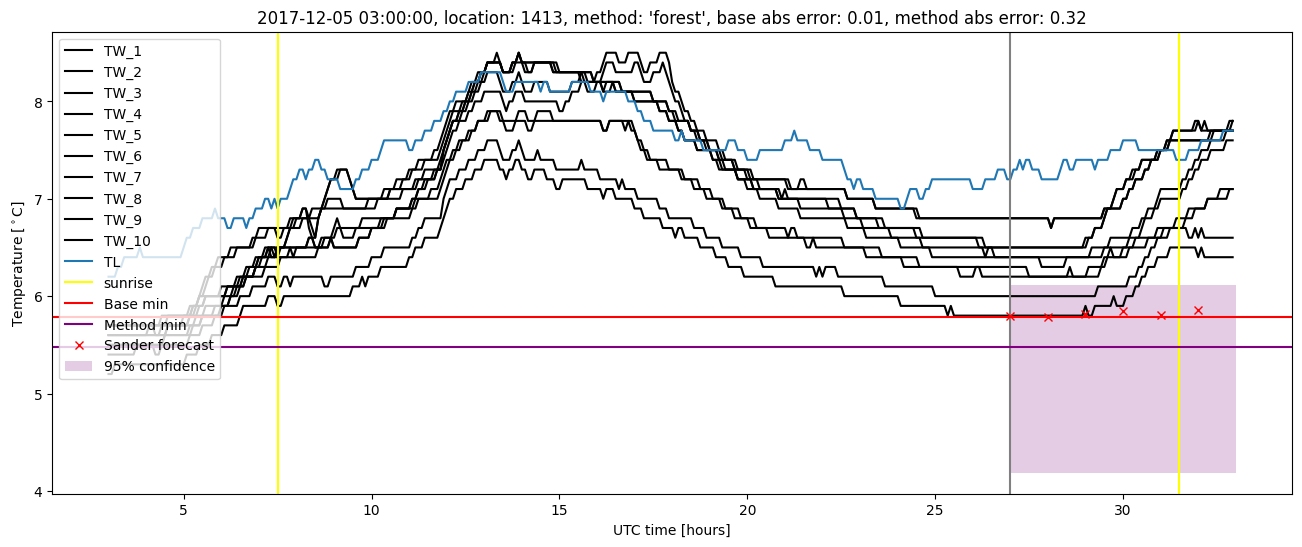
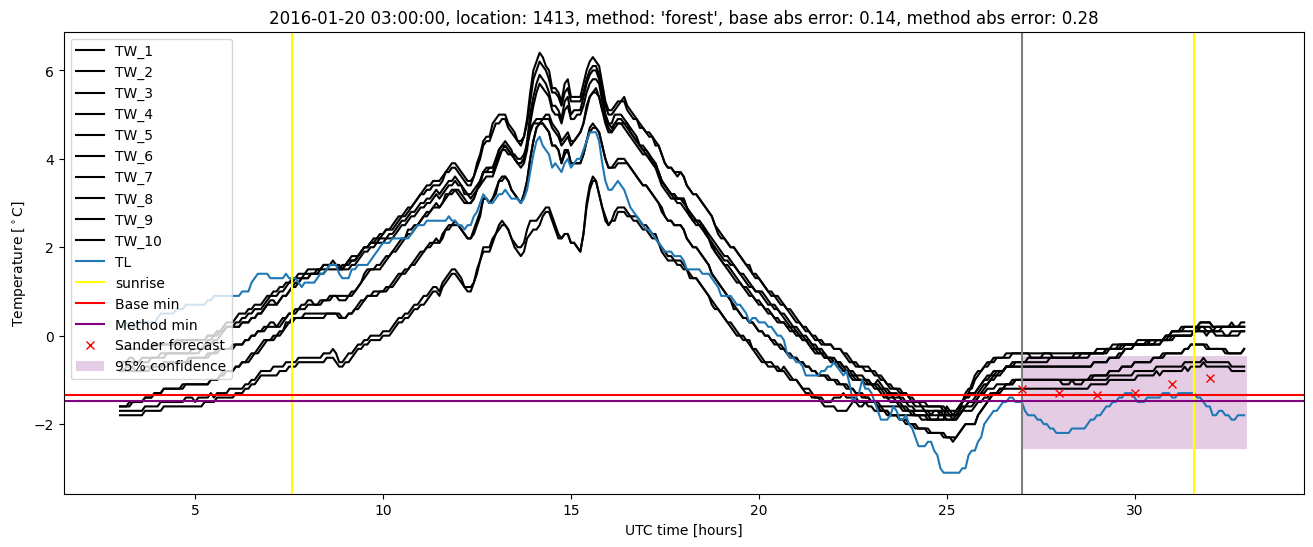
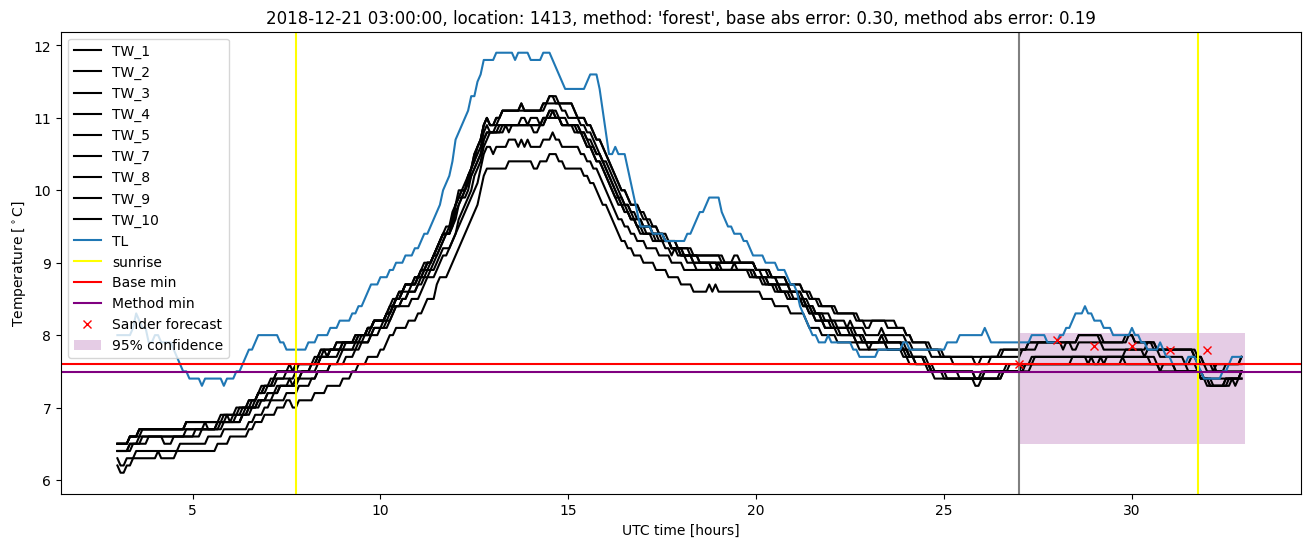
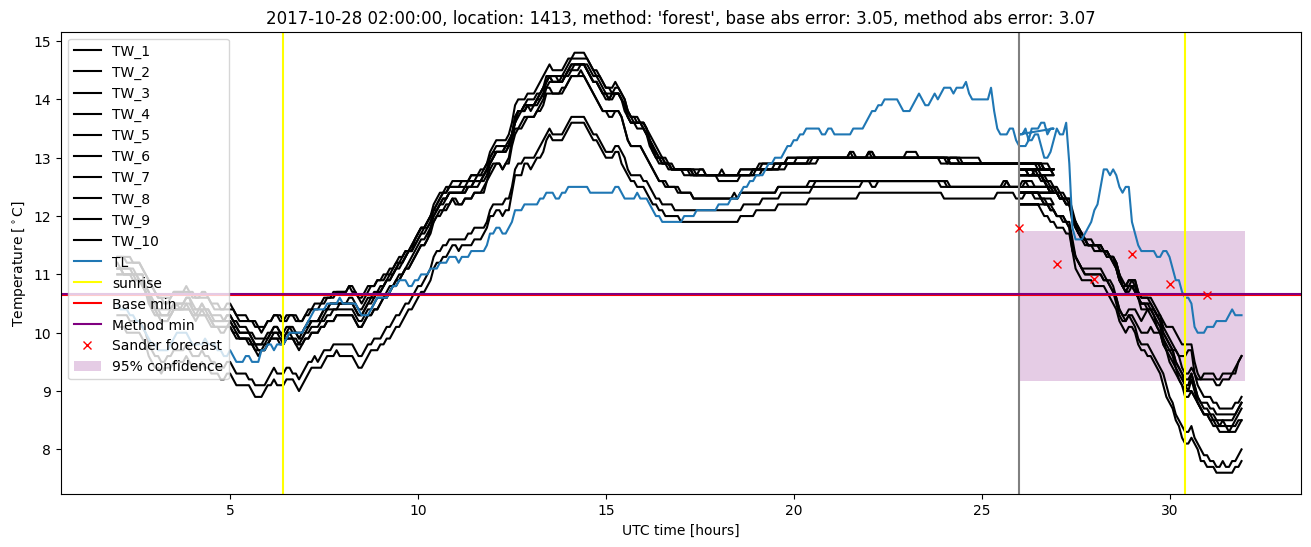
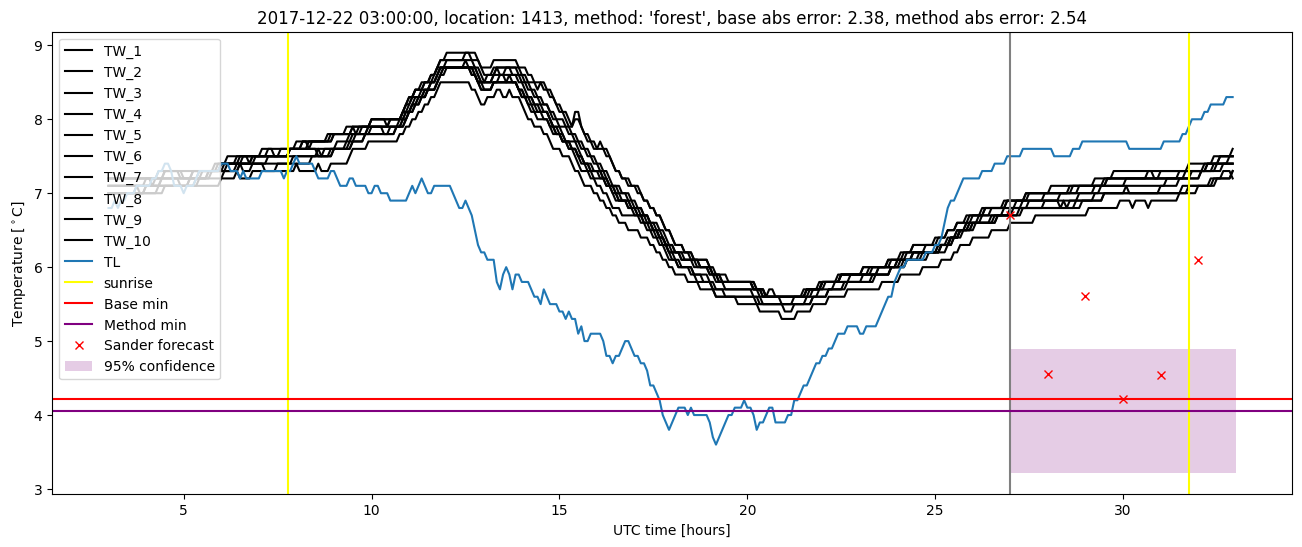
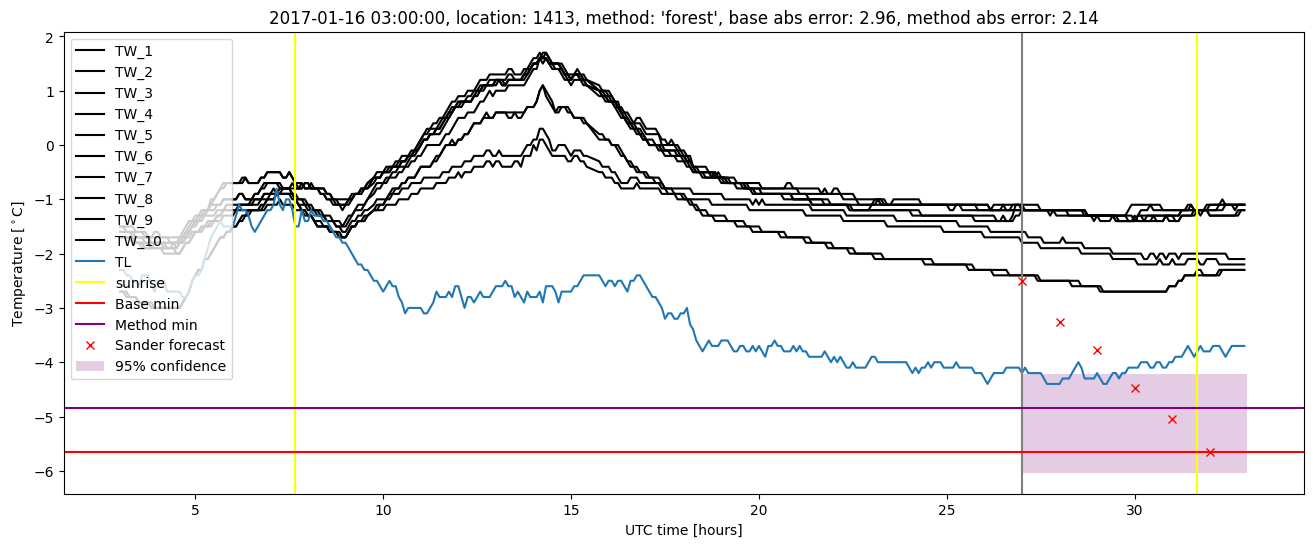
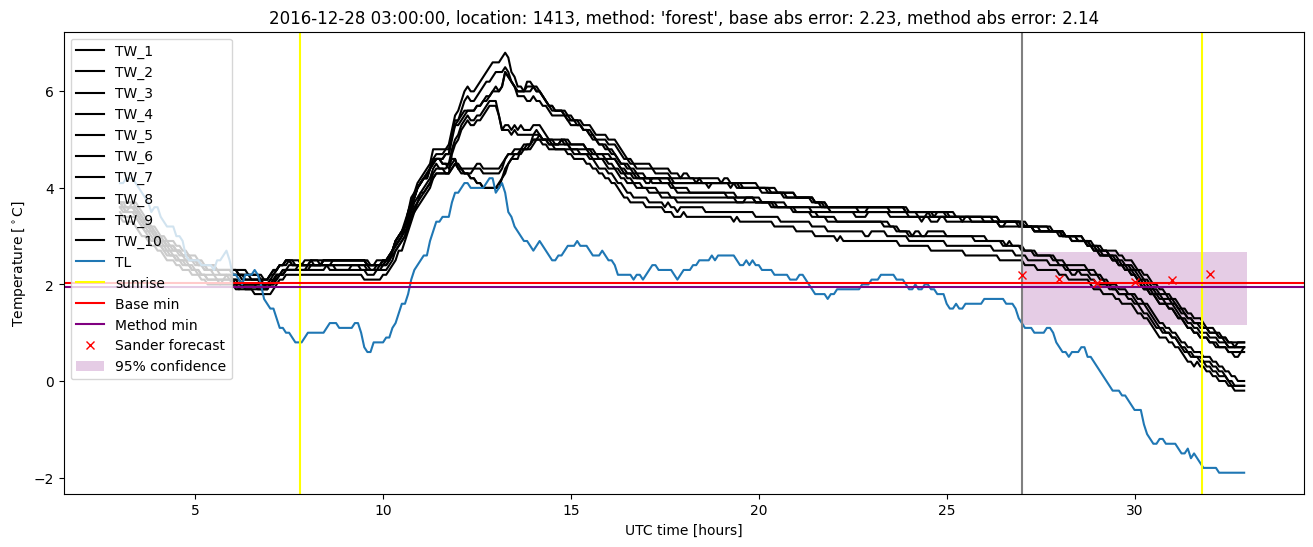
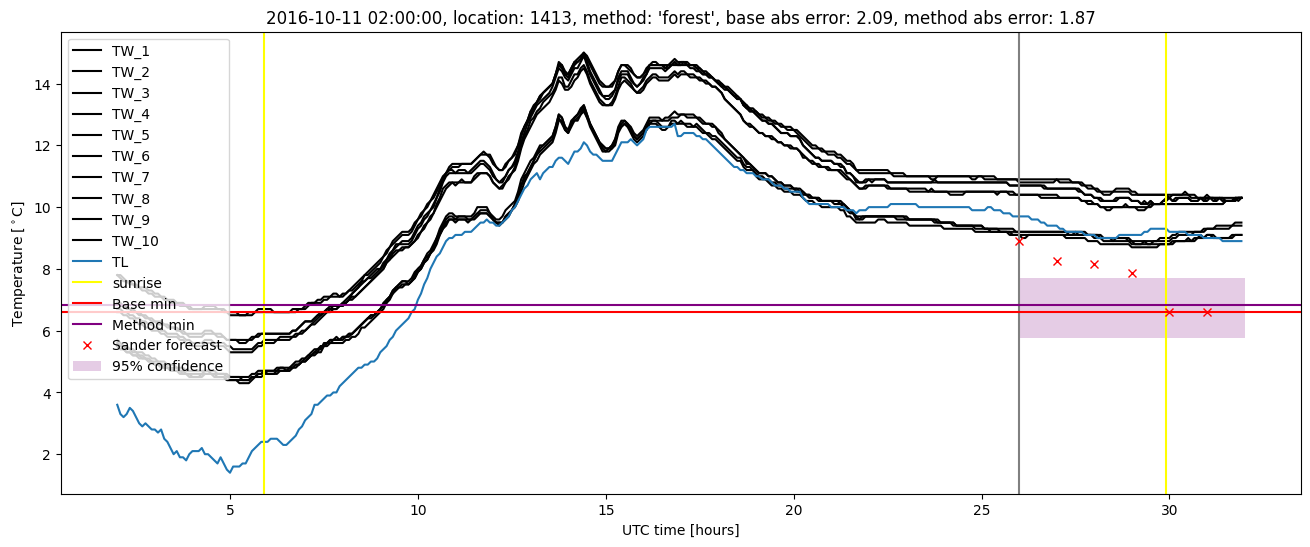
Random forest results
| names |
period |
power |
significance |
meanSquareError |
absError |
maxError |
CRPS |
IGN |
| baseline |
winter 2016 |
0.994 |
0.129 |
0.346 |
0.437 |
1.768 |
NaN |
NaN |
| forest |
winter 2016 |
0.988 |
0.065 |
0.266 |
0.391 |
1.603 |
0.453 |
2.594 |
| baseline |
winter 2017 |
0.981 |
0.067 |
0.501 |
0.499 |
2.958 |
NaN |
NaN |
| forest |
winter 2017 |
0.981 |
0.067 |
0.388 |
0.430 |
2.144 |
0.460 |
3.865 |
| baseline |
winter 2018 |
0.979 |
0.098 |
0.390 |
0.439 |
3.047 |
NaN |
NaN |
| forest |
winter 2018 |
0.979 |
0.098 |
0.328 |
0.391 |
3.070 |
0.471 |
3.273 |
| baseline |
winter 2019 |
1.000 |
0.000e+00 |
0.287 |
0.405 |
2.055 |
NaN |
NaN |
| forest |
winter 2019 |
1.000 |
0.133 |
0.244 |
0.367 |
1.454 |
0.452 |
2.550 |
| baseline |
all |
0.989 |
0.083 |
0.378 |
0.444 |
3.047 |
NaN |
NaN |
| forest |
all |
0.988 |
0.083 |
0.304 |
0.394 |
3.070 |
0.459 |
3.041 |
Random forest plots
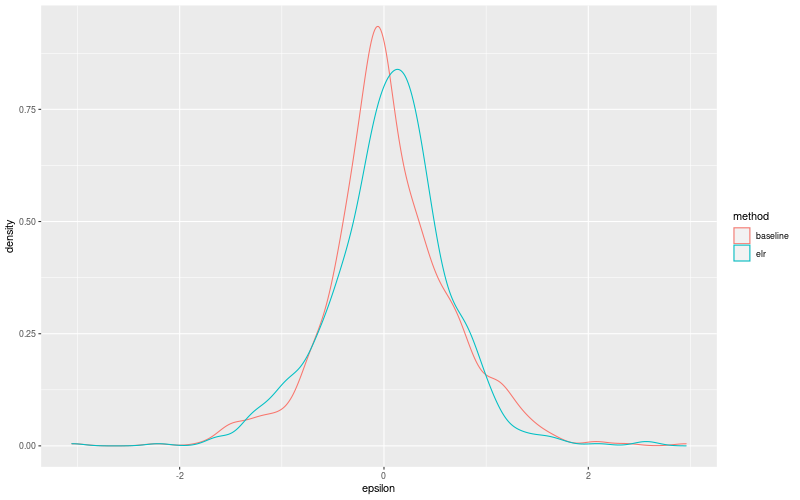
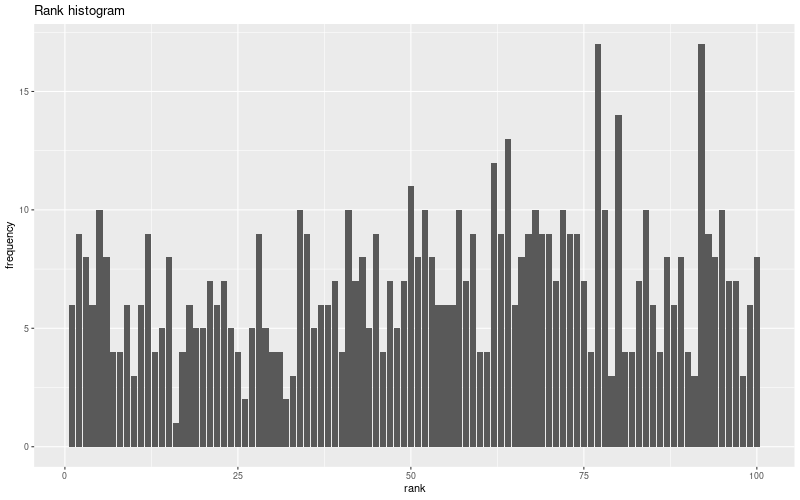
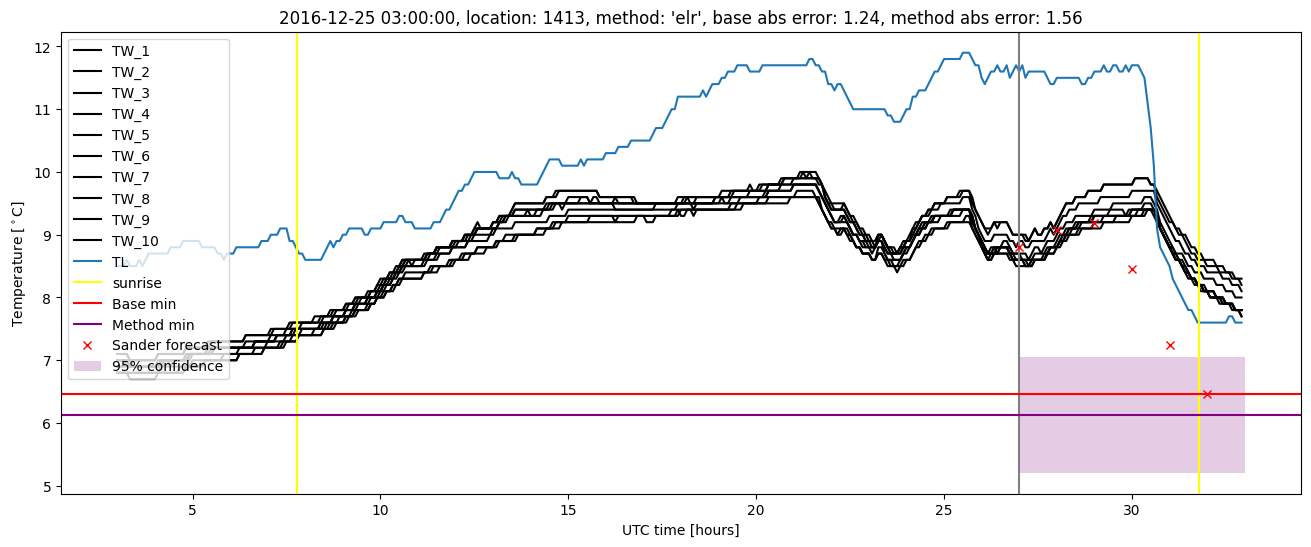
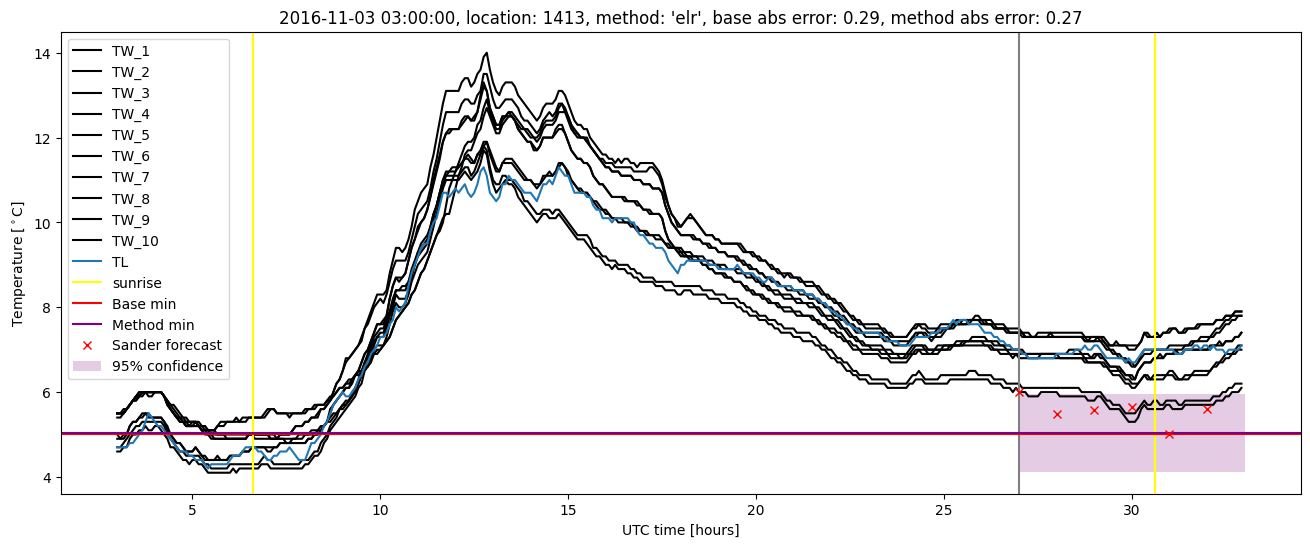
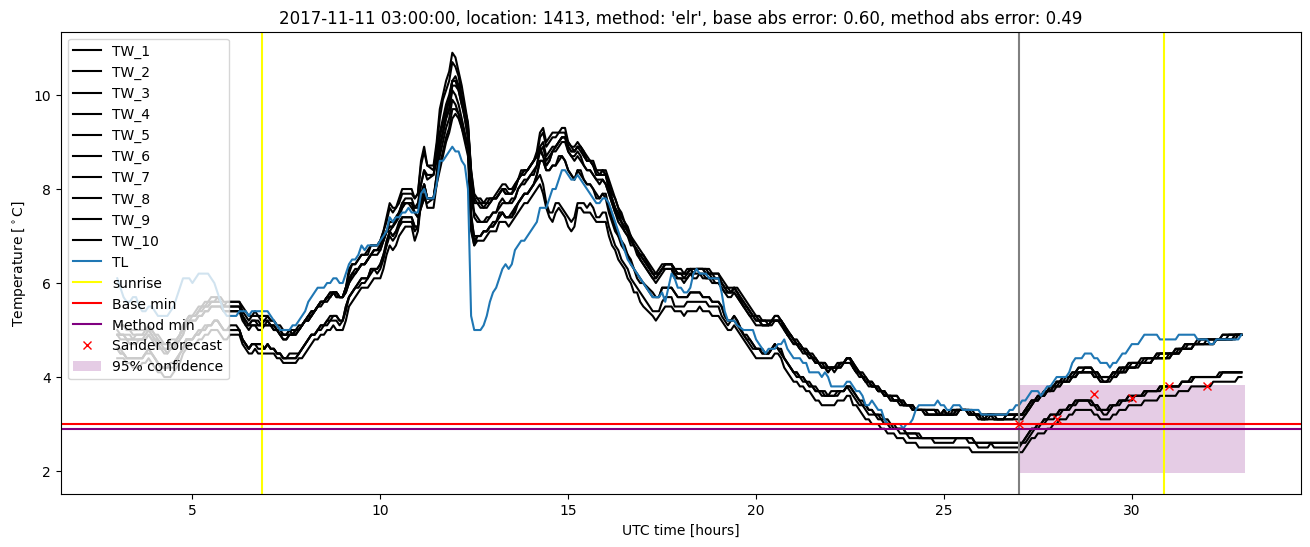
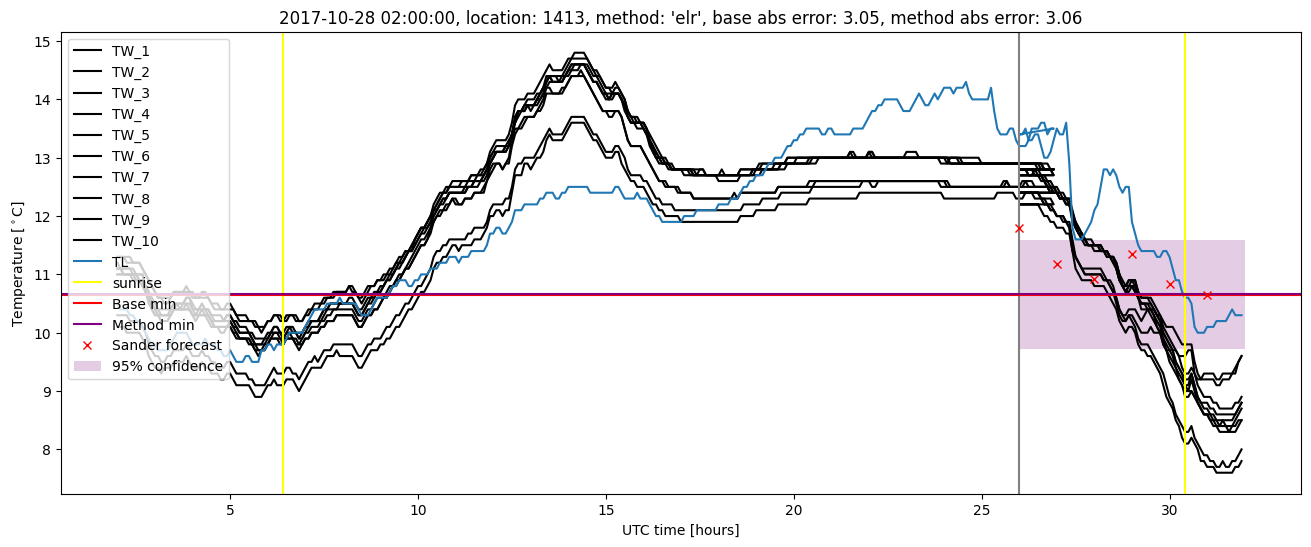
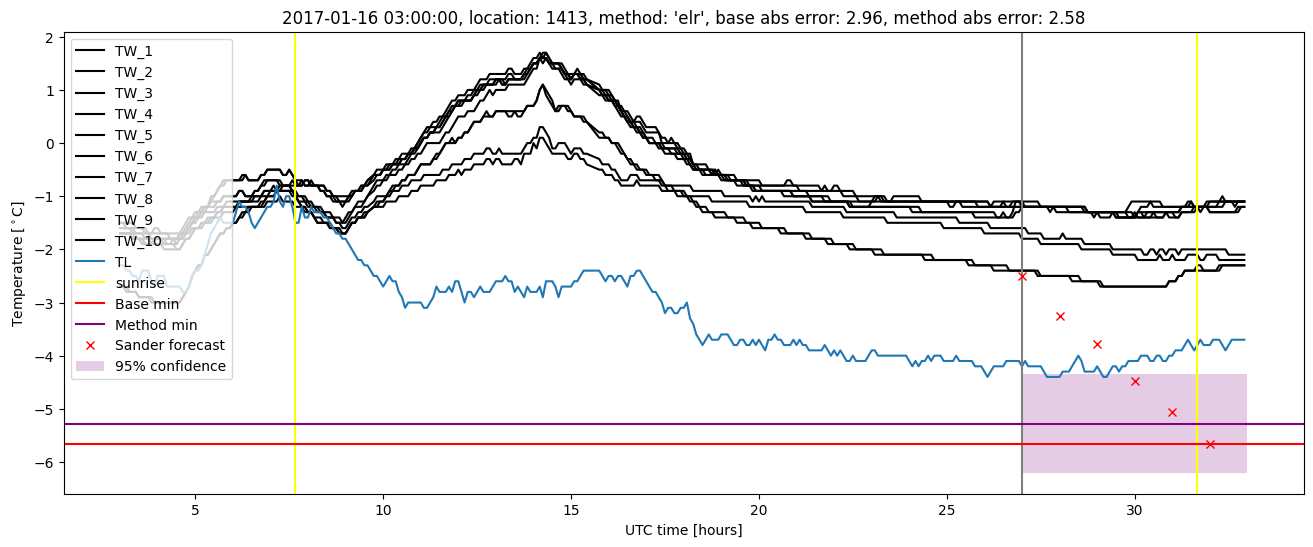
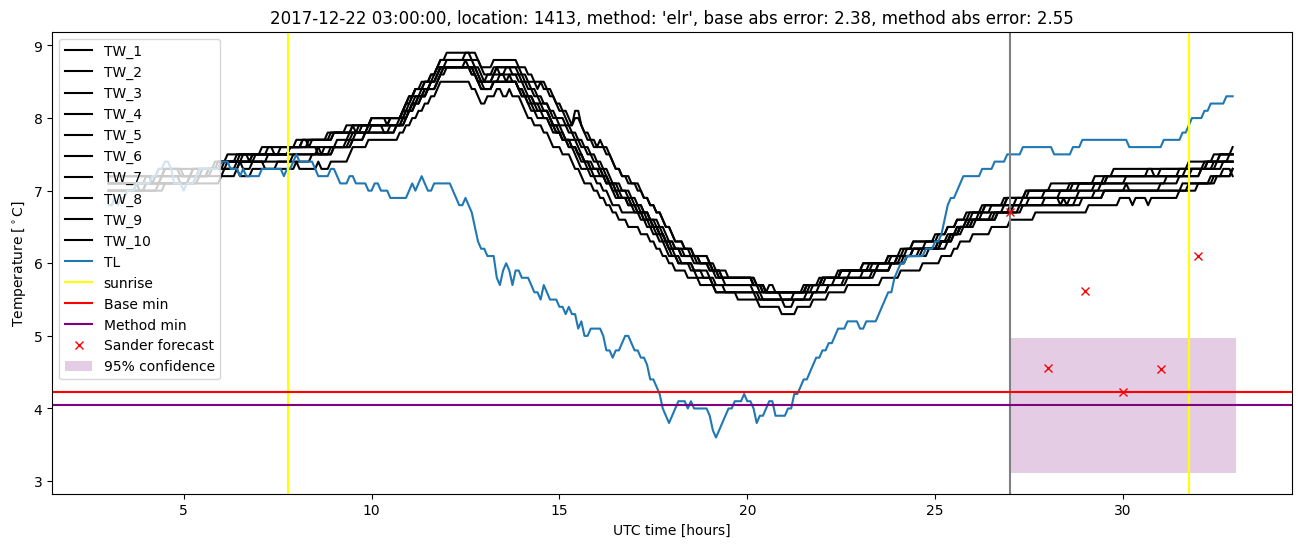
Extended logistic regression results
| names |
period |
power |
significance |
meanSquareError |
absError |
maxError |
CRPS |
IGN |
| baseline |
winter 2016 |
0.994 |
0.129 |
0.346 |
0.437 |
1.768 |
NaN |
NaN |
| elr |
winter 2016 |
0.988 |
0.097 |
0.318 |
0.462 |
1.490 |
0.550 |
3.392 |
| baseline |
winter 2017 |
0.981 |
0.067 |
0.501 |
0.499 |
2.958 |
NaN |
NaN |
| elr |
winter 2017 |
0.991 |
0.089 |
0.433 |
0.458 |
2.582 |
0.475 |
2.877 |
| baseline |
winter 2018 |
0.979 |
0.098 |
0.390 |
0.439 |
3.047 |
NaN |
NaN |
| elr |
winter 2018 |
0.979 |
0.098 |
0.342 |
0.415 |
3.055 |
0.520 |
3.307 |
| baseline |
winter 2019 |
1.000 |
0.000e+00 |
0.287 |
0.405 |
2.055 |
NaN |
NaN |
| elr |
winter 2019 |
1.000 |
0.133 |
0.304 |
0.420 |
1.665 |
0.509 |
2.766 |
| baseline |
all |
0.989 |
0.083 |
0.378 |
0.444 |
3.047 |
NaN |
NaN |
| elr |
all |
0.989 |
0.099 |
0.346 |
0.439 |
3.055 |
0.517 |
3.116 |
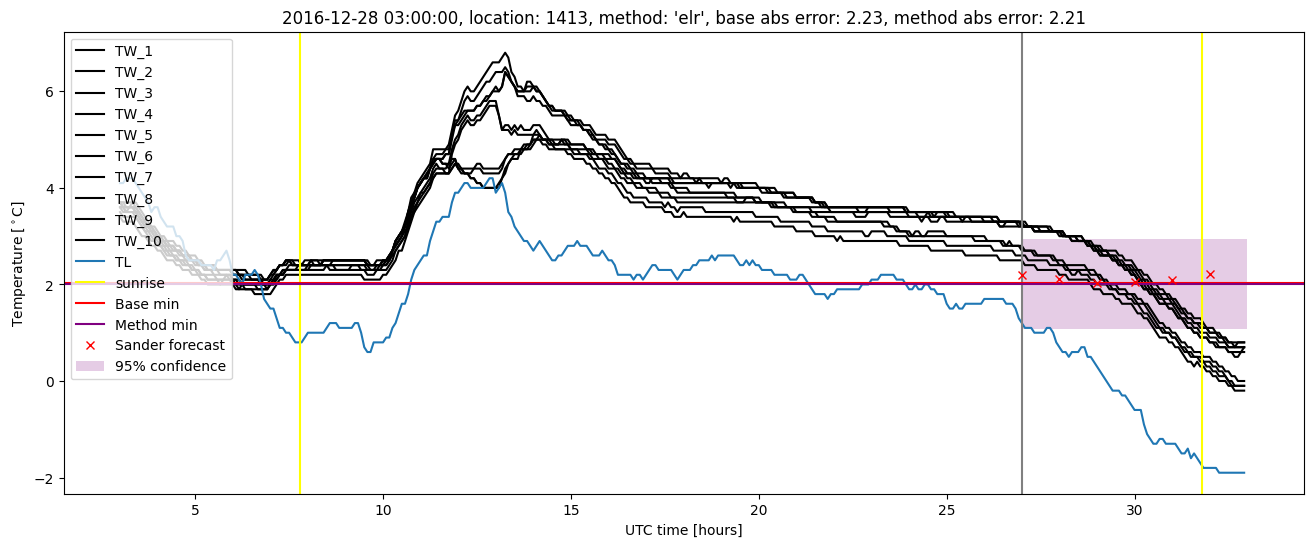
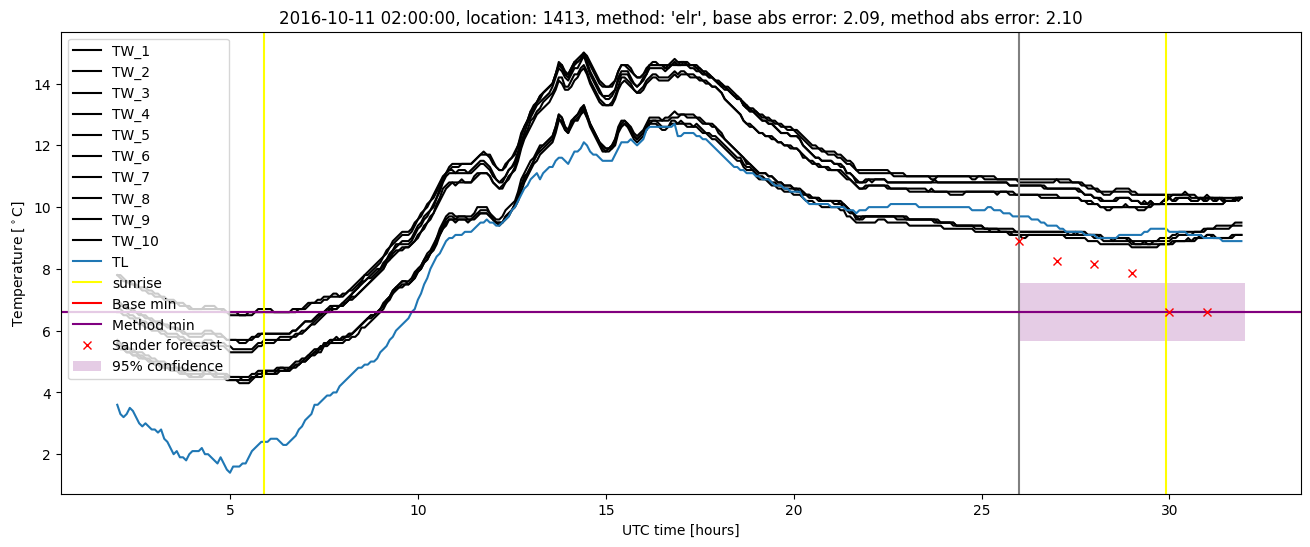
Extended logistic regression plots