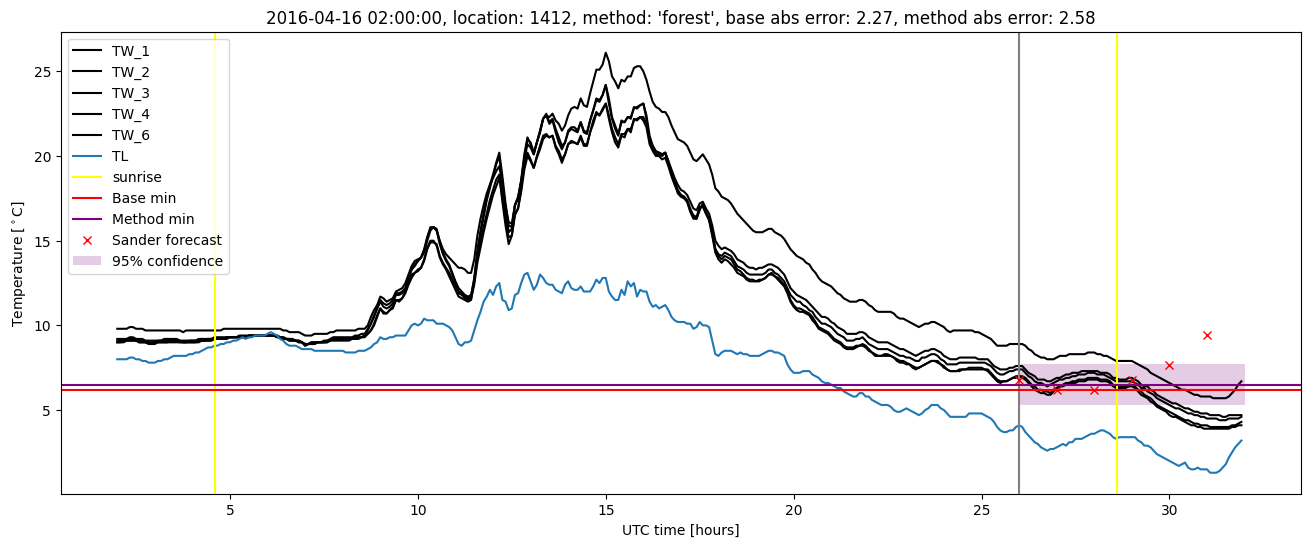
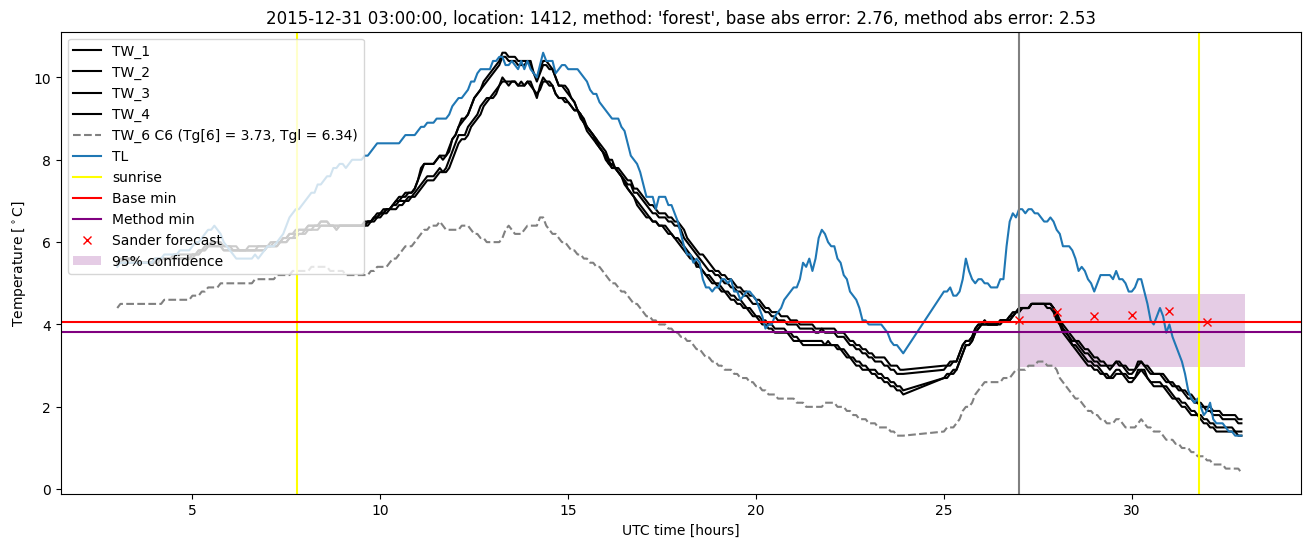
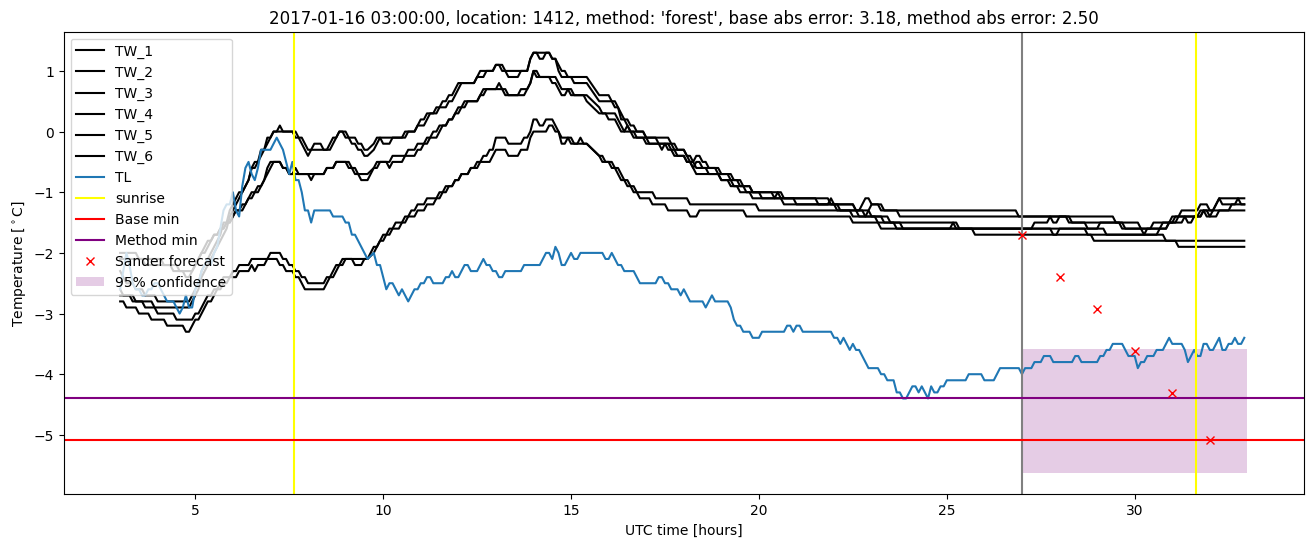
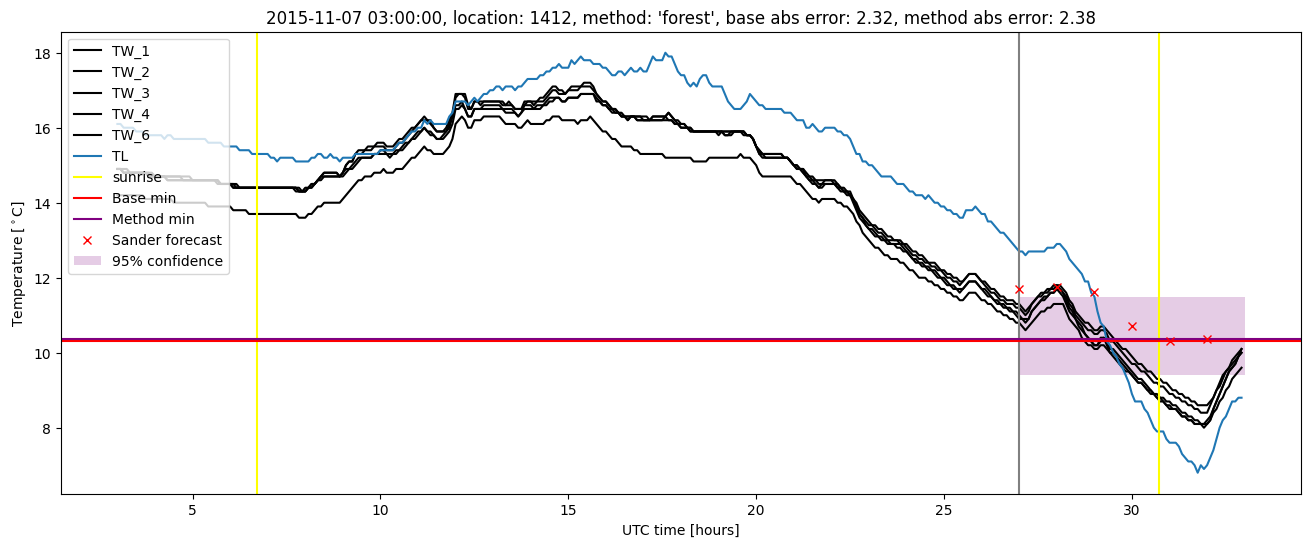
GMS location: 1412
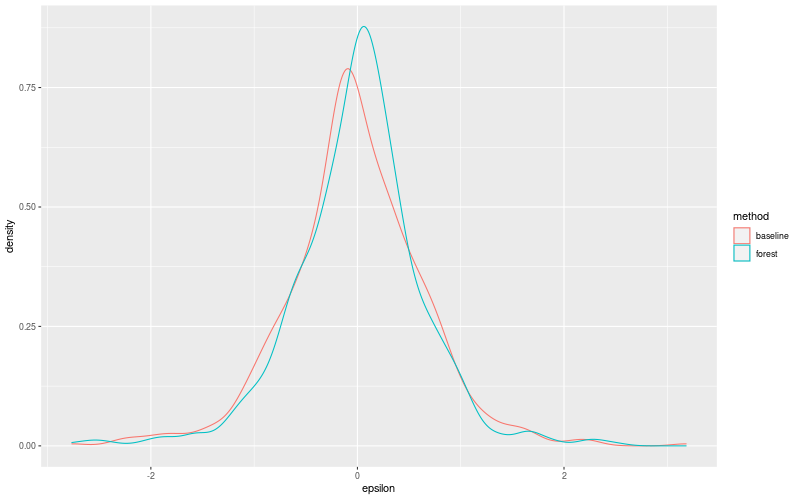
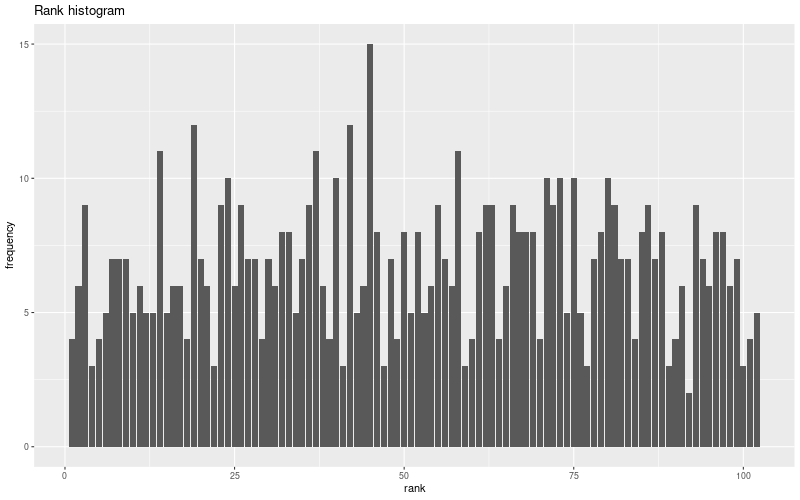
Random forest results
| names |
period |
power |
significance |
meanSquareError |
absError |
maxError |
CRPS |
IGN |
| baseline |
winter 2016 |
0.994 |
0.132 |
0.452 |
0.485 |
2.765 |
NaN |
NaN |
| forest |
winter 2016 |
0.994 |
0.105 |
0.412 |
0.436 |
2.765 |
0.470 |
2.096 |
| baseline |
winter 2017 |
0.971 |
0.062 |
0.555 |
0.536 |
3.182 |
NaN |
NaN |
| forest |
winter 2017 |
0.981 |
0.042 |
0.497 |
0.504 |
2.497 |
0.480 |
2.099 |
| baseline |
winter 2018 |
0.993 |
0.048 |
0.397 |
0.489 |
2.145 |
NaN |
NaN |
| forest |
winter 2018 |
0.977 |
0.000e+00 |
0.328 |
0.440 |
1.906 |
0.486 |
1.916 |
| baseline |
winter 2019 |
0.979 |
0.071 |
0.381 |
0.459 |
2.177 |
NaN |
NaN |
| forest |
winter 2019 |
0.986 |
0.286 |
0.337 |
0.432 |
2.287 |
0.481 |
1.909 |
| baseline |
all |
0.985 |
0.077 |
0.445 |
0.492 |
3.182 |
NaN |
NaN |
| forest |
all |
0.985 |
0.070 |
0.393 |
0.451 |
2.765 |
0.479 |
2.009 |
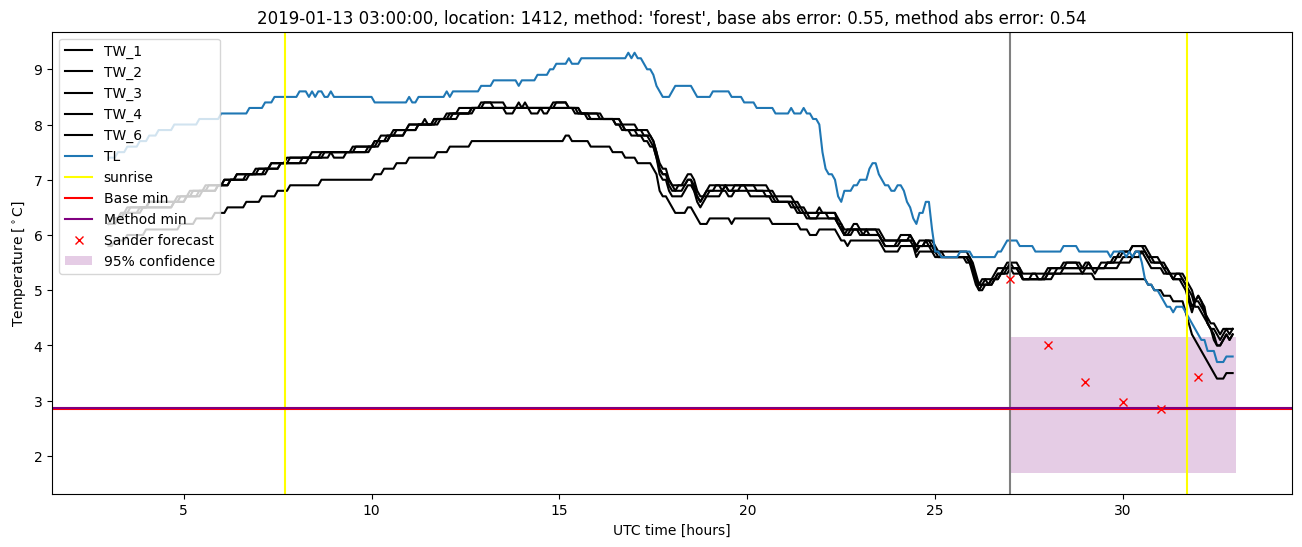
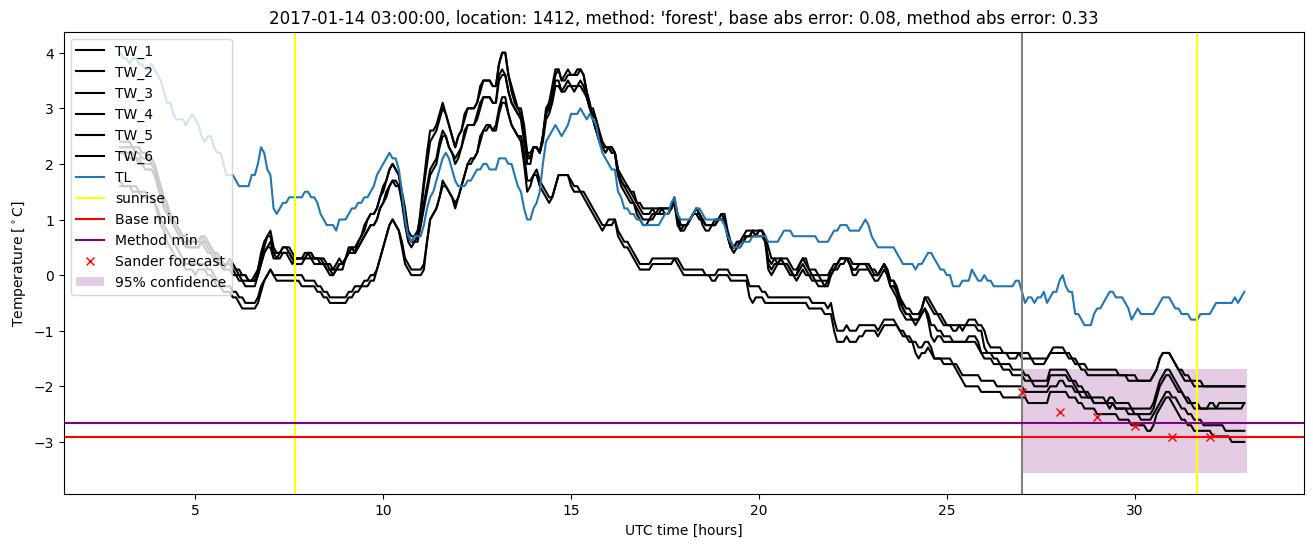
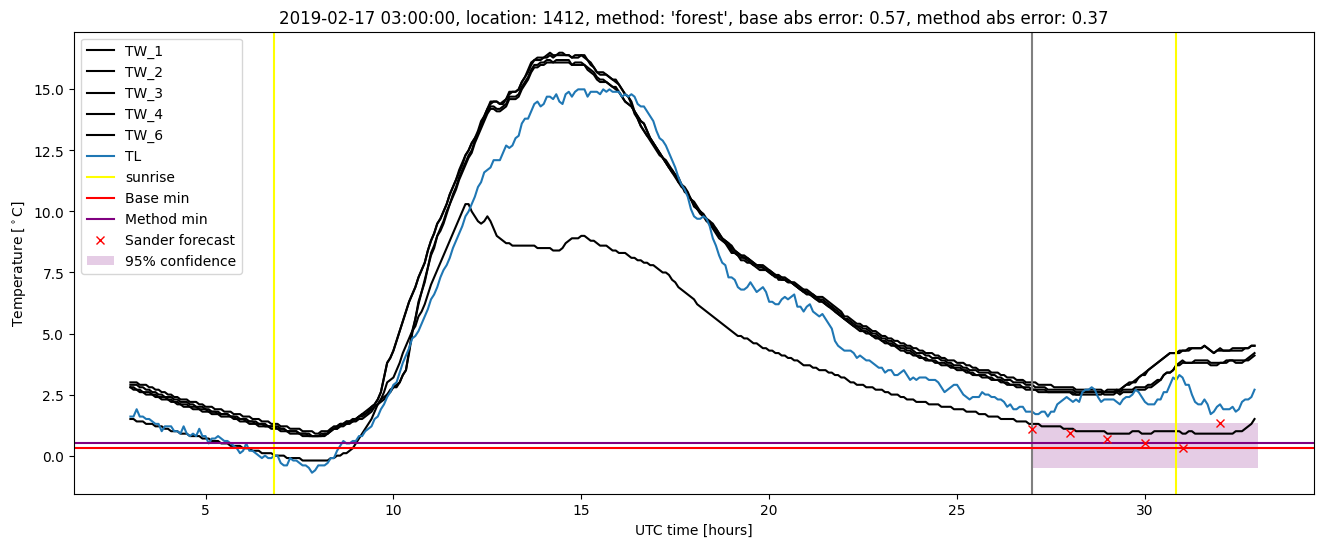
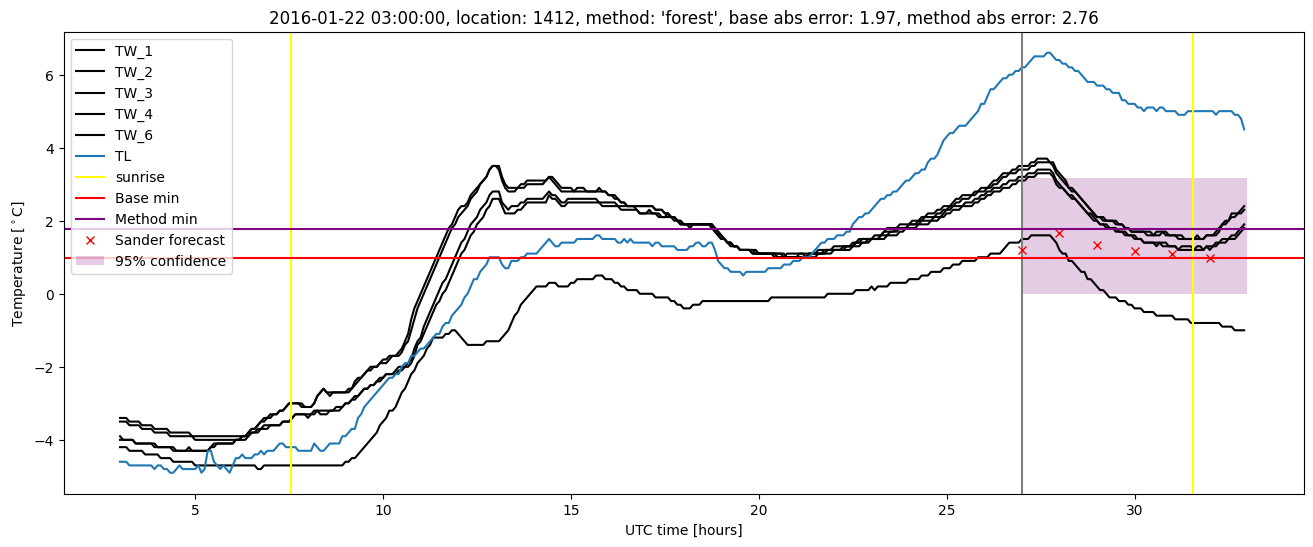
Random forest plots
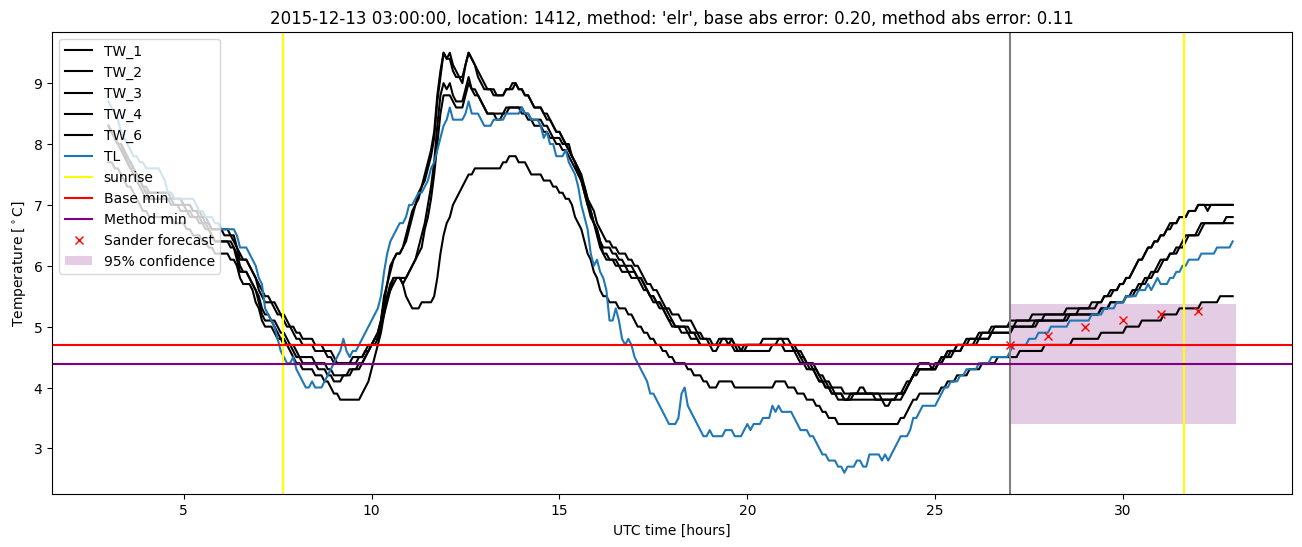
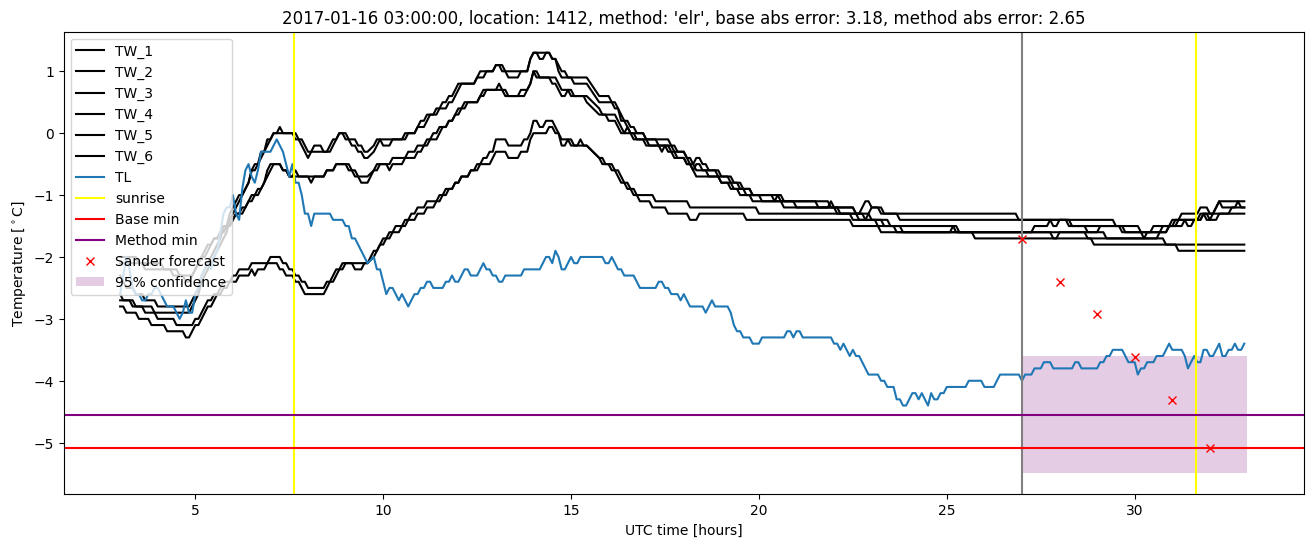
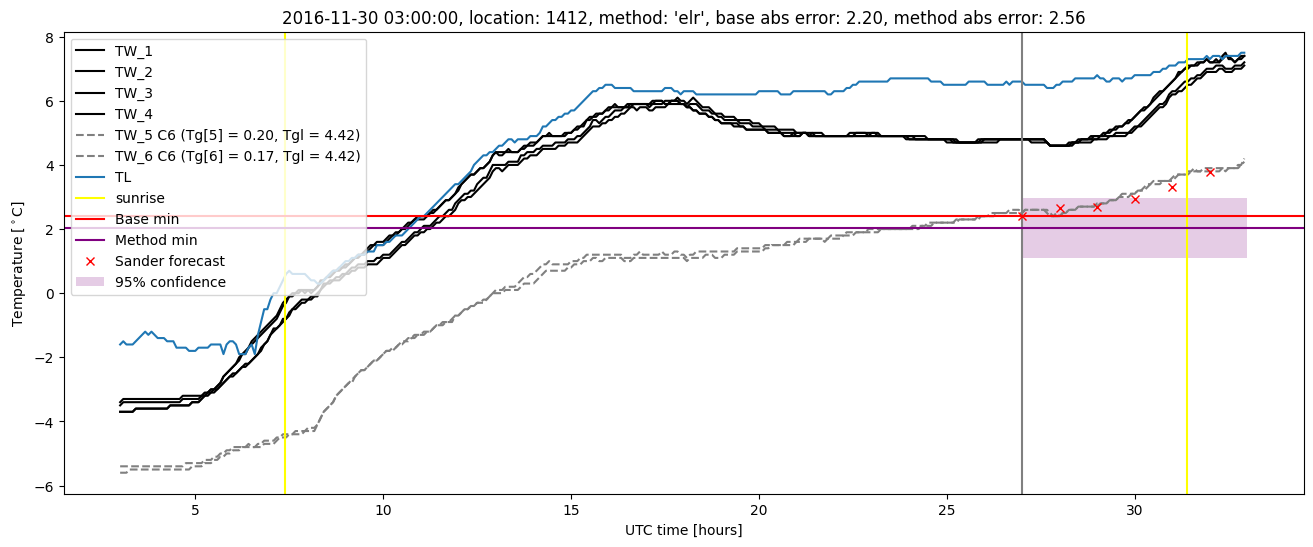
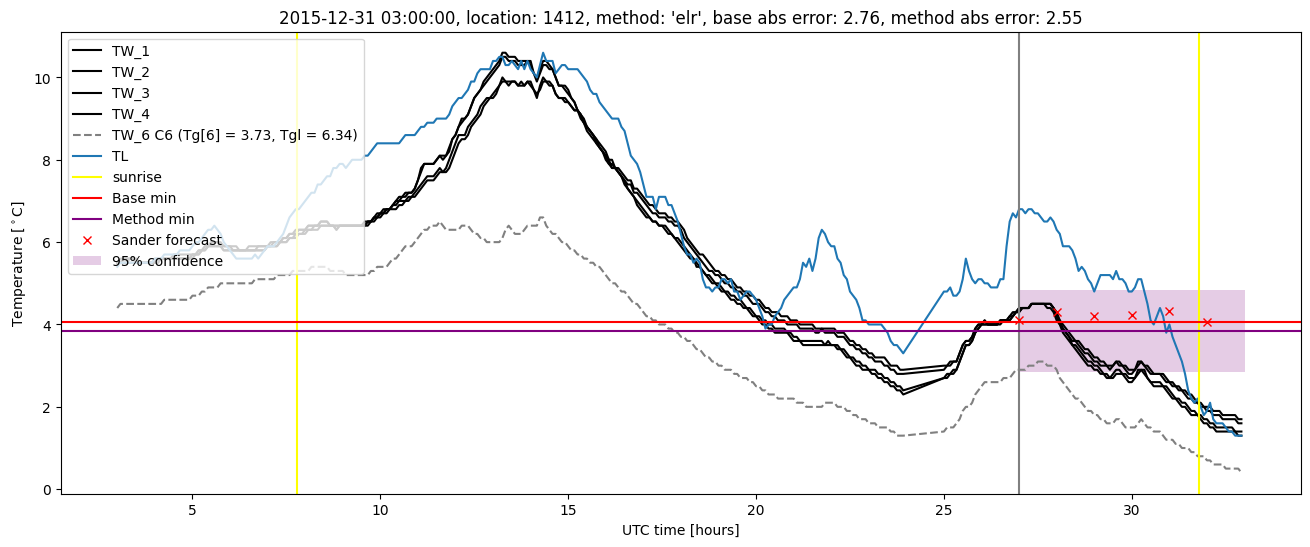
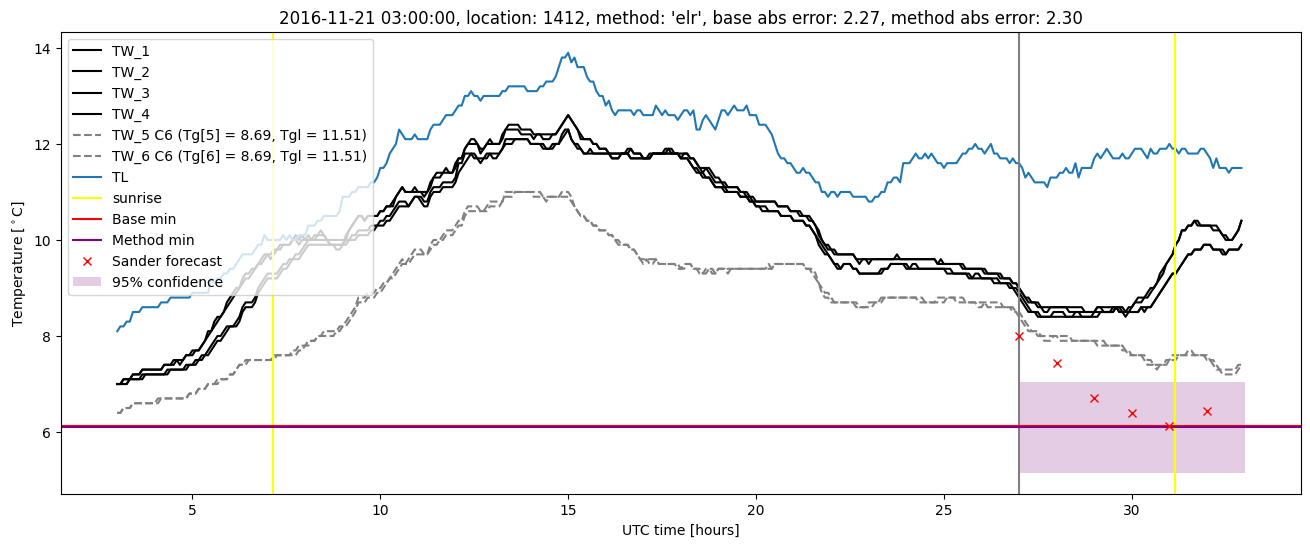
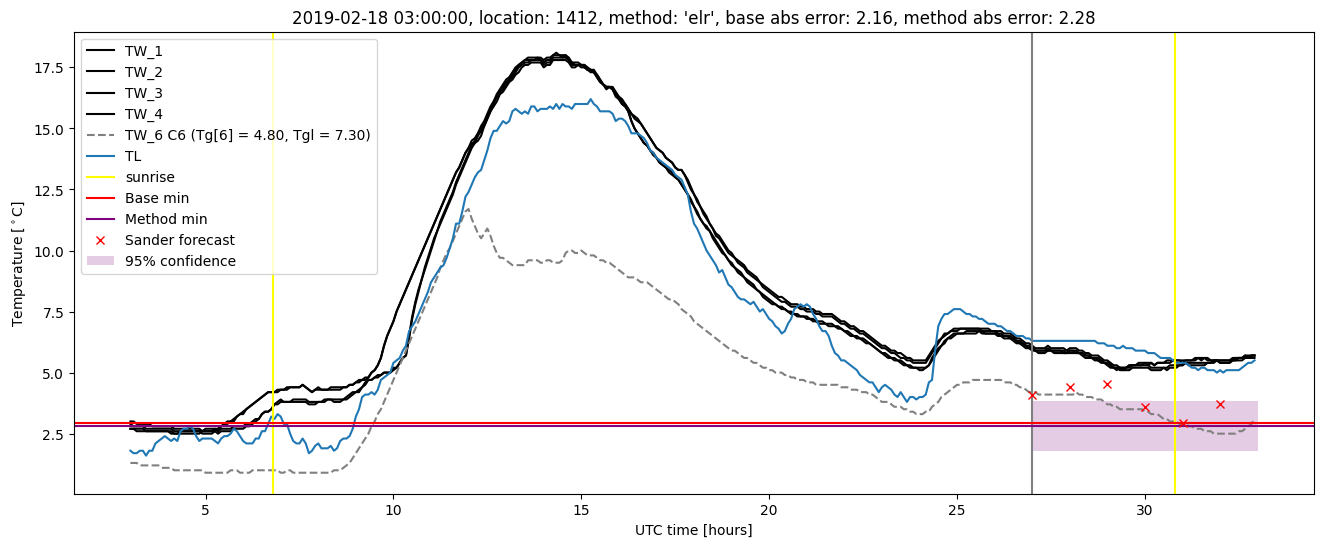
Extended logistic regression results
| names |
period |
power |
significance |
meanSquareError |
absError |
maxError |
CRPS |
IGN |
| baseline |
winter 2016 |
0.994 |
0.132 |
0.452 |
0.485 |
2.765 |
NaN |
NaN |
| elr |
winter 2016 |
0.994 |
0.105 |
0.401 |
0.452 |
2.546 |
0.530 |
2.802 |
| baseline |
winter 2017 |
0.971 |
0.062 |
0.555 |
0.536 |
3.182 |
NaN |
NaN |
| elr |
winter 2017 |
0.991 |
0.062 |
0.521 |
0.525 |
2.645 |
0.520 |
3.162 |
| baseline |
winter 2018 |
0.993 |
0.048 |
0.397 |
0.489 |
2.145 |
NaN |
NaN |
| elr |
winter 2018 |
0.962 |
0.000e+00 |
0.390 |
0.478 |
2.031 |
0.530 |
2.614 |
| baseline |
winter 2019 |
0.979 |
0.071 |
0.381 |
0.459 |
2.177 |
NaN |
NaN |
| elr |
winter 2019 |
0.986 |
0.286 |
0.371 |
0.473 |
2.278 |
0.513 |
2.508 |
| baseline |
all |
0.985 |
0.077 |
0.445 |
0.492 |
3.182 |
NaN |
NaN |
| elr |
all |
0.984 |
0.077 |
0.418 |
0.480 |
2.645 |
0.524 |
2.768 |
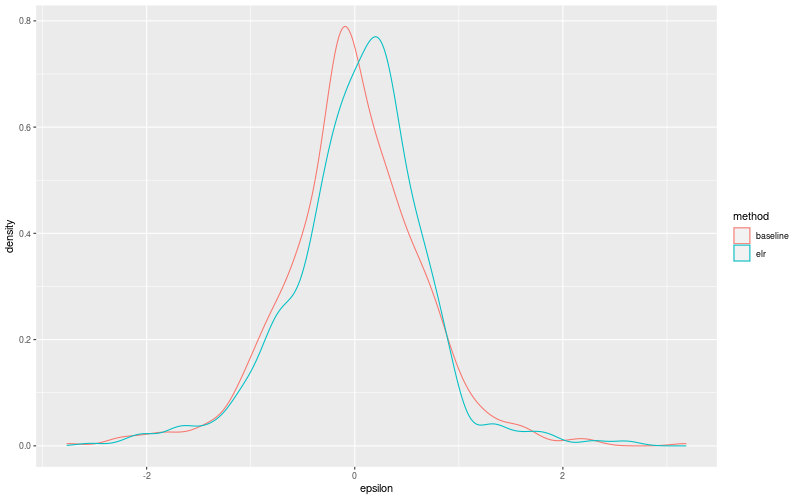
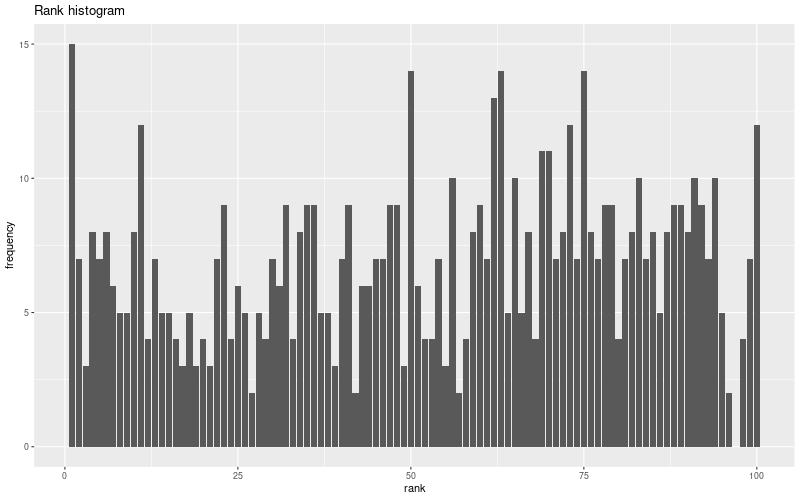
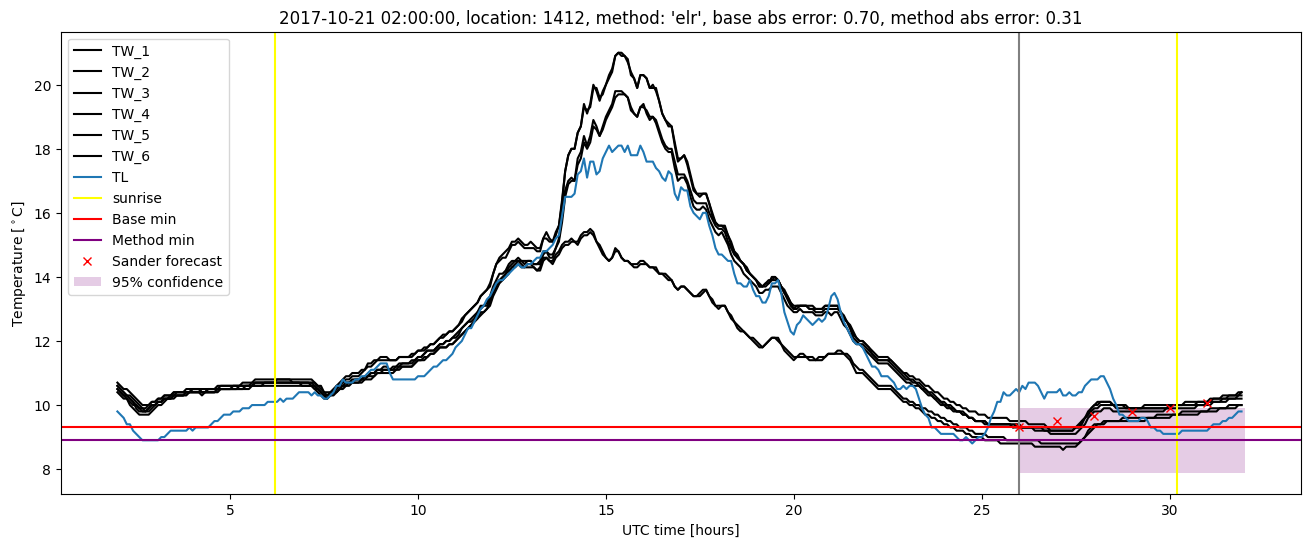
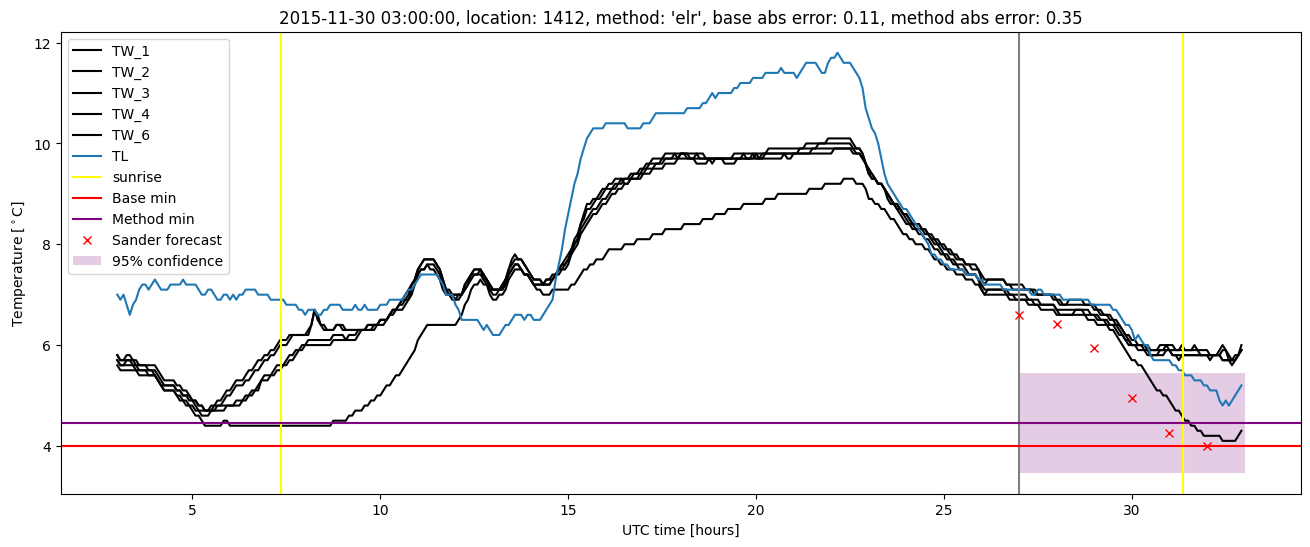
Extended logistic regression plots