GMS location: 1411
Random forest results
| names |
period |
power |
significance |
meanSquareError |
absError |
maxError |
CRPS |
IGN |
| baseline |
winter 2016 |
1.000 |
0.088 |
0.371 |
0.459 |
2.481 |
NaN |
NaN |
| forest |
winter 2016 |
1.000 |
0.059 |
0.316 |
0.414 |
2.389 |
0.495 |
4.792 |
| baseline |
winter 2017 |
0.983 |
0.053 |
0.485 |
0.498 |
3.291 |
NaN |
NaN |
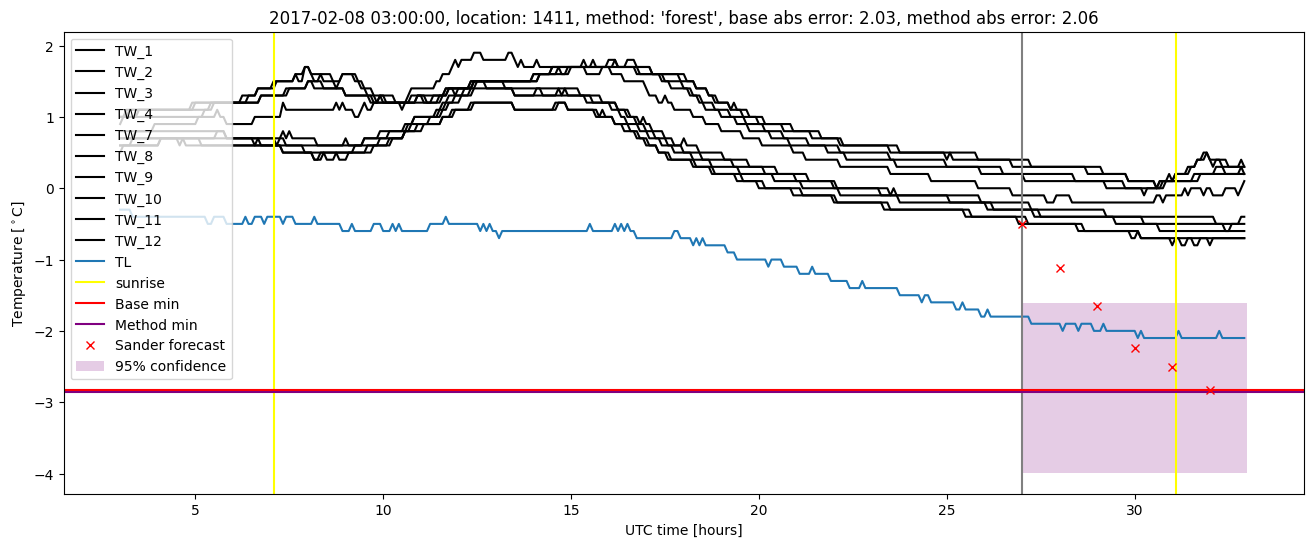
| forest |
winter 2017 |
0.983 |
0.026 |
0.417 |
0.451 |
2.705 |
0.493 |
4.314 |
| baseline |
winter 2018 |
0.979 |
0.032 |
0.326 |
0.436 |
1.851 |
NaN |
NaN |
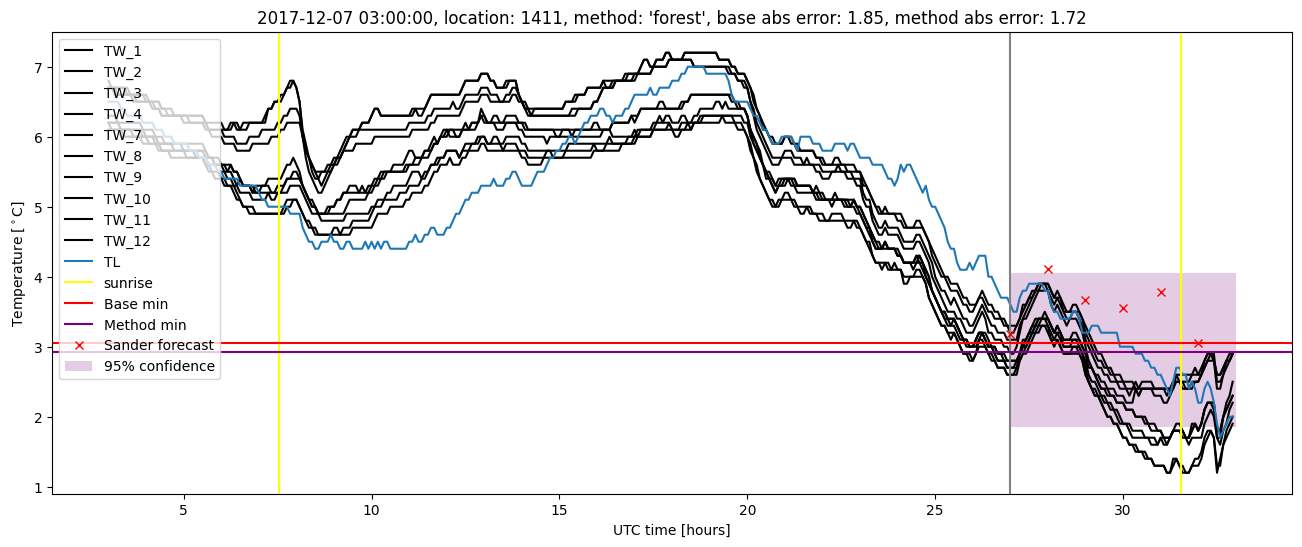
| forest |
winter 2018 |
0.979 |
0.032 |
0.284 |
0.415 |
1.724 |
0.493 |
3.405 |
| baseline |
winter 2019 |
0.977 |
0.176 |
0.234 |
0.371 |
1.356 |
NaN |
NaN |
| forest |
winter 2019 |
0.992 |
0.176 |
0.188 |
0.333 |
1.216 |
0.490 |
3.263 |
| baseline |
all |
0.986 |
0.075 |
0.356 |
0.443 |
3.291 |
NaN |
NaN |
| forest |
all |
0.989 |
0.058 |
0.303 |
0.405 |
2.705 |
0.493 |
4.003 |
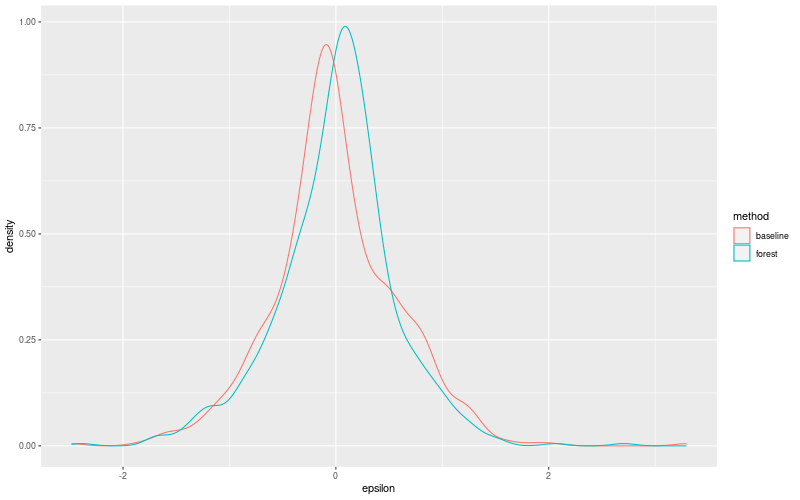
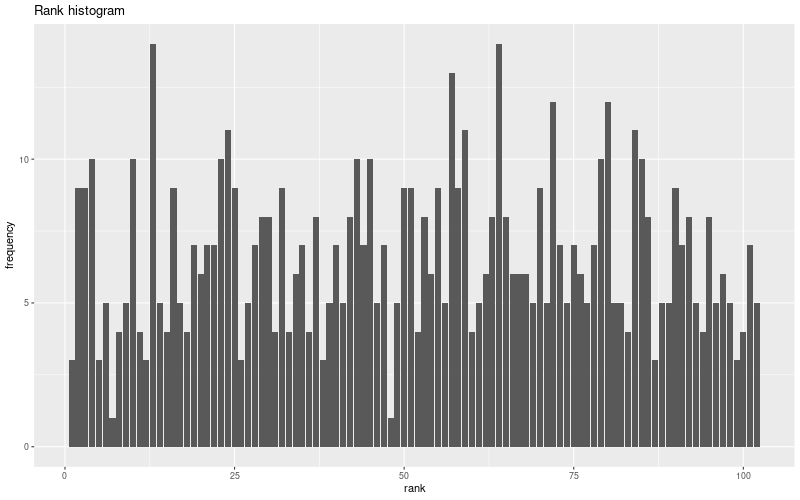
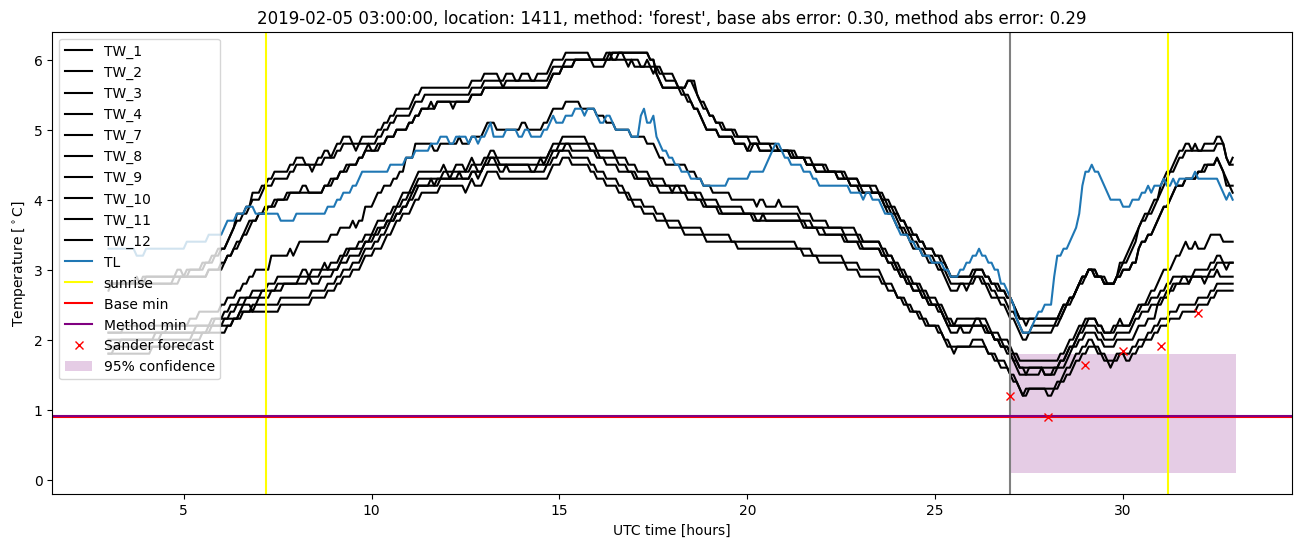
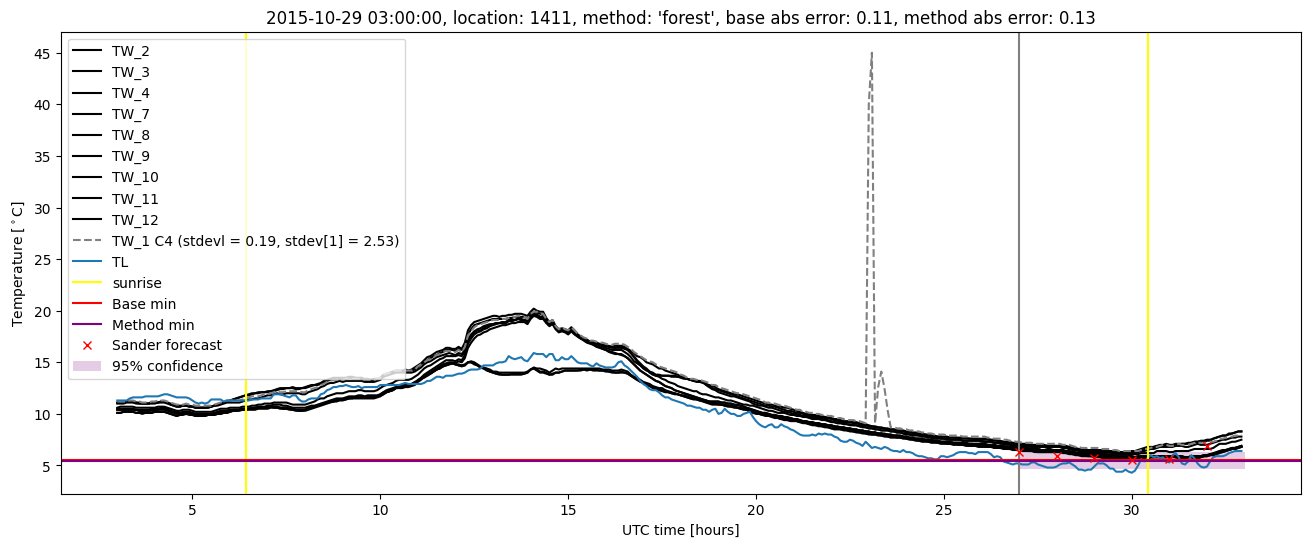
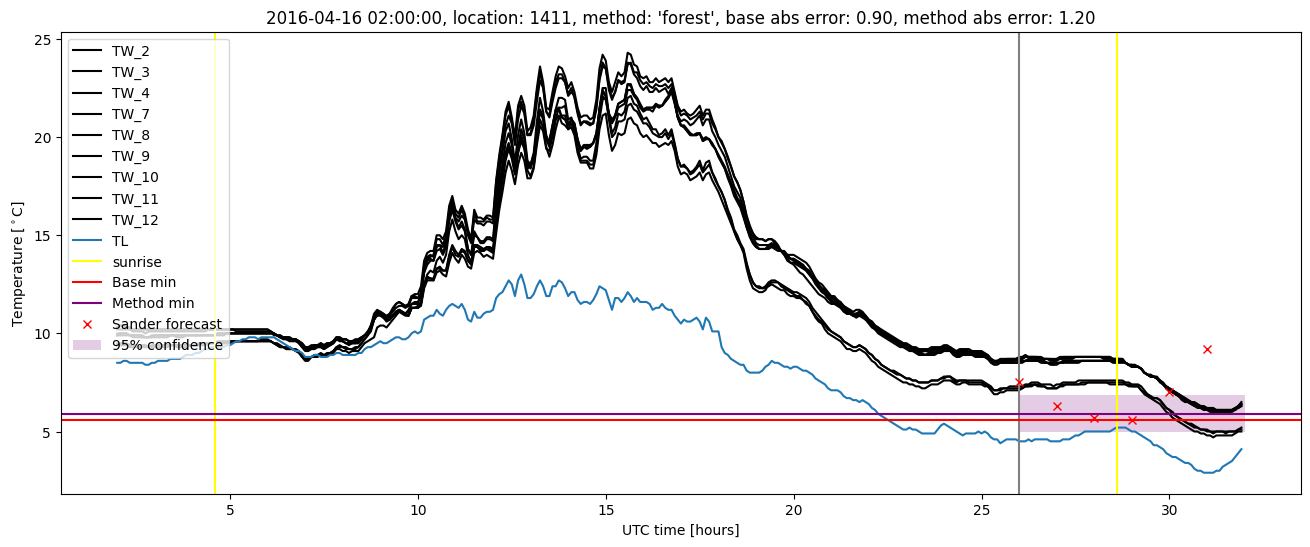
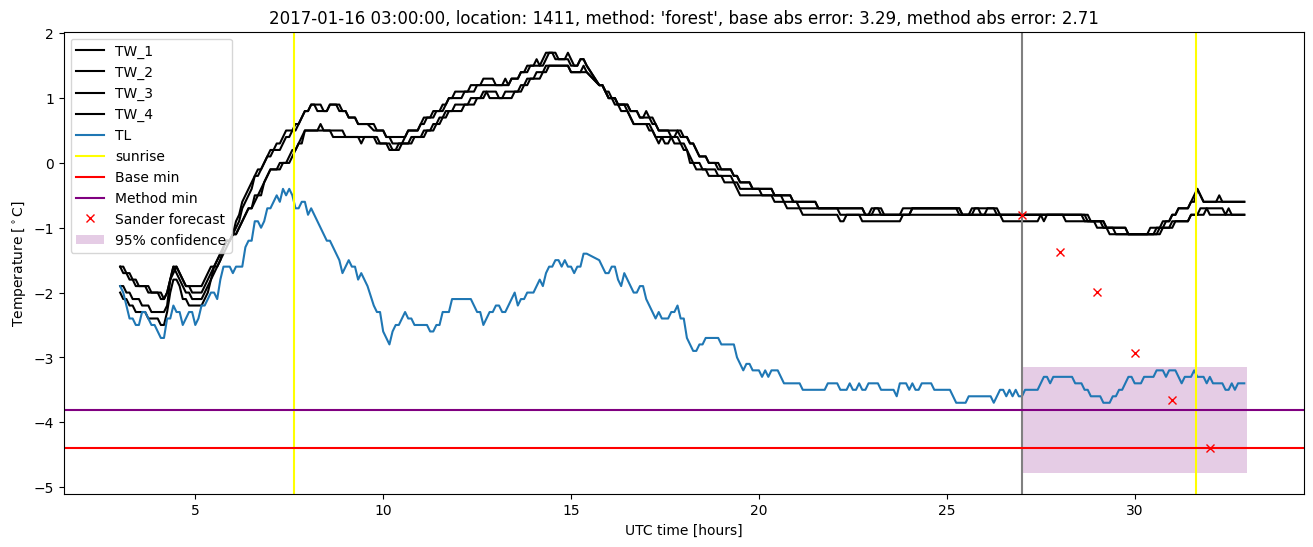
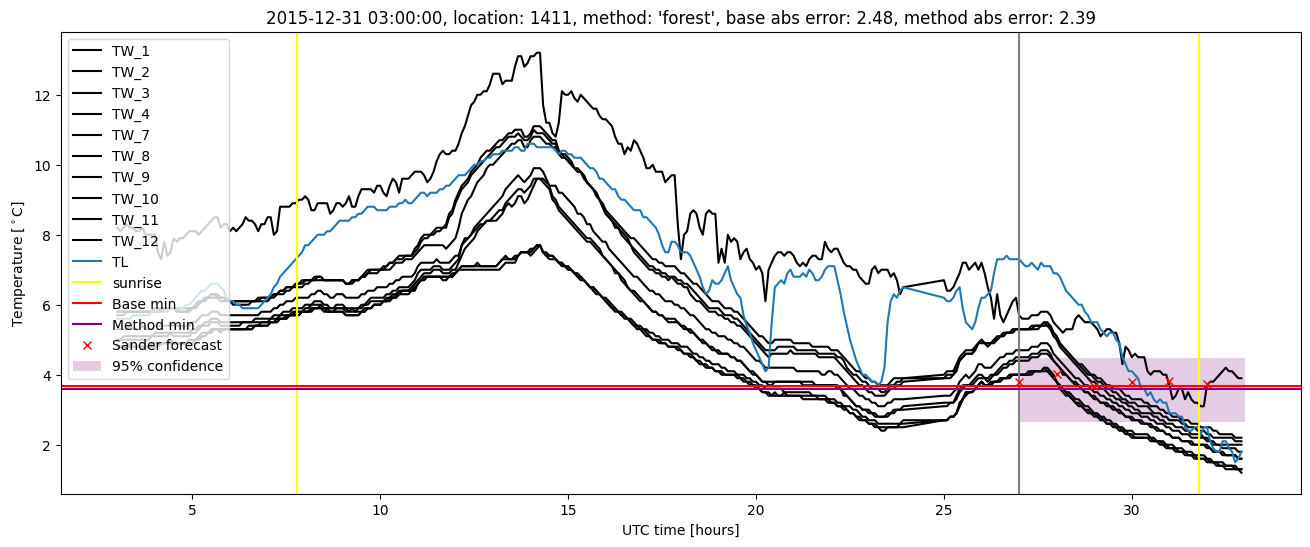
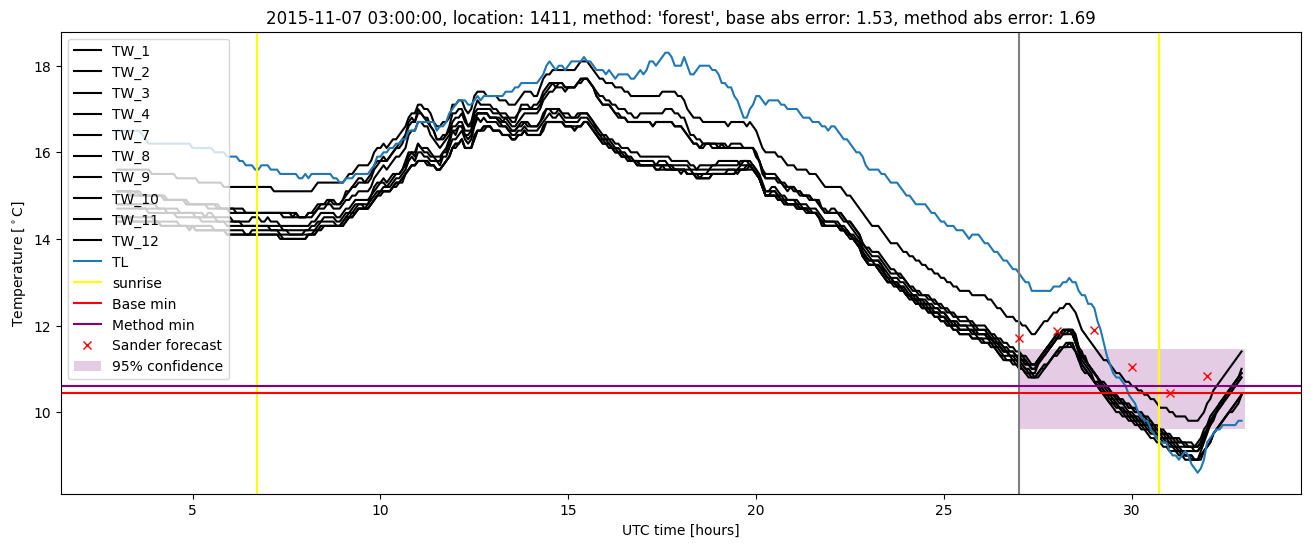
Random forest plots
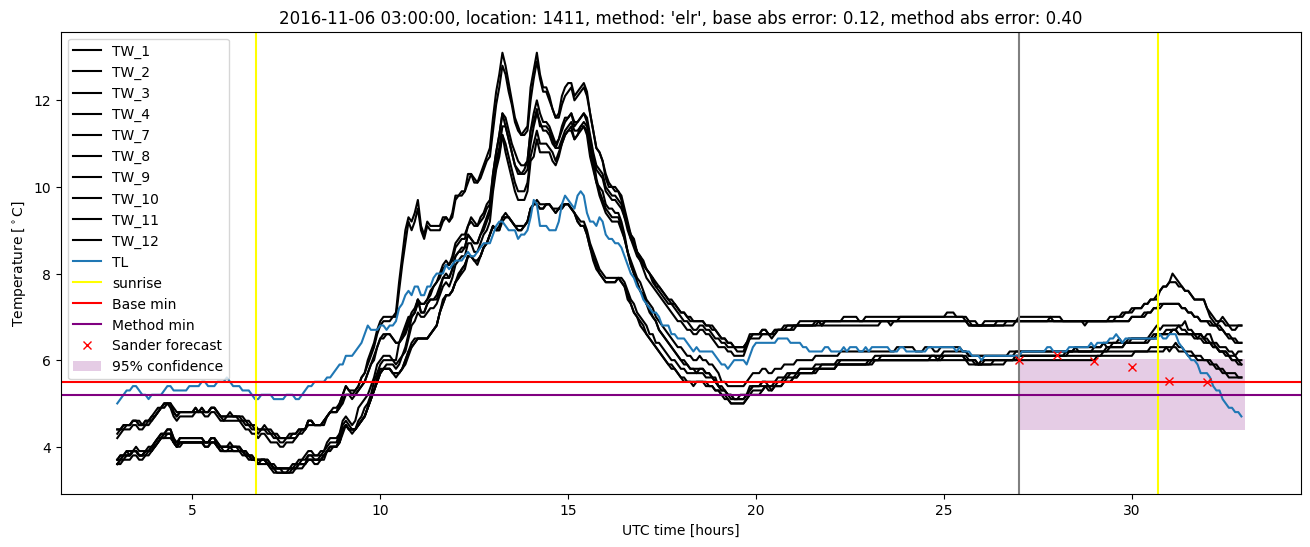
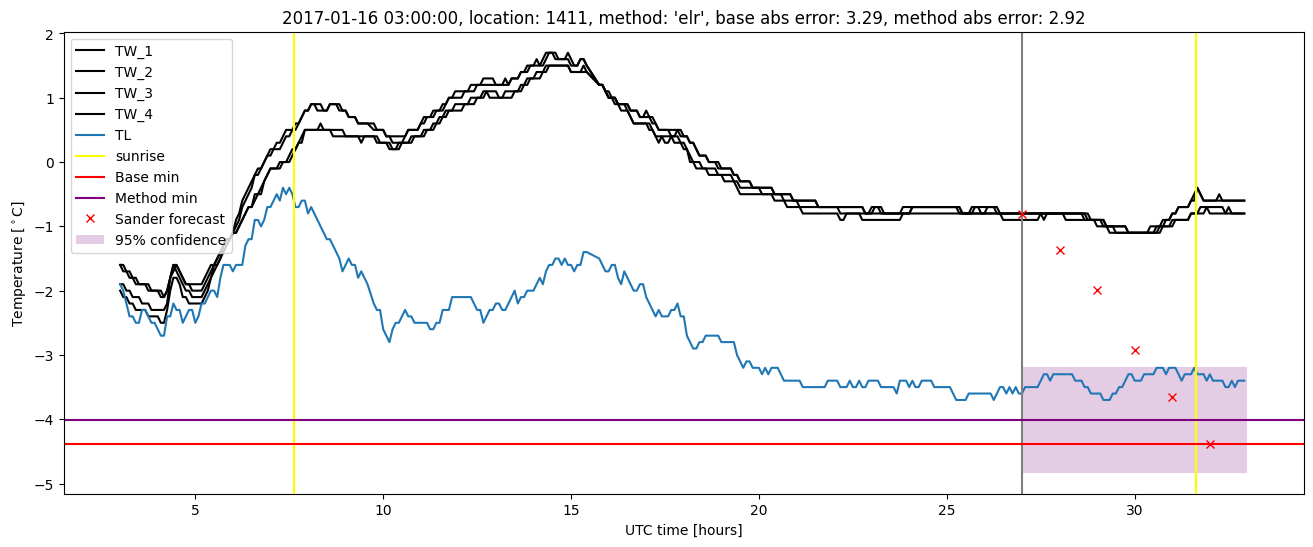
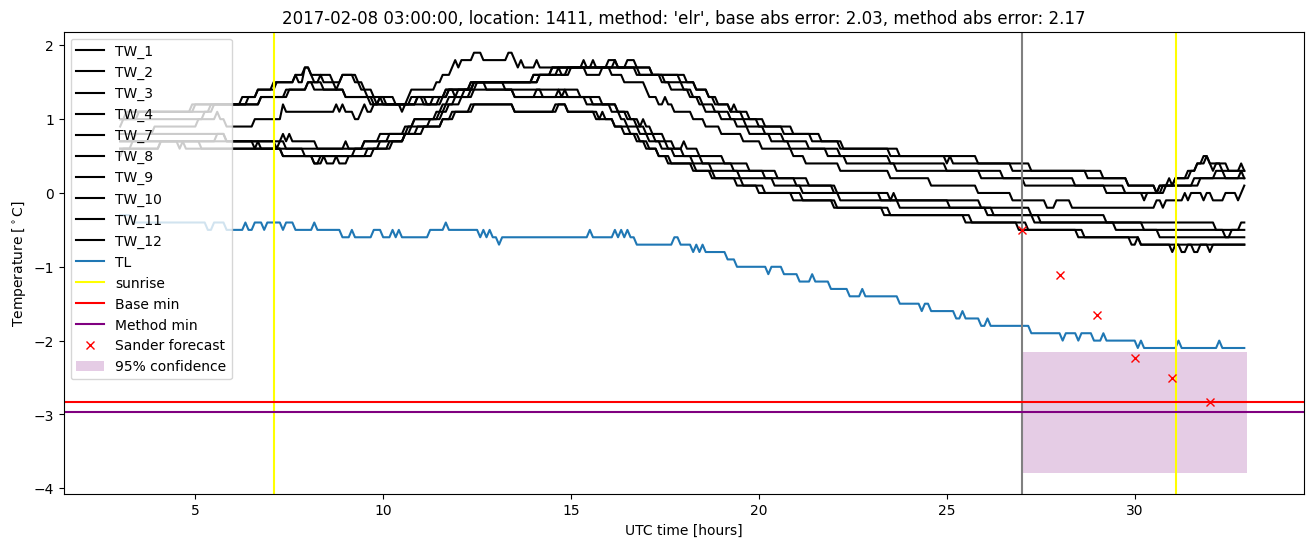
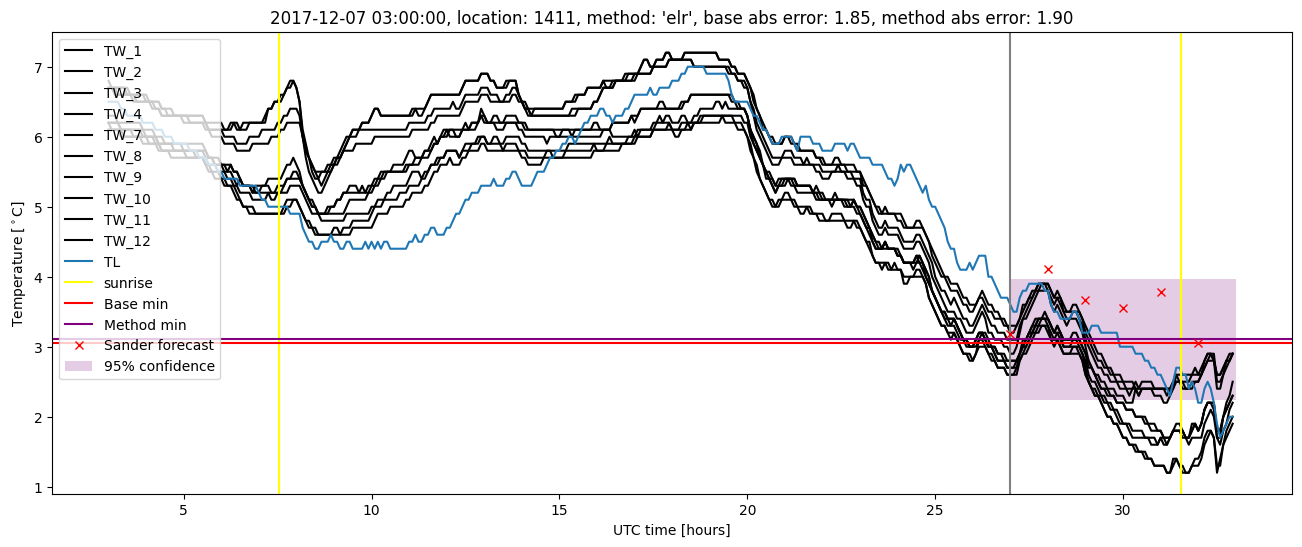
Extended logistic regression results
| names |
period |
power |
significance |
meanSquareError |
absError |
maxError |
CRPS |
IGN |
| baseline |
winter 2016 |
1.000 |
0.088 |
0.371 |
0.459 |
2.481 |
NaN |
NaN |
| elr |
winter 2016 |
0.994 |
0.029 |
0.344 |
0.444 |
2.419 |
0.556 |
4.977 |
| baseline |
winter 2017 |
0.983 |
0.053 |
0.485 |
0.498 |
3.291 |
NaN |
NaN |
| elr |
winter 2017 |
0.983 |
0.053 |
0.433 |
0.474 |
2.915 |
0.532 |
5.359 |
| baseline |
winter 2018 |
0.979 |
0.032 |
0.326 |
0.436 |
1.851 |
NaN |
NaN |
| elr |
winter 2018 |
0.986 |
0.032 |
0.318 |
0.449 |
1.903 |
0.581 |
5.198 |
| baseline |
winter 2019 |
0.977 |
0.176 |
0.234 |
0.371 |
1.356 |
NaN |
NaN |
| elr |
winter 2019 |
0.992 |
0.235 |
0.208 |
0.366 |
1.293 |
0.532 |
3.476 |
| baseline |
all |
0.986 |
0.075 |
0.356 |
0.443 |
3.291 |
NaN |
NaN |
| elr |
all |
0.989 |
0.067 |
0.328 |
0.435 |
2.915 |
0.552 |
4.796 |
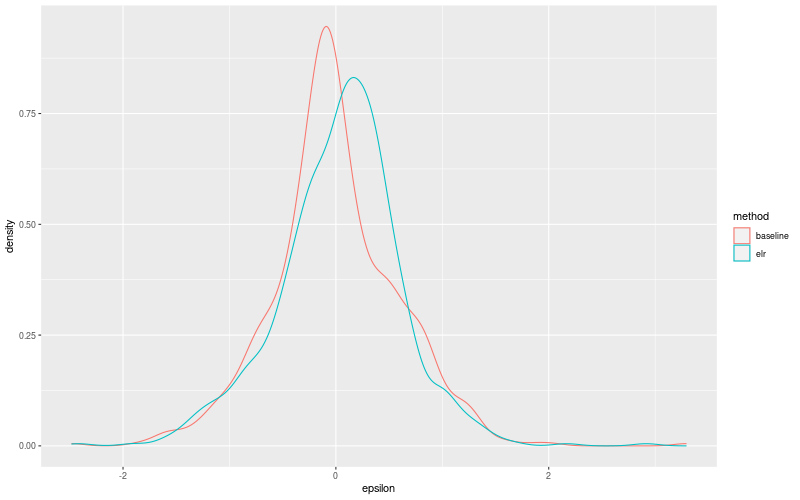
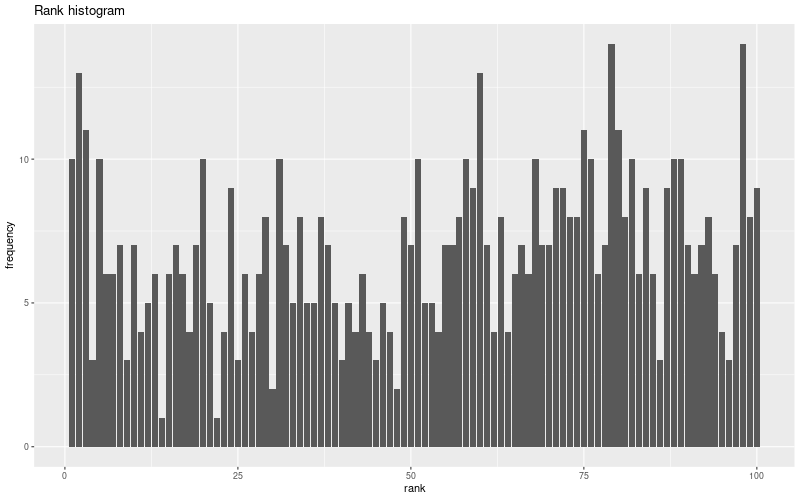
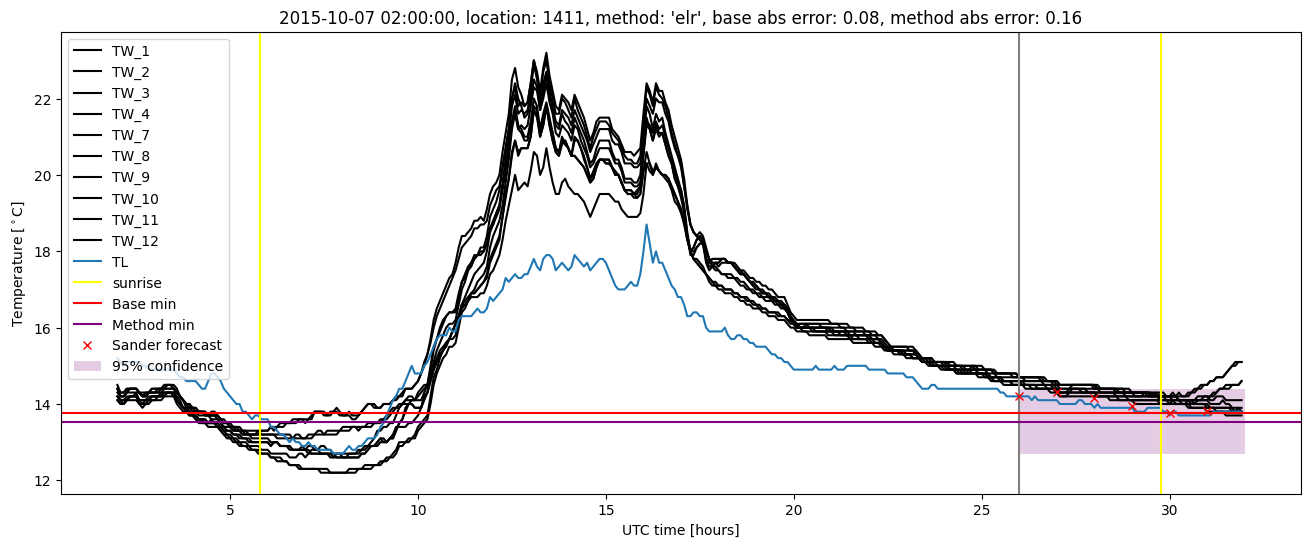
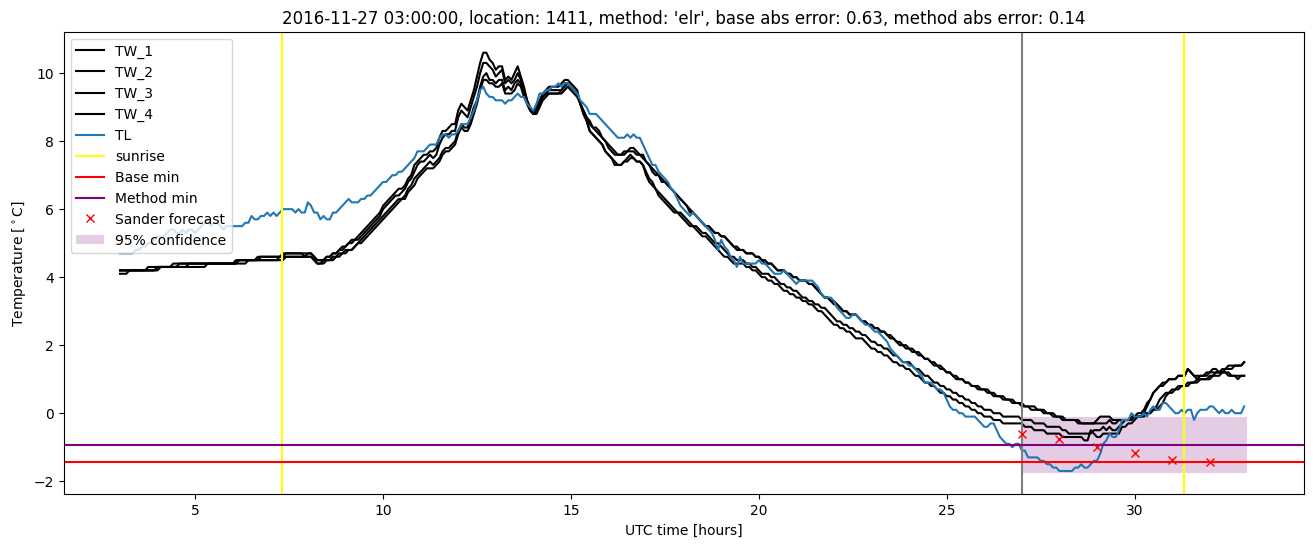
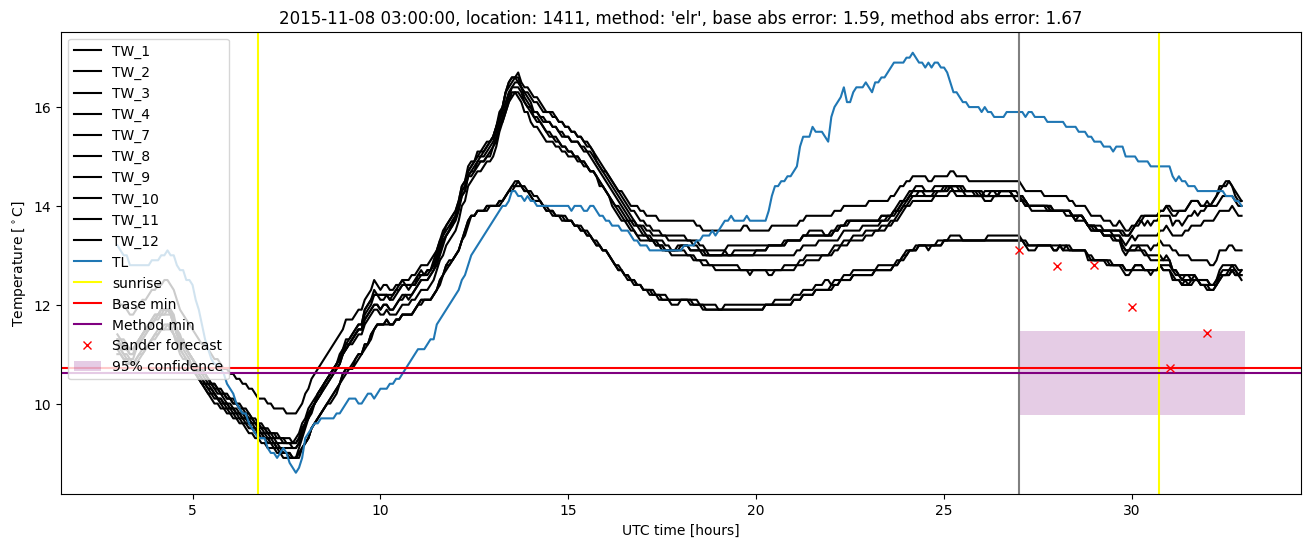
Extended logistic regression plots