GMS location: 1410
Random forest results
| names |
period |
power |
significance |
meanSquareError |
absError |
maxError |
CRPS |
IGN |
| baseline |
winter 2016 |
0.976 |
0.042 |
0.346 |
0.451 |
2.149 |
NaN |
NaN |
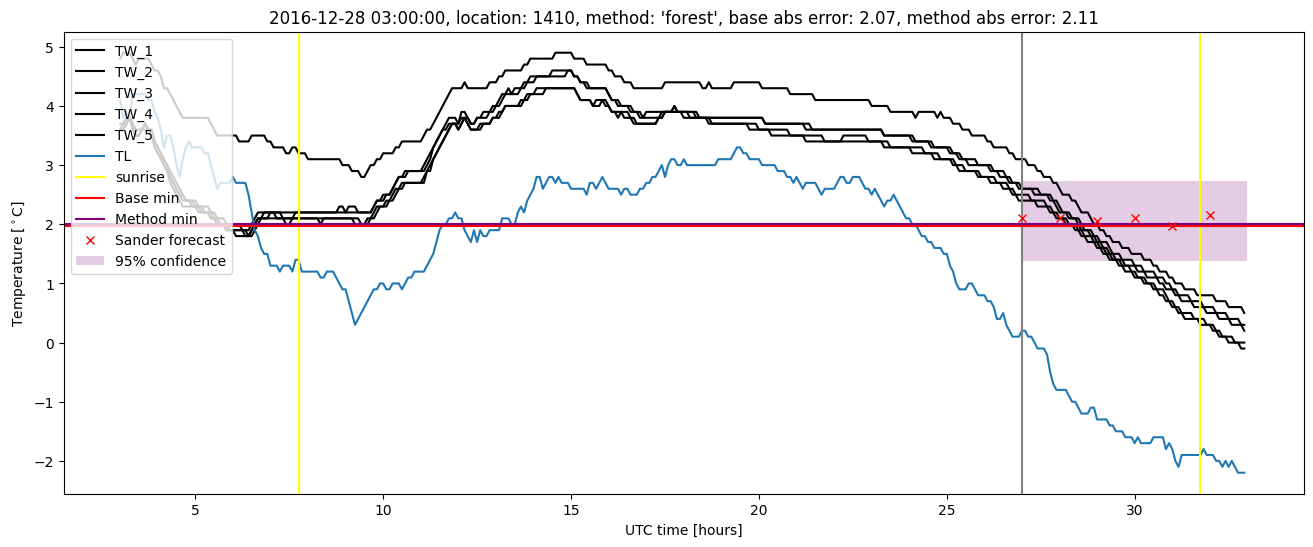
| forest |
winter 2016 |
0.976 |
0.042 |
0.242 |
0.372 |
2.107 |
0.473 |
3.556 |
| baseline |
winter 2017 |
0.963 |
0.093 |
0.561 |
0.549 |
2.298 |
NaN |
NaN |
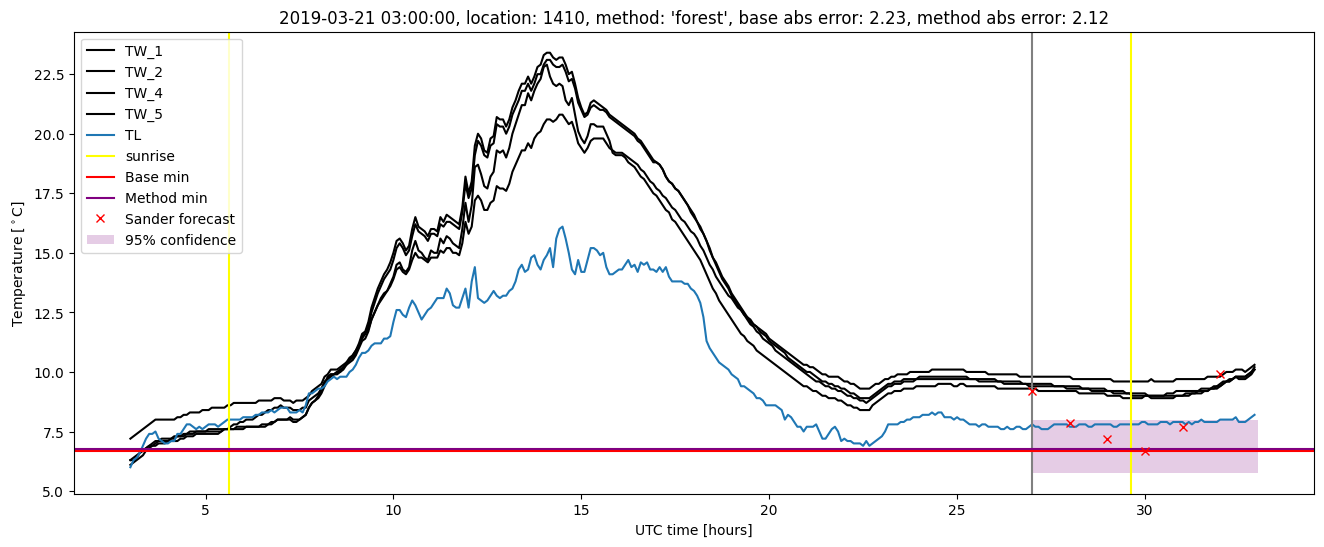
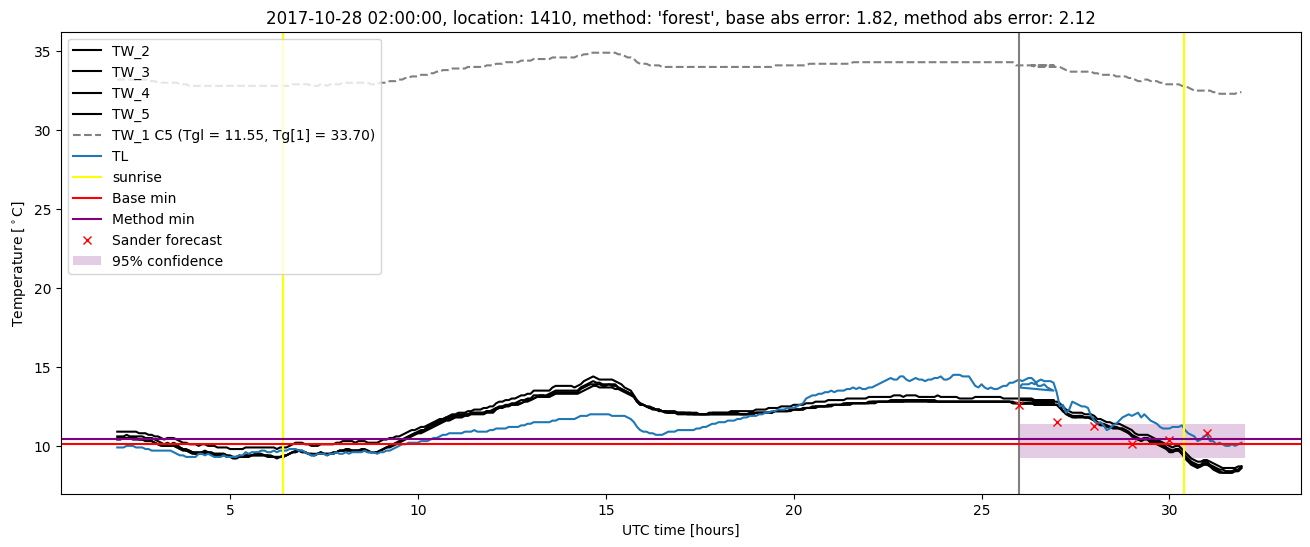
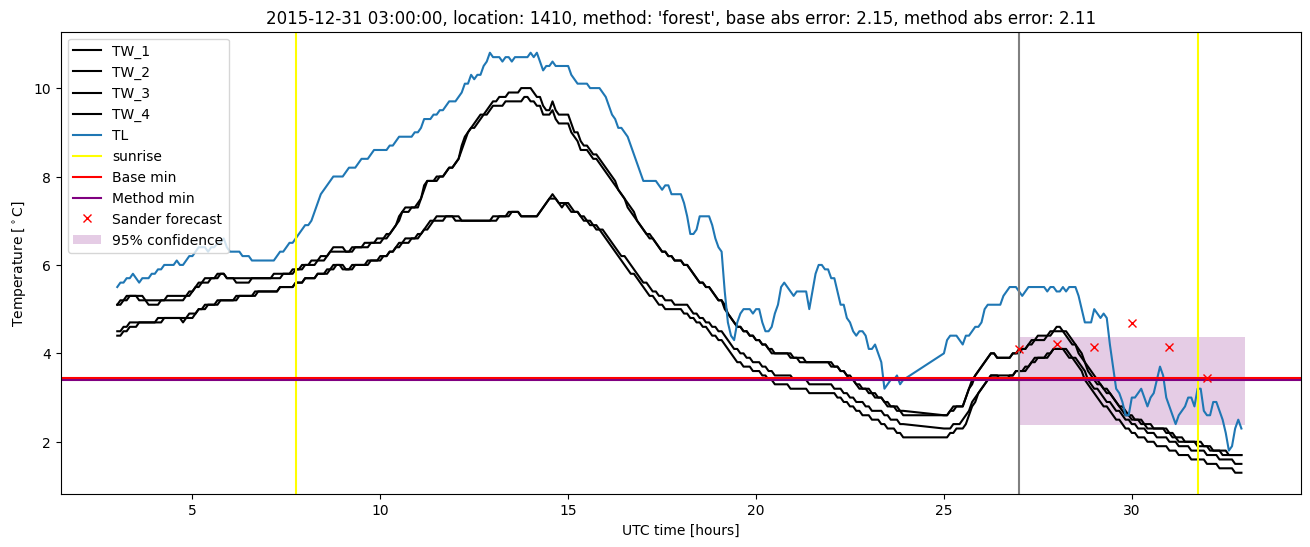
| forest |
winter 2017 |
0.972 |
0.046 |
0.400 |
0.453 |
2.112 |
0.463 |
3.191 |
| baseline |
winter 2018 |
0.992 |
0.125 |
0.349 |
0.442 |
1.884 |
NaN |
NaN |
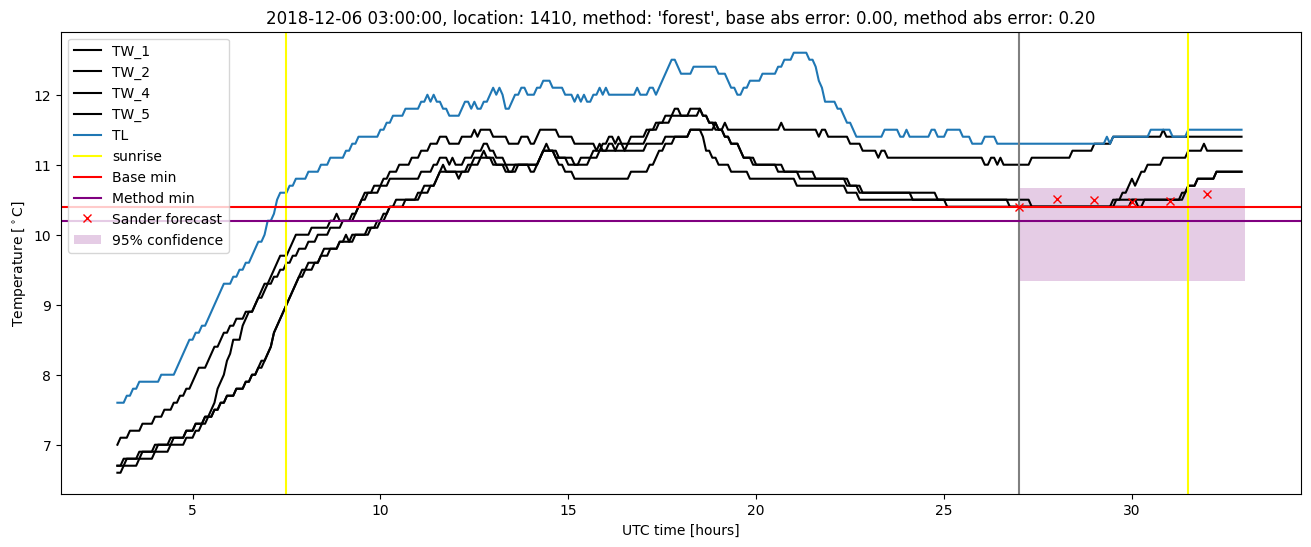
| forest |
winter 2018 |
0.992 |
0.125 |
0.304 |
0.406 |
2.123 |
0.482 |
2.889 |
| baseline |
winter 2019 |
0.980 |
0.000e+00 |
0.386 |
0.454 |
2.227 |
NaN |
NaN |
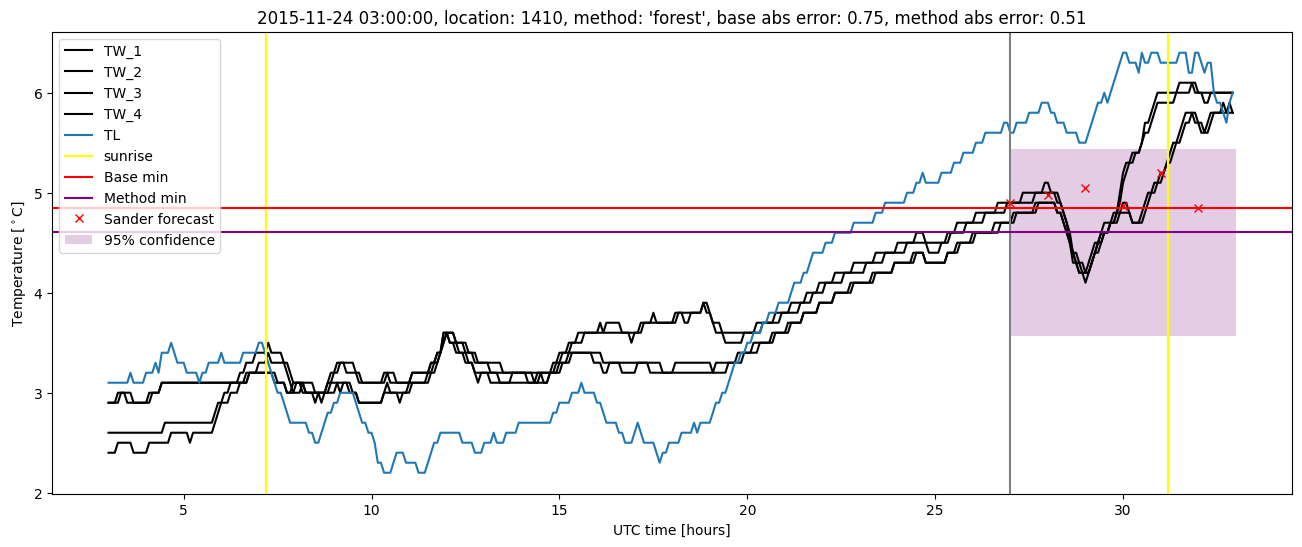
| forest |
winter 2019 |
0.994 |
0.000e+00 |
0.288 |
0.400 |
2.124 |
0.469 |
2.885 |
| baseline |
all |
0.978 |
0.081 |
0.406 |
0.471 |
2.298 |
NaN |
NaN |
| forest |
all |
0.984 |
0.063 |
0.304 |
0.405 |
2.124 |
0.472 |
3.146 |
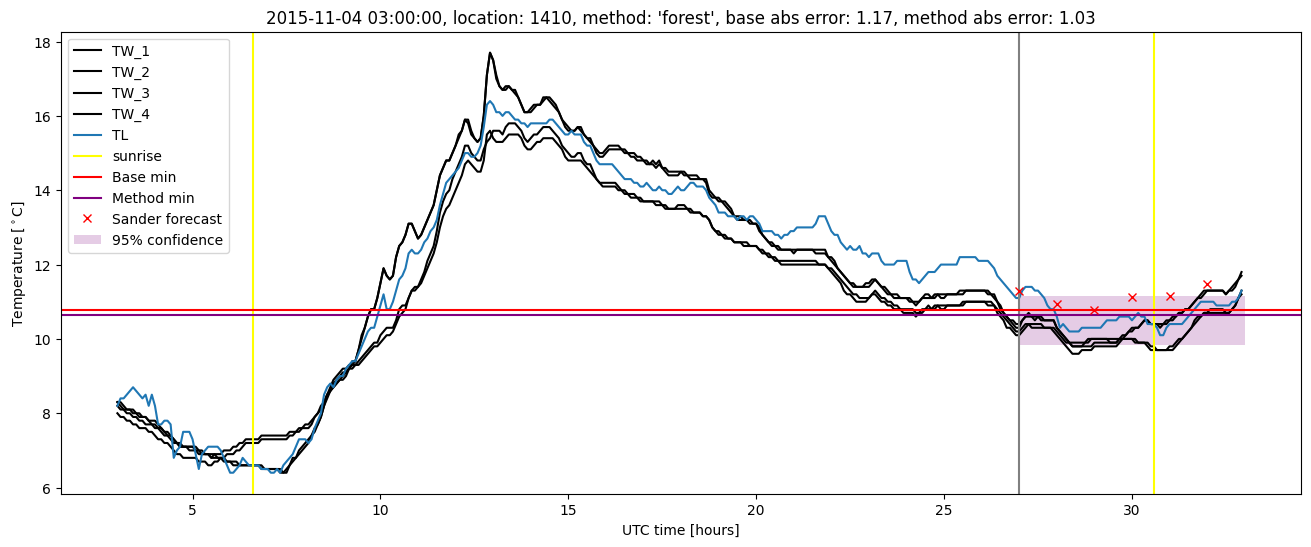
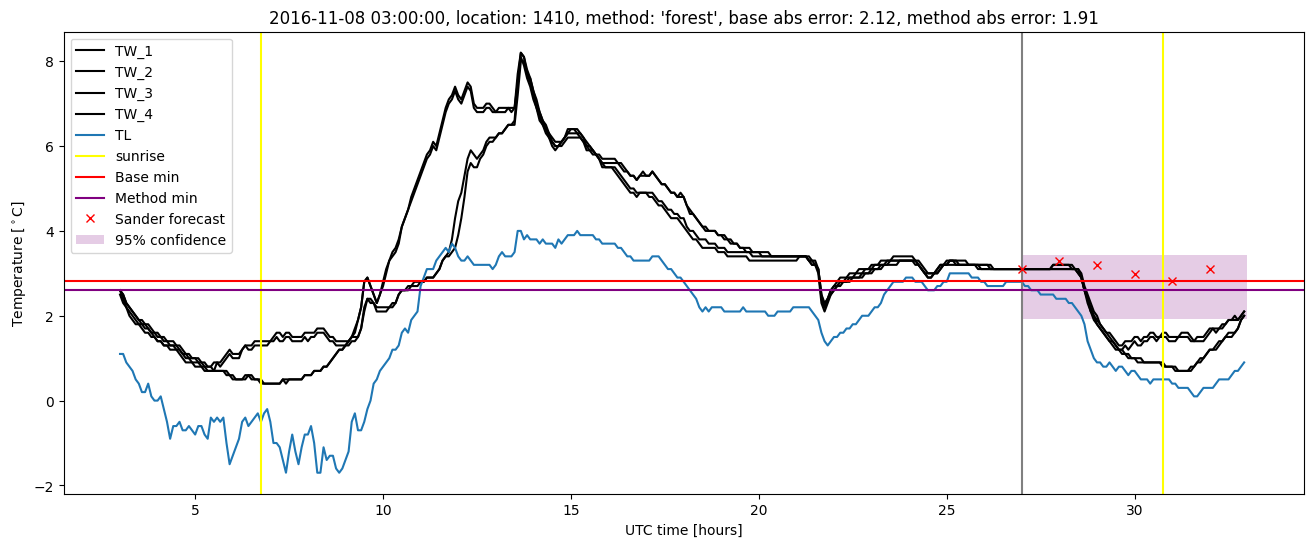
Random forest plots
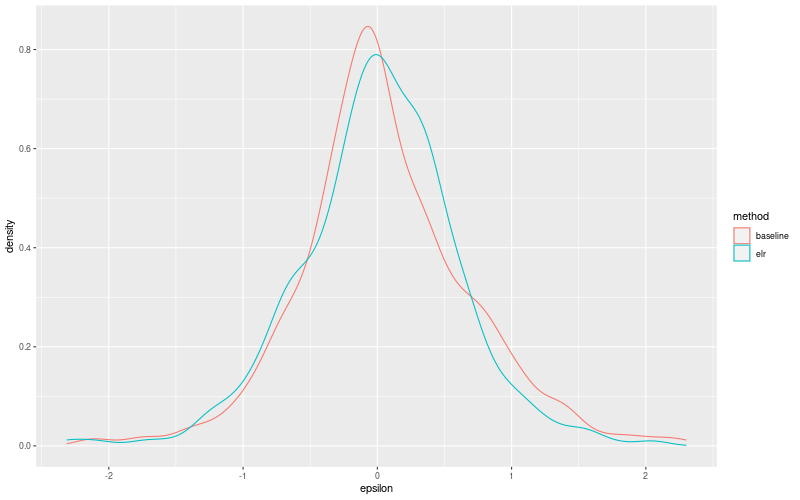
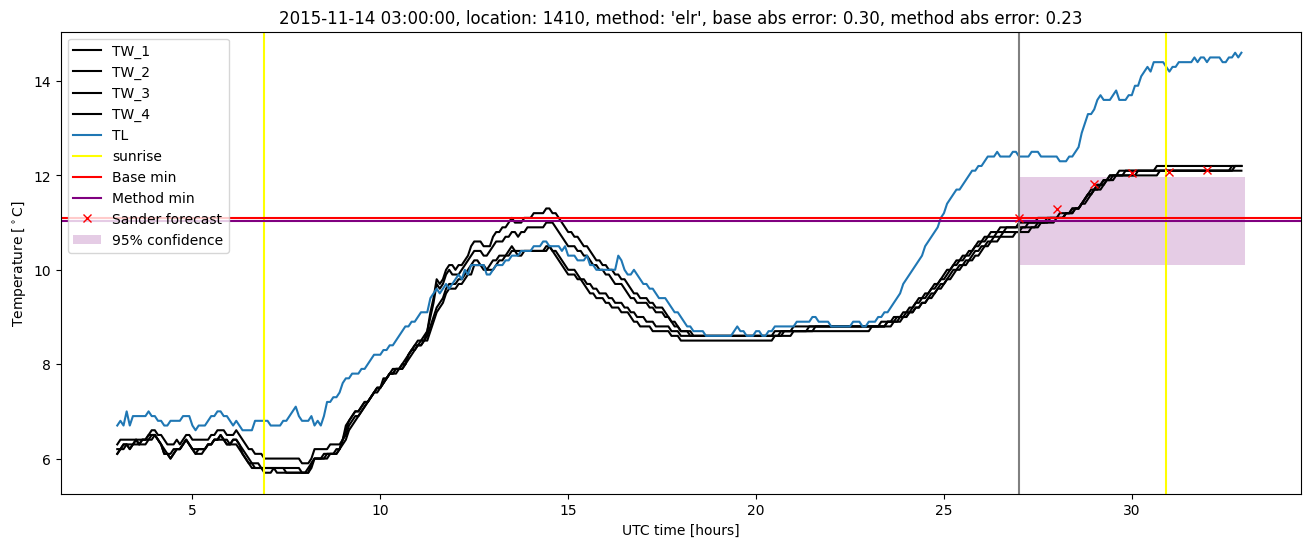
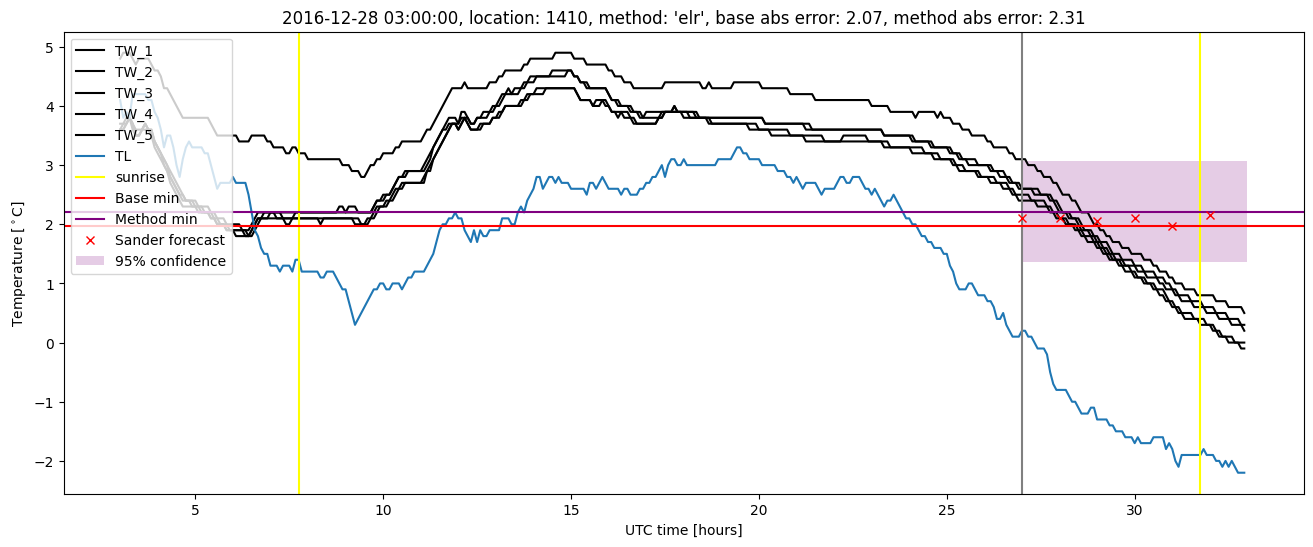
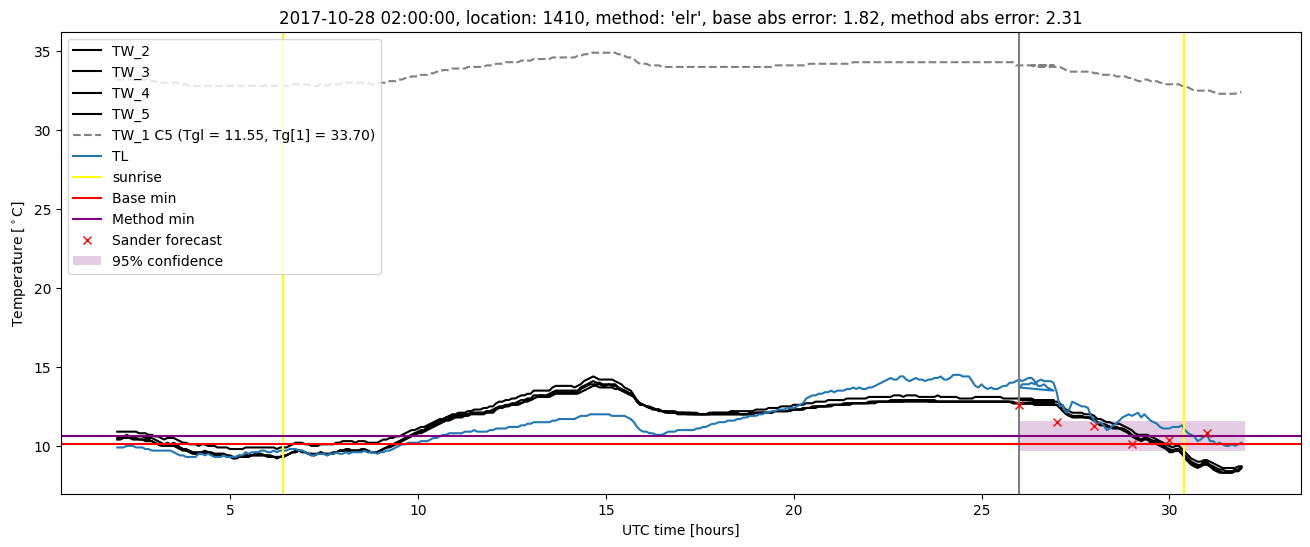
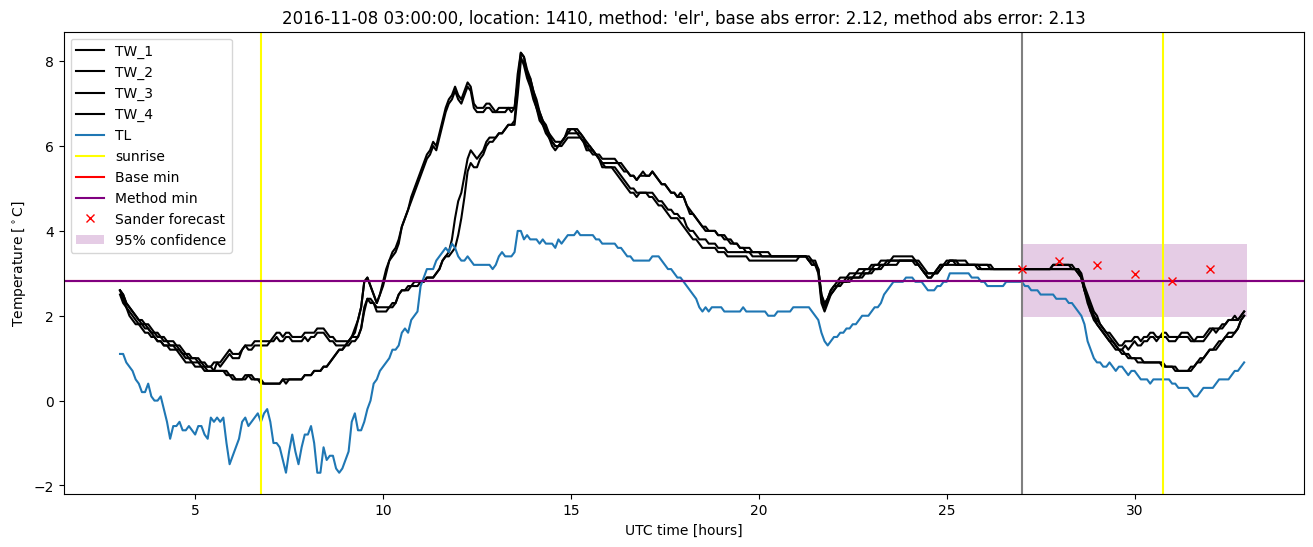
Extended logistic regression results
| names |
period |
power |
significance |
meanSquareError |
absError |
maxError |
CRPS |
IGN |
| baseline |
winter 2016 |
0.976 |
0.042 |
0.346 |
0.451 |
2.149 |
NaN |
NaN |
| elr |
winter 2016 |
0.964 |
0.042 |
0.289 |
0.424 |
2.069 |
0.528 |
3.391 |
| baseline |
winter 2017 |
0.963 |
0.093 |
0.561 |
0.549 |
2.298 |
NaN |
NaN |
| elr |
winter 2017 |
0.981 |
0.116 |
0.459 |
0.496 |
2.311 |
0.471 |
3.530 |
| baseline |
winter 2018 |
0.992 |
0.125 |
0.349 |
0.442 |
1.884 |
NaN |
NaN |
| elr |
winter 2018 |
0.984 |
0.125 |
0.312 |
0.414 |
2.310 |
0.522 |
3.160 |
| baseline |
winter 2019 |
0.980 |
0.000e+00 |
0.386 |
0.454 |
2.227 |
NaN |
NaN |
| elr |
winter 2019 |
1.000 |
0.000e+00 |
0.340 |
0.447 |
2.043 |
0.503 |
3.277 |
| baseline |
all |
0.978 |
0.081 |
0.406 |
0.471 |
2.298 |
NaN |
NaN |
| elr |
all |
0.982 |
0.090 |
0.345 |
0.444 |
2.311 |
0.508 |
3.339 |
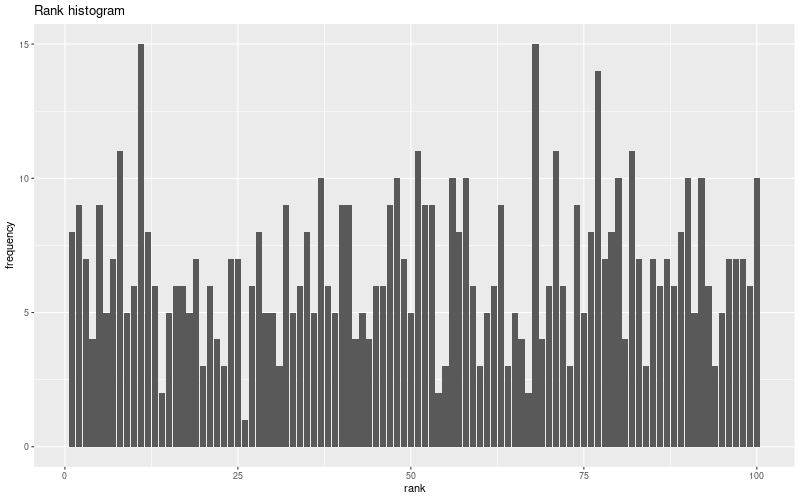
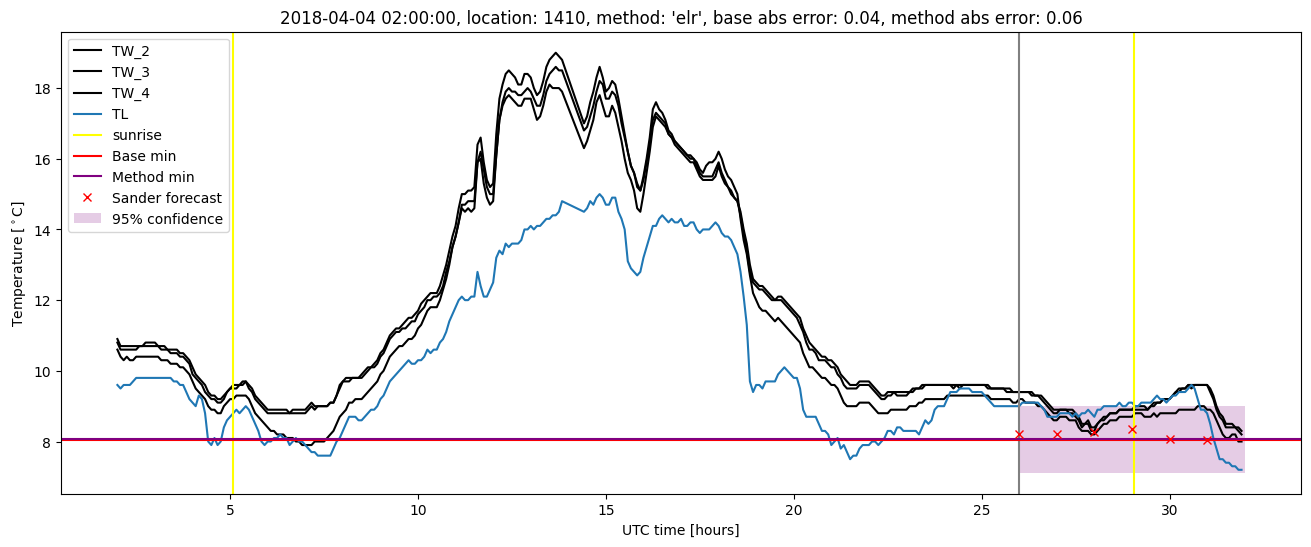
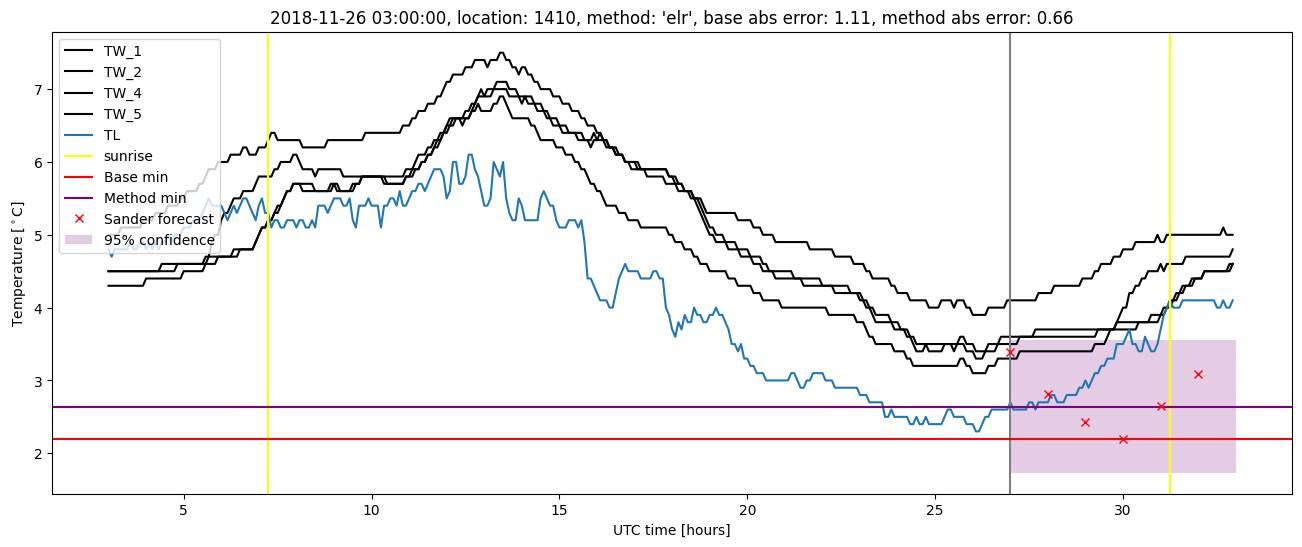
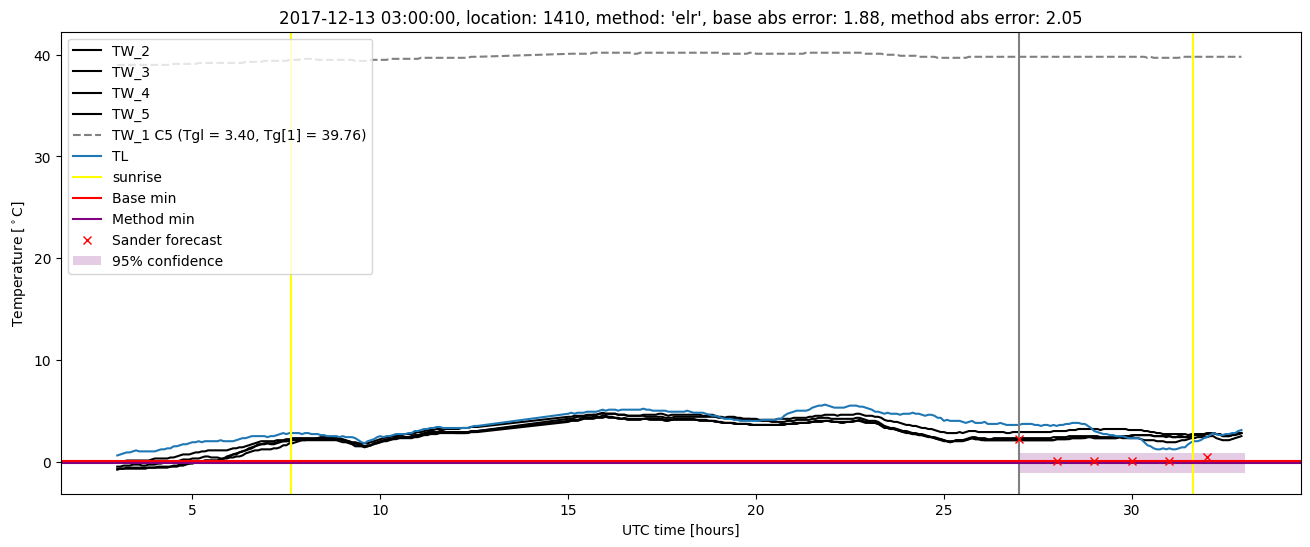
Extended logistic regression plots