GMS location: 1409
Random forest results
| names |
period |
power |
significance |
meanSquareError |
absError |
maxError |
CRPS |
IGN |
| baseline |
winter 2016 |
0.971 |
0.000e+00 |
0.415 |
0.474 |
2.307 |
NaN |
NaN |
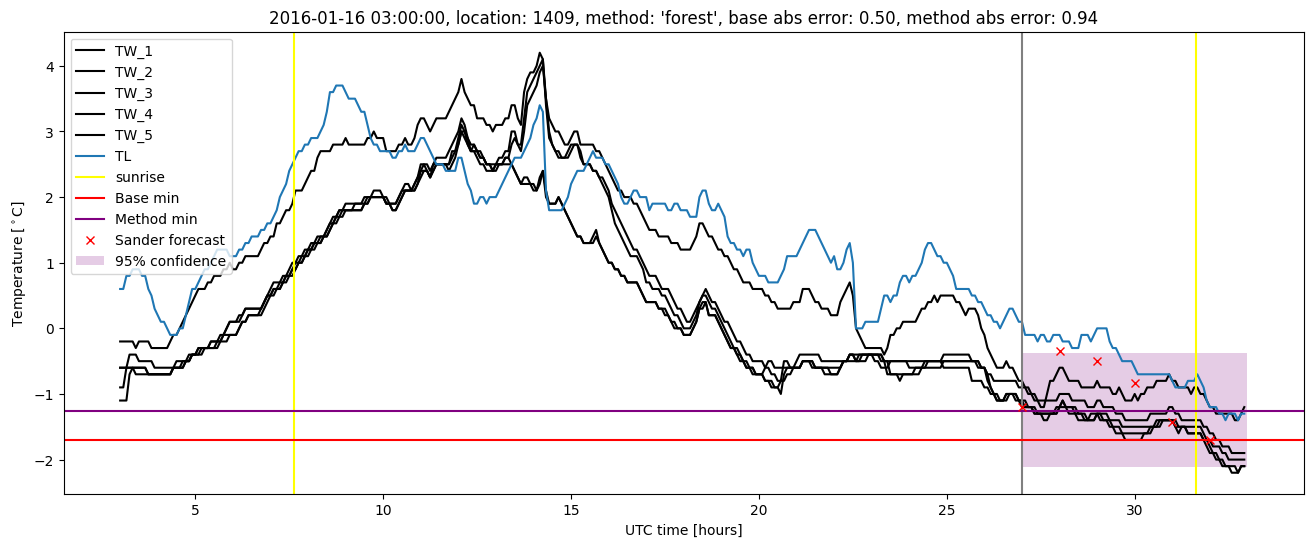
| forest |
winter 2016 |
0.982 |
0.000e+00 |
0.280 |
0.379 |
2.279 |
0.444 |
4.069 |
| baseline |
winter 2017 |
0.962 |
0.027 |
0.577 |
0.544 |
2.239 |
NaN |
NaN |
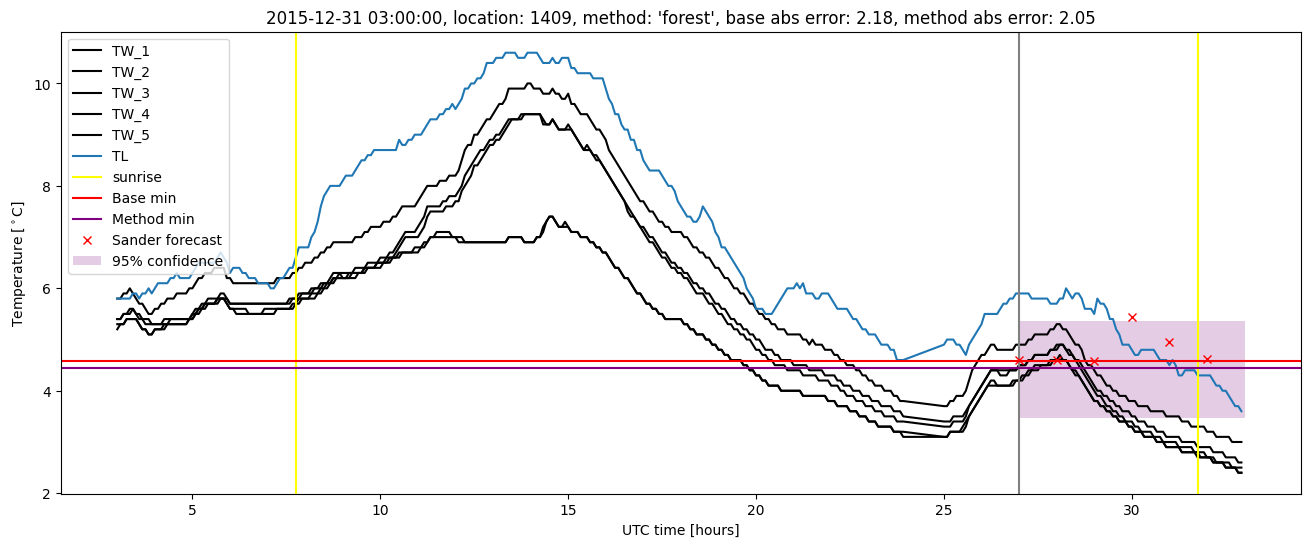
| forest |
winter 2017 |
0.971 |
0.054 |
0.351 |
0.431 |
1.746 |
0.436 |
3.661 |
| baseline |
winter 2018 |
1.000 |
0.077 |
0.371 |
0.450 |
1.966 |
NaN |
NaN |
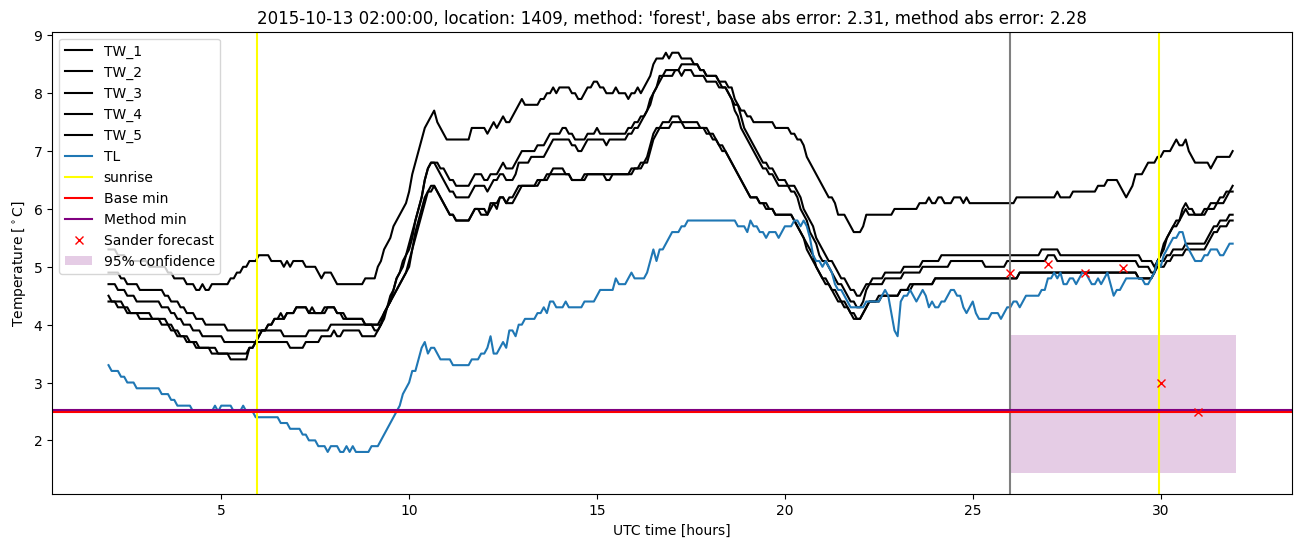
| forest |
winter 2018 |
0.992 |
0.103 |
0.291 |
0.399 |
1.930 |
0.441 |
3.322 |
| baseline |
winter 2019 |
0.978 |
0.000e+00 |
0.343 |
0.448 |
1.760 |
NaN |
NaN |
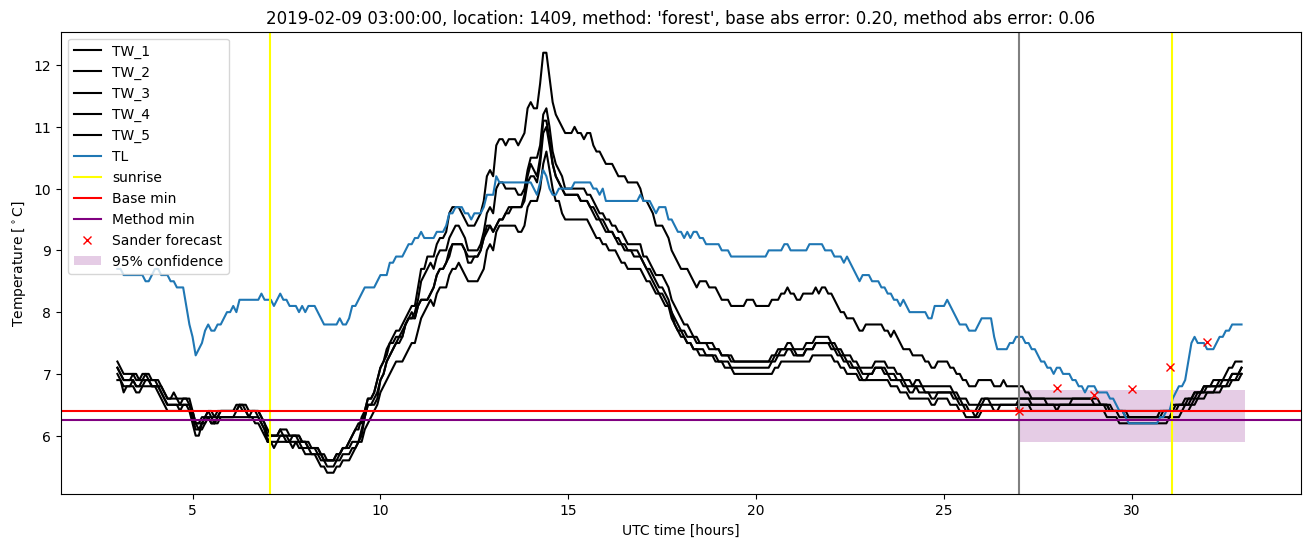
| forest |
winter 2019 |
0.993 |
0.000e+00 |
0.199 |
0.339 |
1.313 |
0.430 |
2.729 |
| baseline |
all |
0.978 |
0.037 |
0.423 |
0.477 |
2.307 |
NaN |
NaN |
| forest |
all |
0.985 |
0.055 |
0.280 |
0.386 |
2.279 |
0.438 |
3.484 |
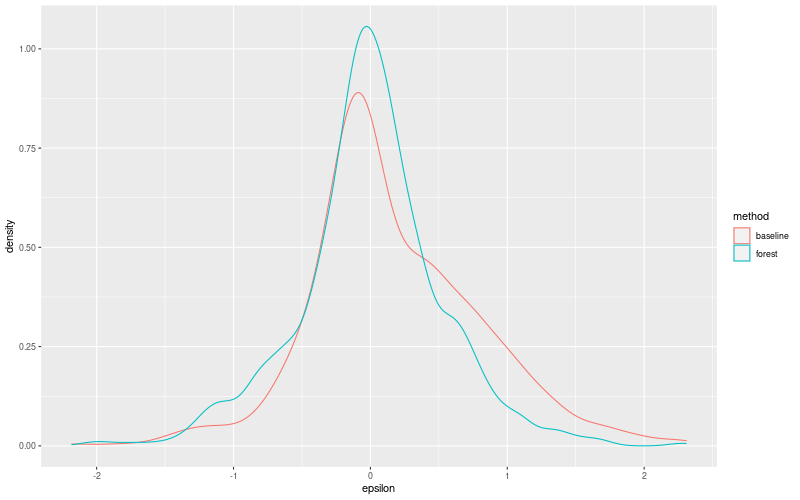
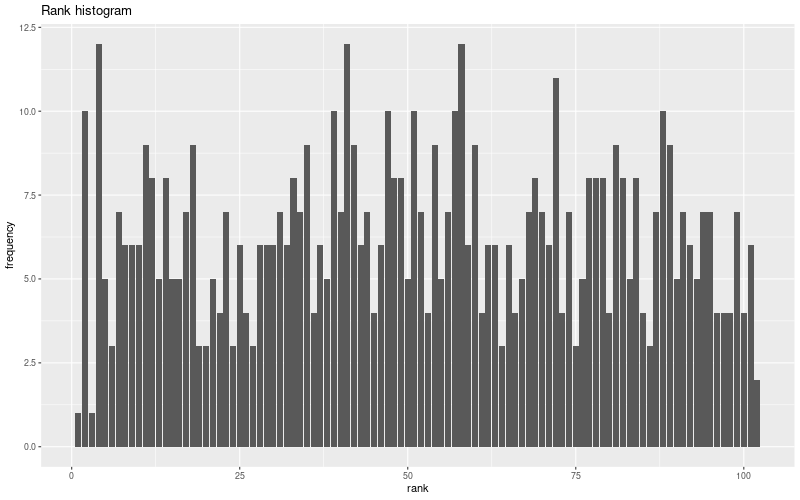
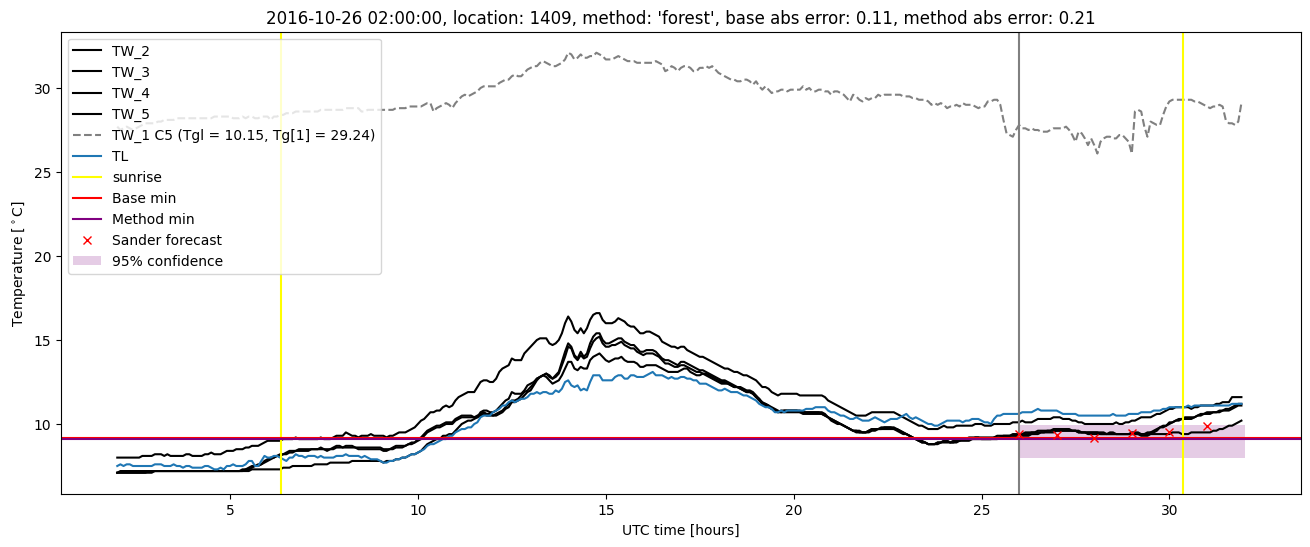
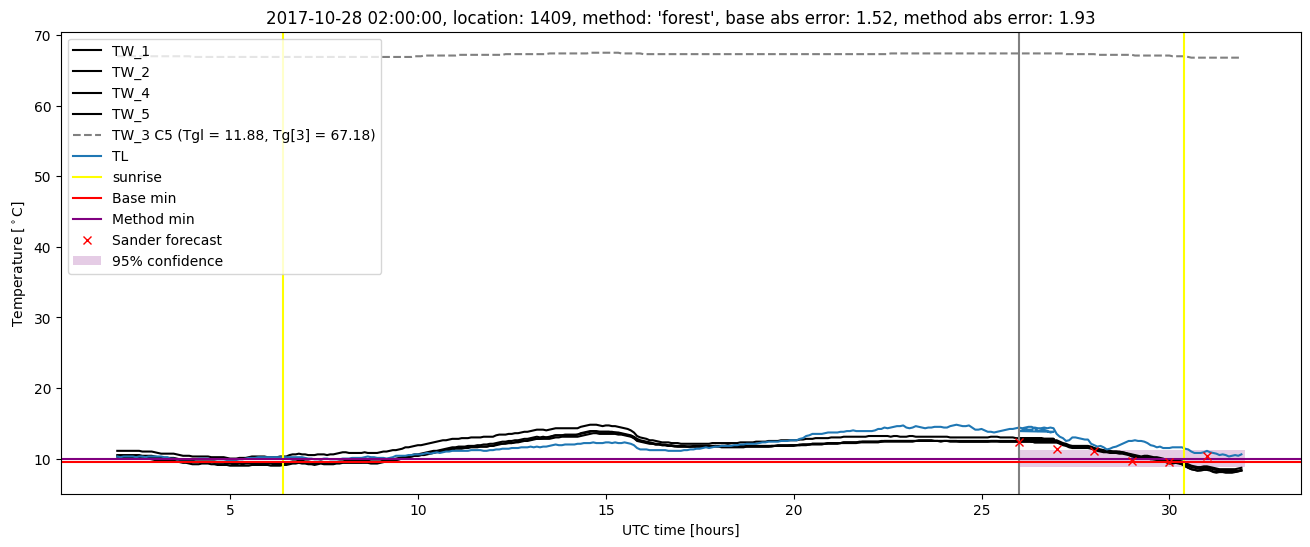
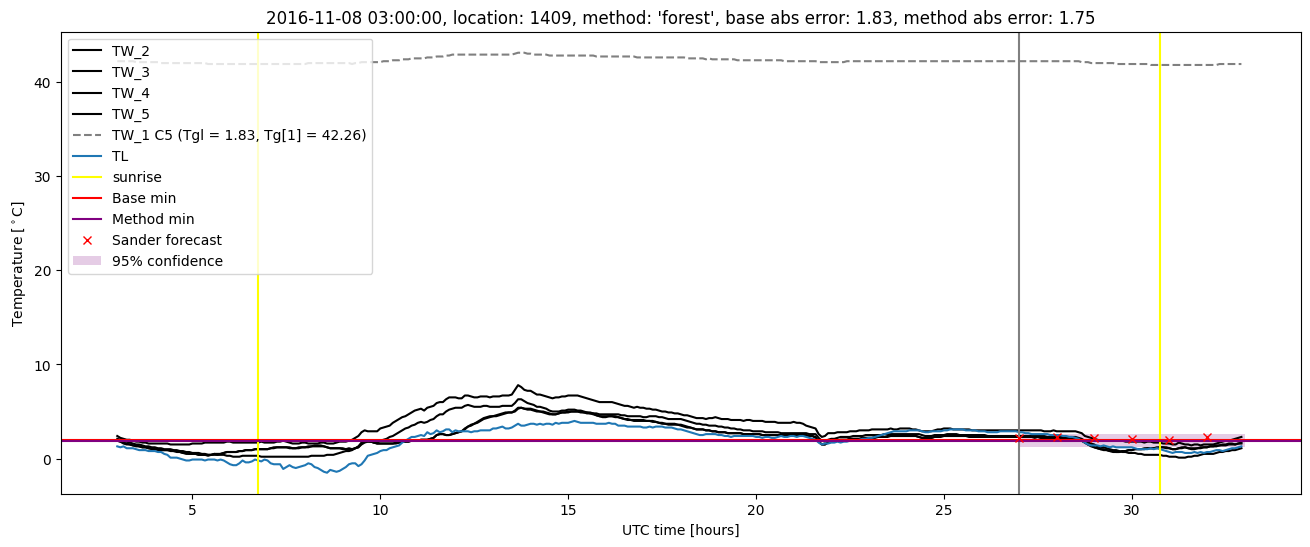
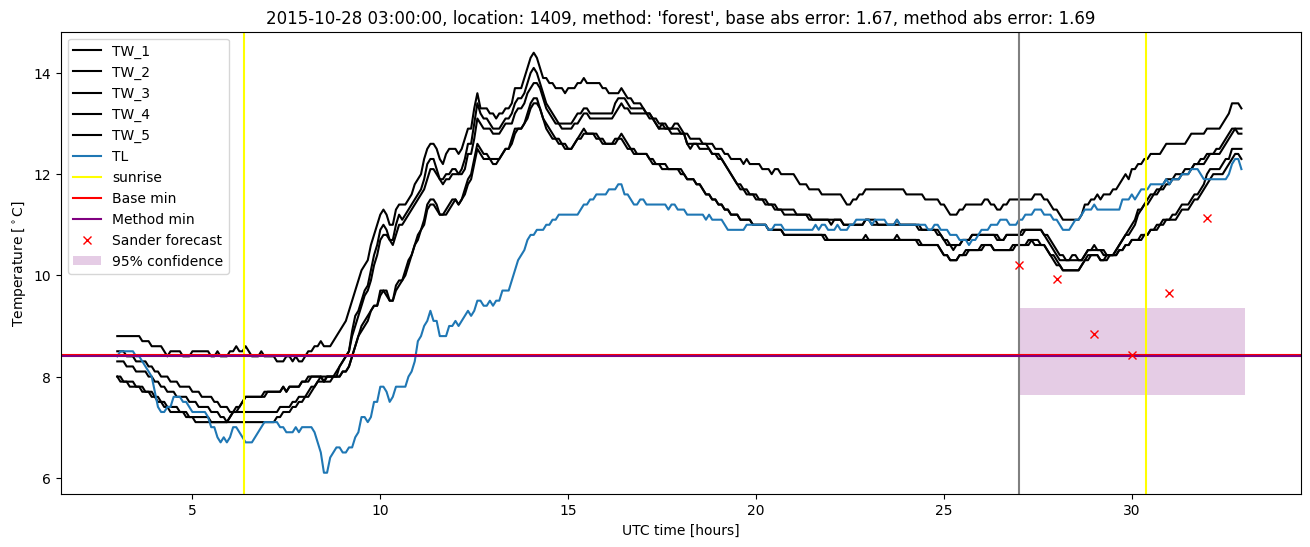
Random forest plots
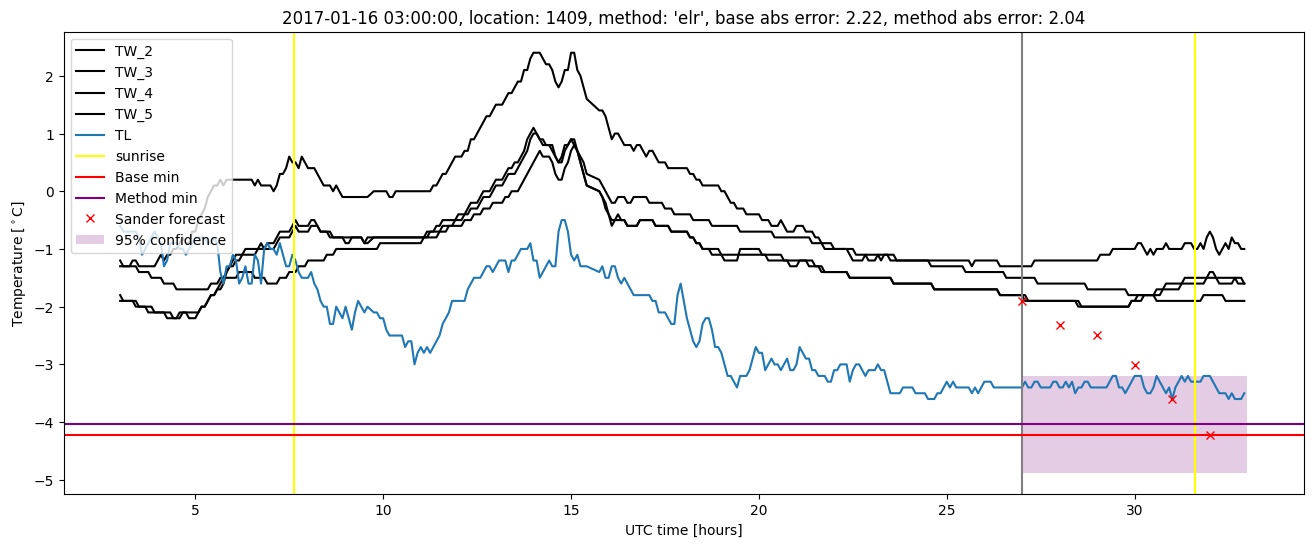
Extended logistic regression results
| names |
period |
power |
significance |
meanSquareError |
absError |
maxError |
CRPS |
IGN |
| baseline |
winter 2016 |
0.971 |
0.000e+00 |
0.415 |
0.474 |
2.307 |
NaN |
NaN |
| elr |
winter 2016 |
0.953 |
0.000e+00 |
0.347 |
0.428 |
2.407 |
0.535 |
4.625 |
| baseline |
winter 2017 |
0.962 |
0.027 |
0.577 |
0.544 |
2.239 |
NaN |
NaN |
| elr |
winter 2017 |
0.971 |
0.081 |
0.430 |
0.492 |
2.092 |
0.509 |
4.503 |
| baseline |
winter 2018 |
1.000 |
0.077 |
0.371 |
0.450 |
1.966 |
NaN |
NaN |
| elr |
winter 2018 |
0.992 |
0.103 |
0.312 |
0.430 |
1.867 |
0.526 |
4.201 |
| baseline |
winter 2019 |
0.978 |
0.000e+00 |
0.343 |
0.448 |
1.760 |
NaN |
NaN |
| elr |
winter 2019 |
0.993 |
0.000e+00 |
0.248 |
0.386 |
1.524 |
0.507 |
3.507 |
| baseline |
all |
0.978 |
0.037 |
0.423 |
0.477 |
2.307 |
NaN |
NaN |
| elr |
all |
0.976 |
0.064 |
0.334 |
0.433 |
2.407 |
0.521 |
4.236 |
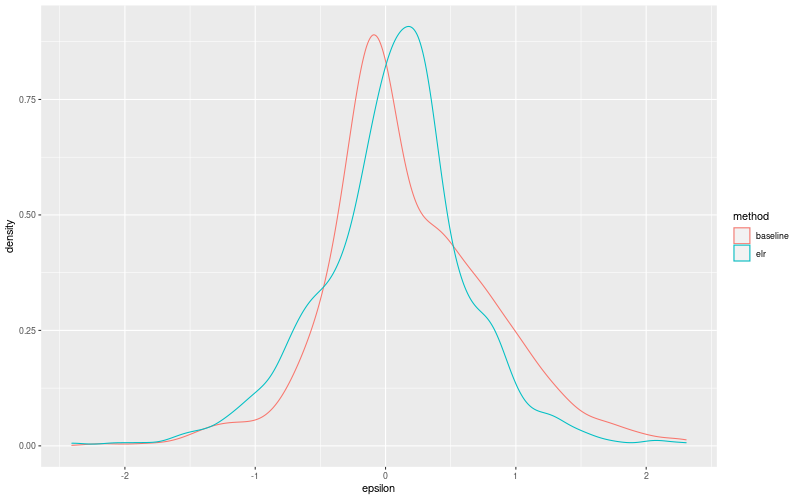
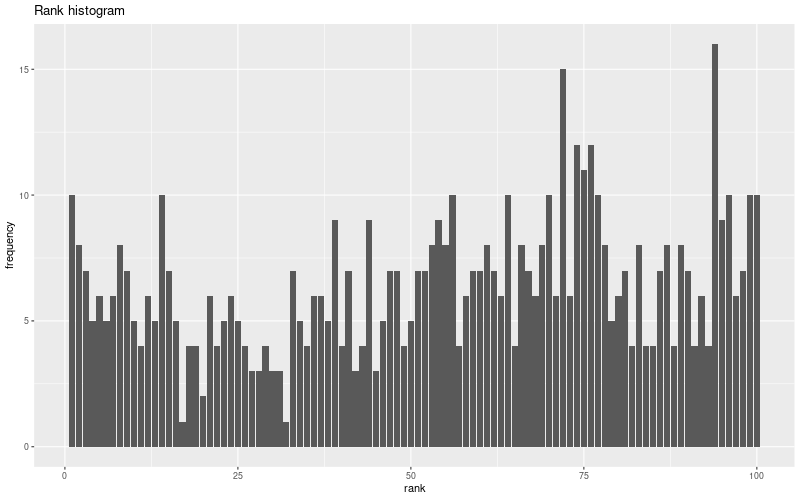
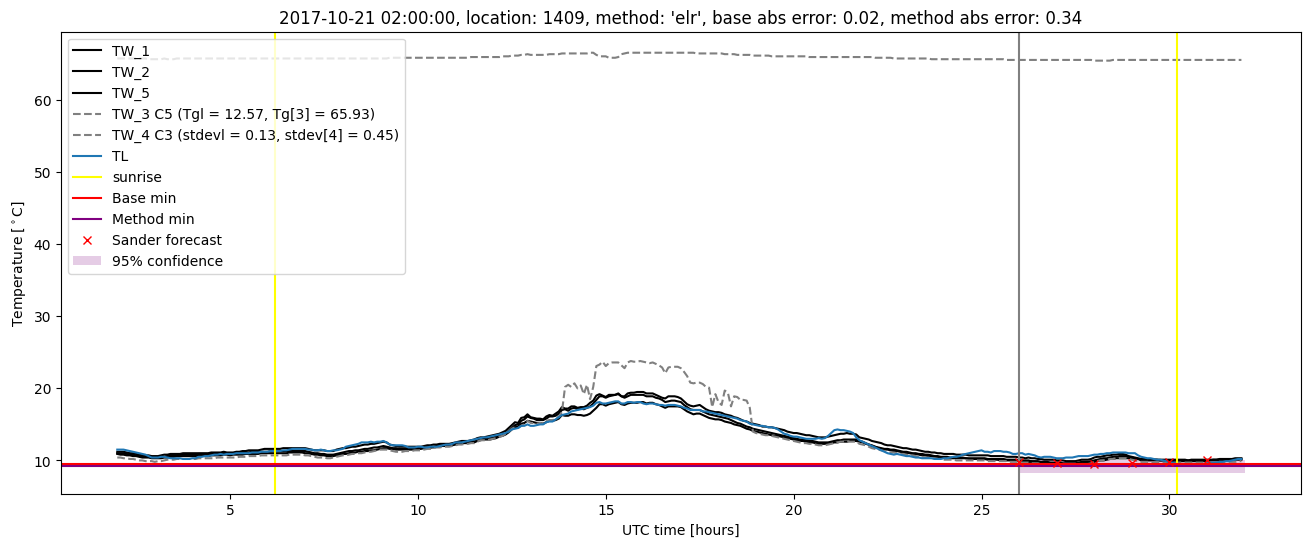
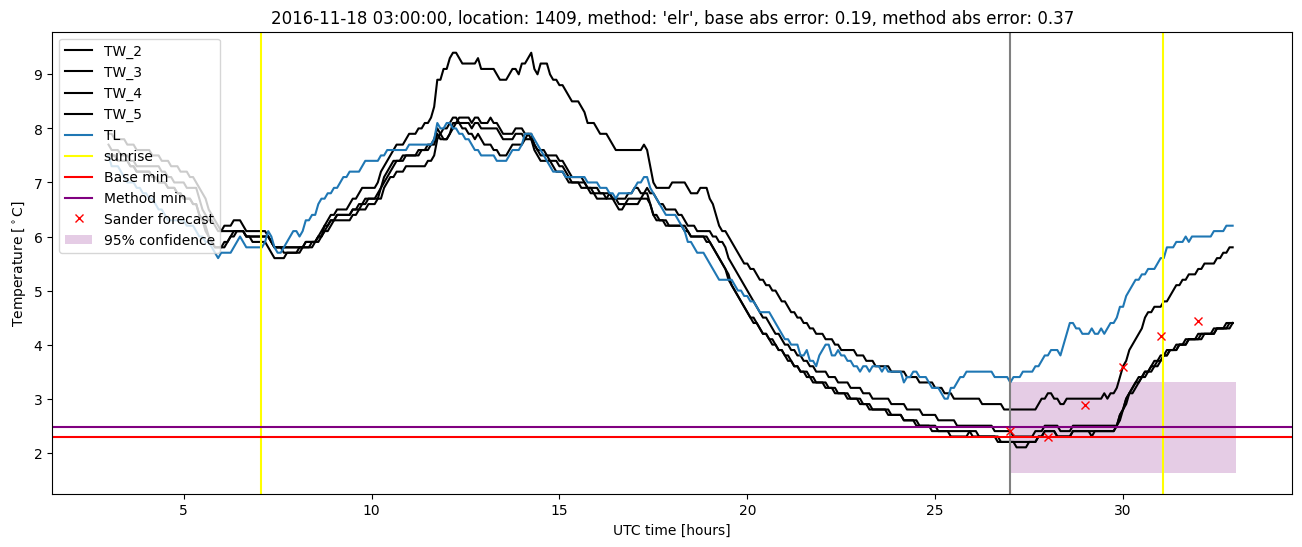
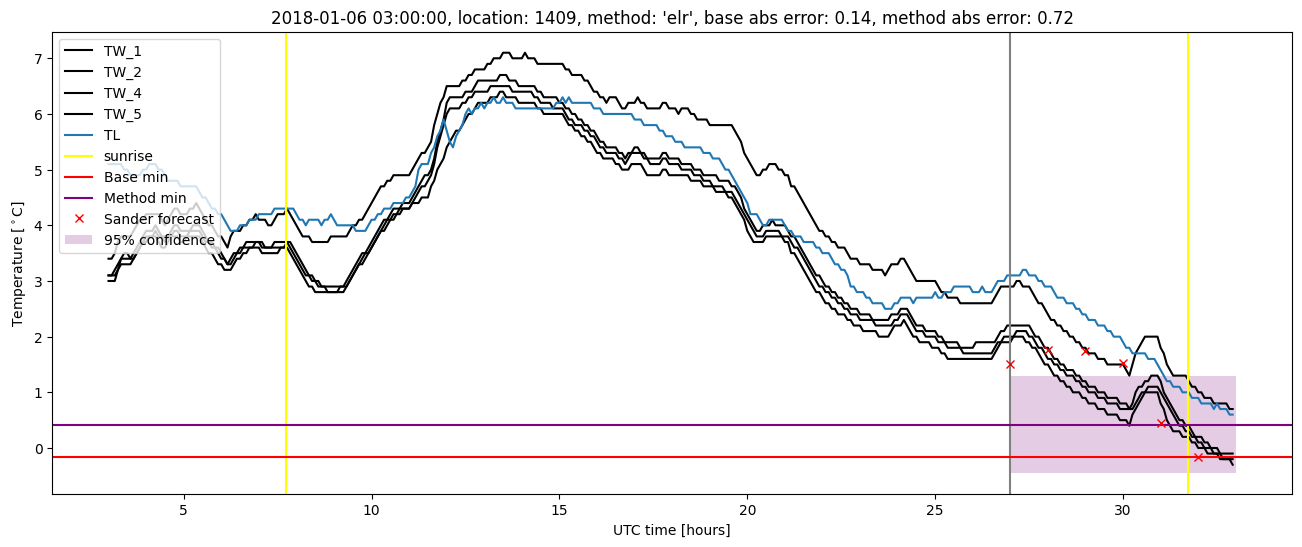
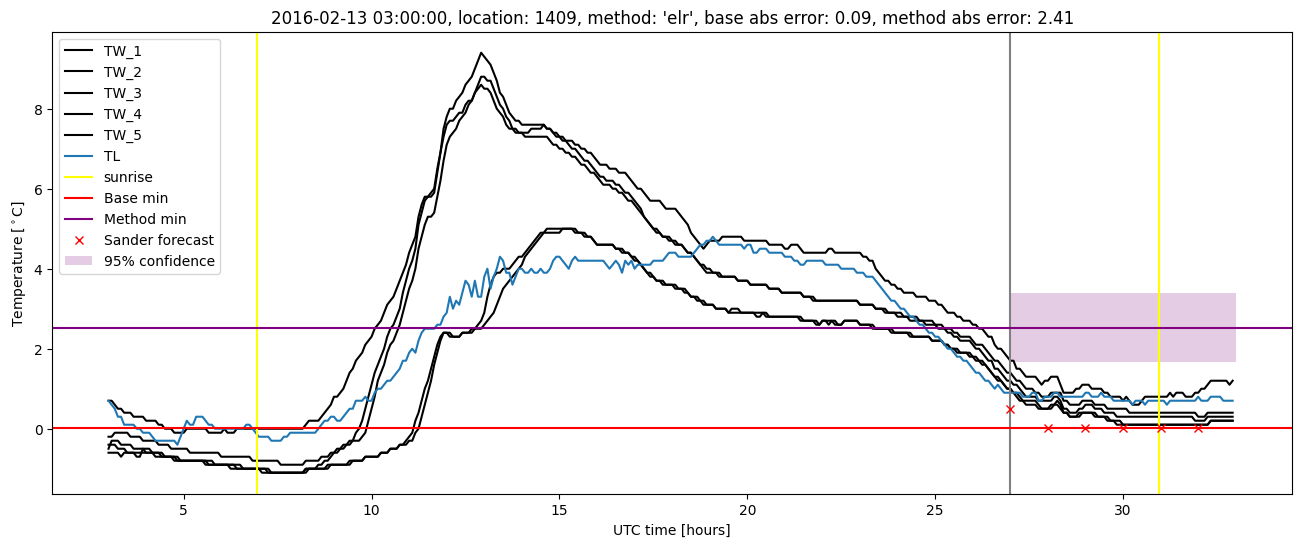
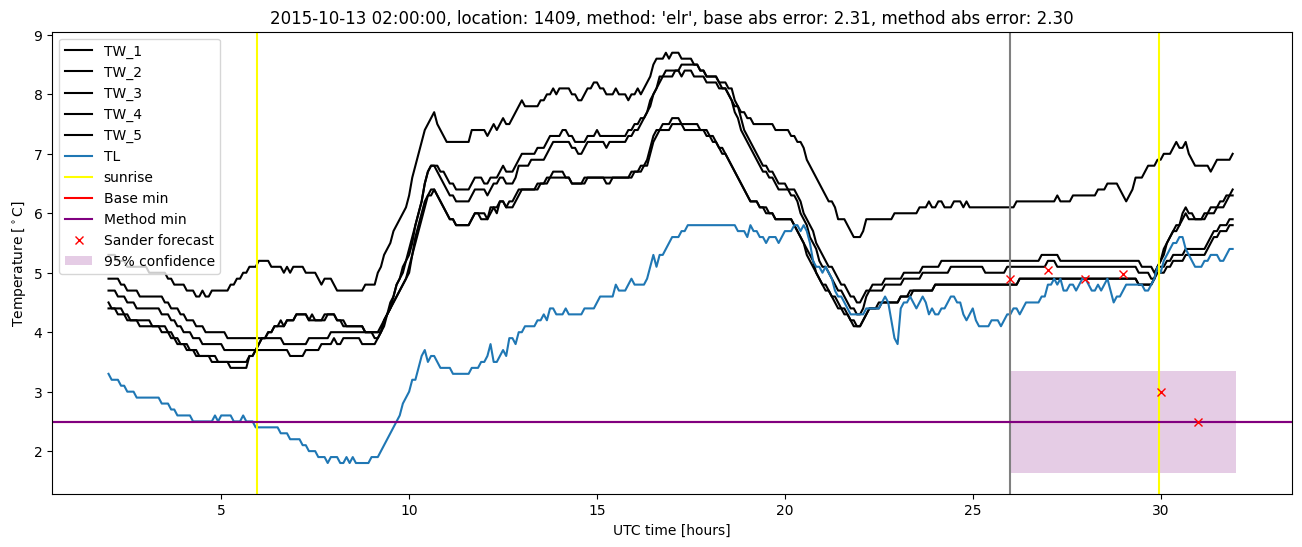
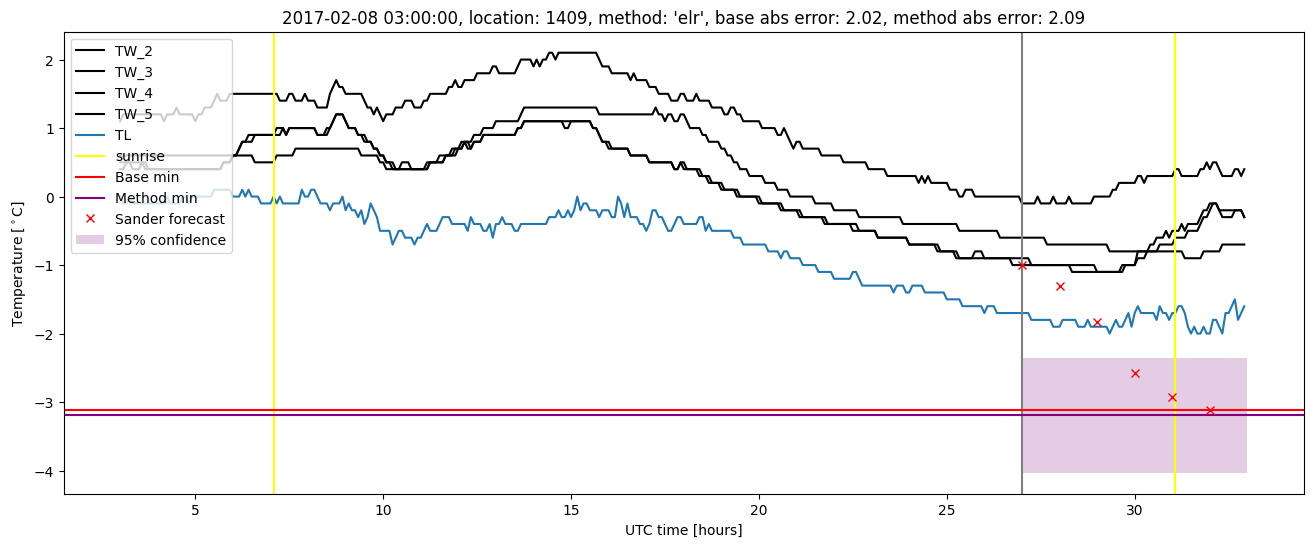
Extended logistic regression plots