GMS location: 1408
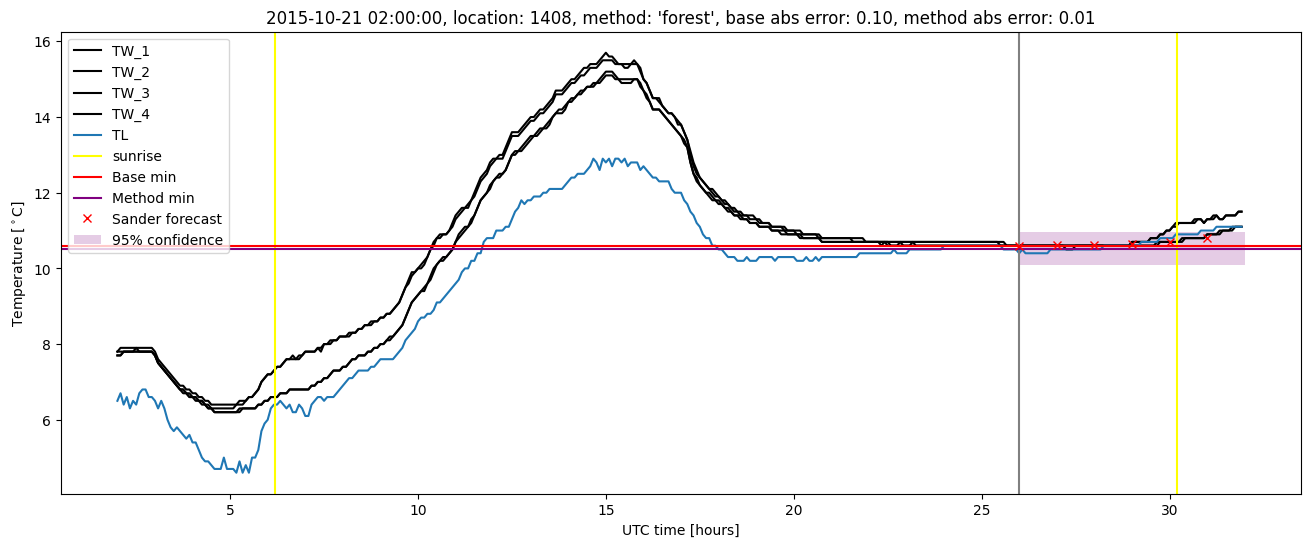
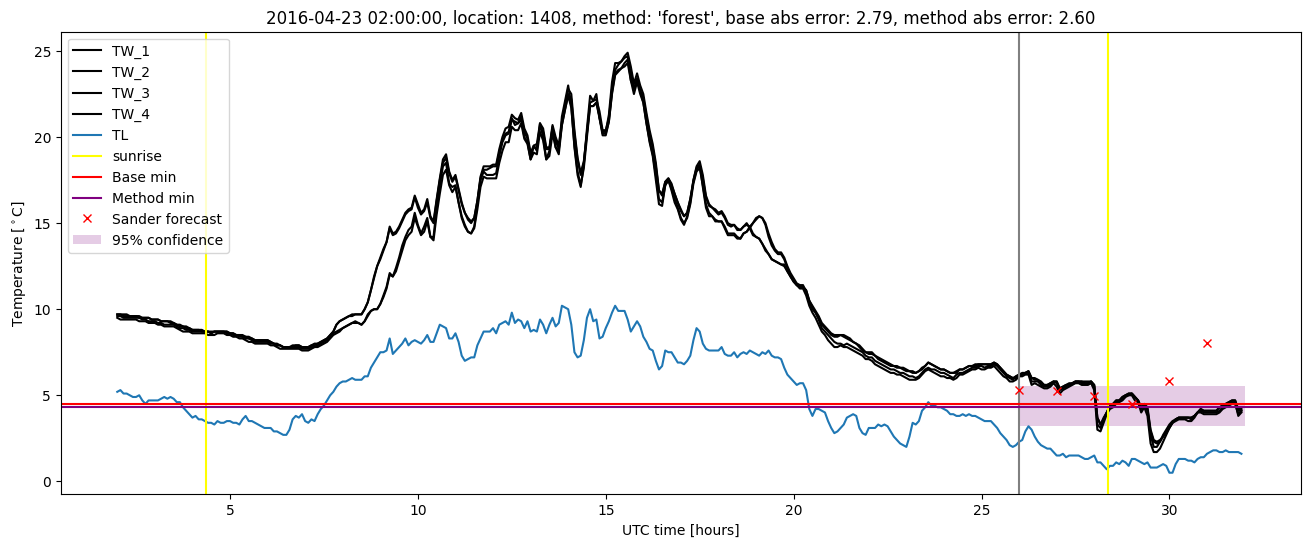
Random forest results
| names |
period |
power |
significance |
meanSquareError |
absError |
maxError |
CRPS |
IGN |
| baseline |
winter 2016 |
0.989 |
0.103 |
0.344 |
0.425 |
2.788 |
NaN |
NaN |
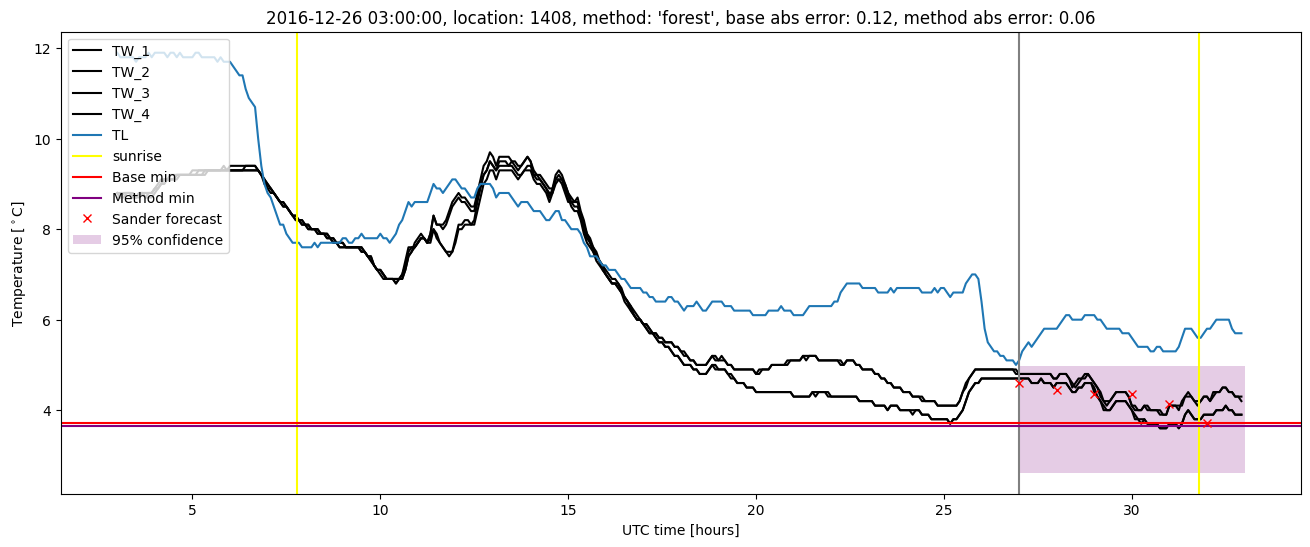
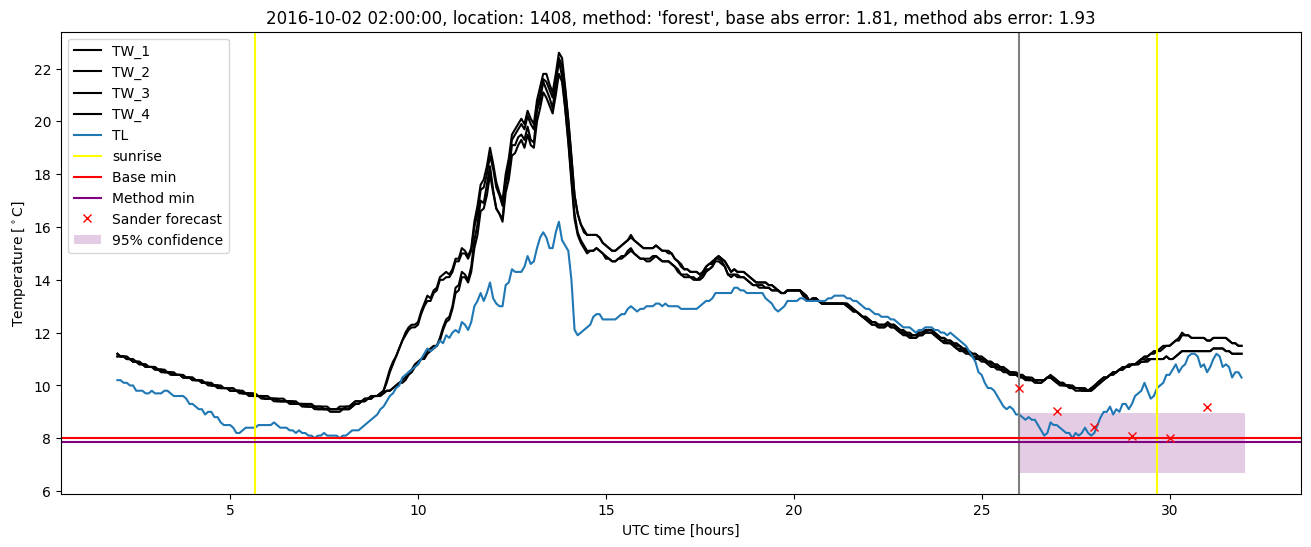
| forest |
winter 2016 |
0.989 |
0.069 |
0.318 |
0.417 |
2.596 |
0.480 |
3.479 |
| baseline |
winter 2017 |
0.973 |
0.105 |
0.481 |
0.488 |
2.977 |
NaN |
NaN |
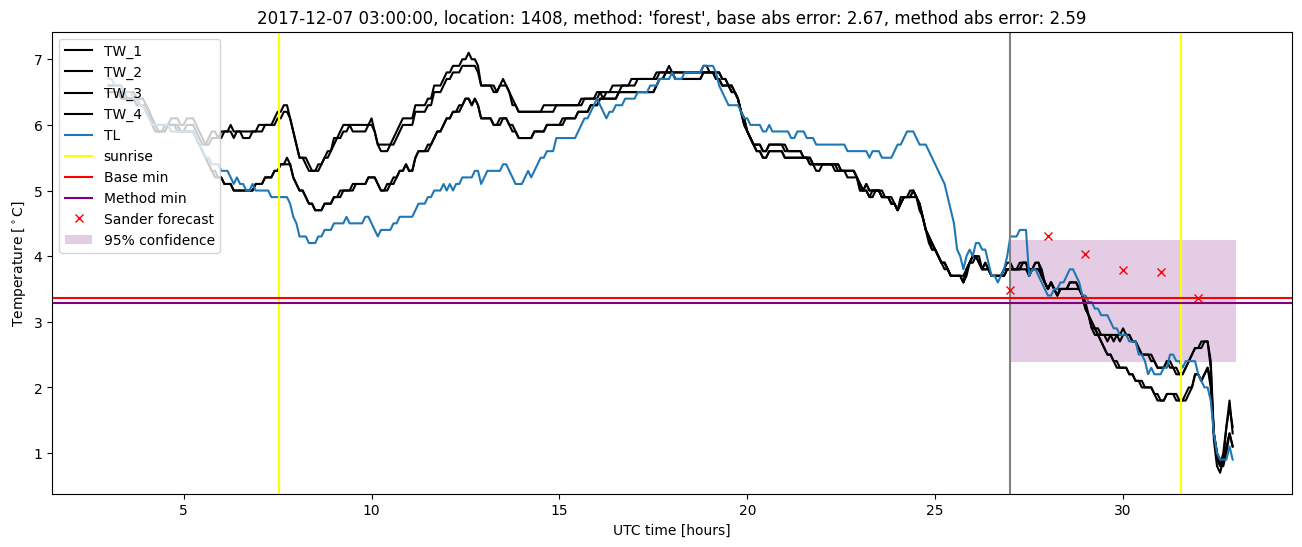
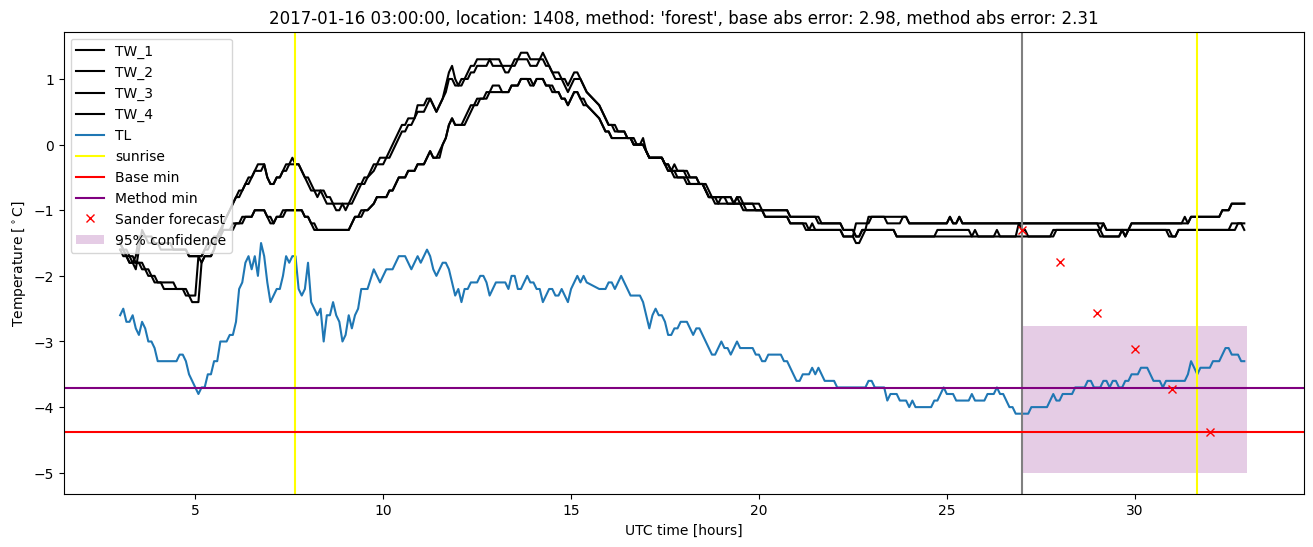
| forest |
winter 2017 |
0.982 |
0.053 |
0.442 |
0.463 |
2.310 |
0.490 |
3.963 |
| baseline |
winter 2018 |
1.000 |
0.105 |
0.356 |
0.435 |
2.668 |
NaN |
NaN |
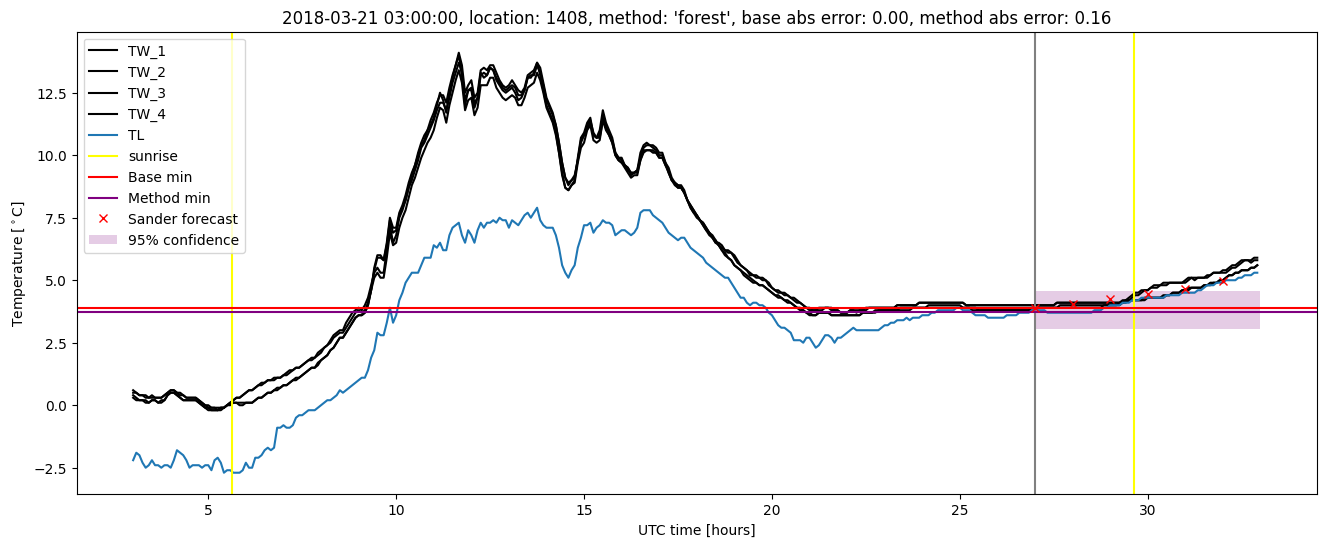
| forest |
winter 2018 |
0.986 |
0.079 |
0.336 |
0.432 |
2.590 |
0.510 |
3.493 |
| baseline |
winter 2019 |
0.986 |
0.000e+00 |
0.331 |
0.427 |
1.698 |
NaN |
NaN |
| forest |
winter 2019 |
0.971 |
0.000e+00 |
0.282 |
0.407 |
1.591 |
0.503 |
3.394 |
| baseline |
all |
0.988 |
0.093 |
0.374 |
0.442 |
2.977 |
NaN |
NaN |
| forest |
all |
0.982 |
0.059 |
0.341 |
0.429 |
2.596 |
0.495 |
3.569 |
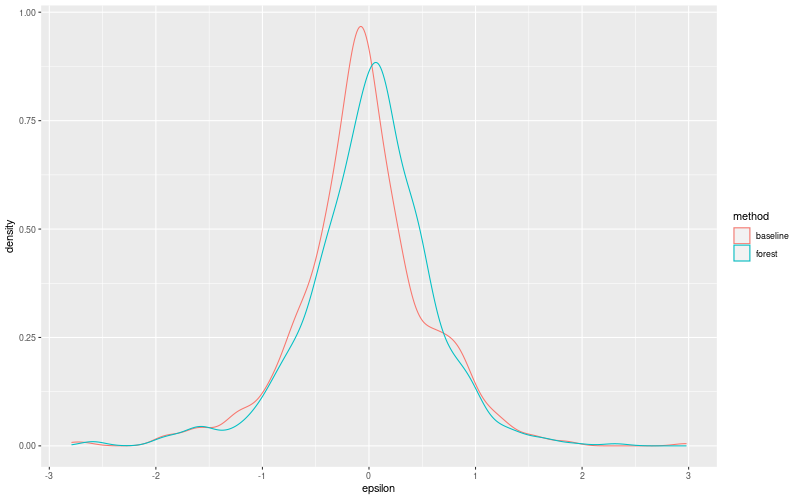
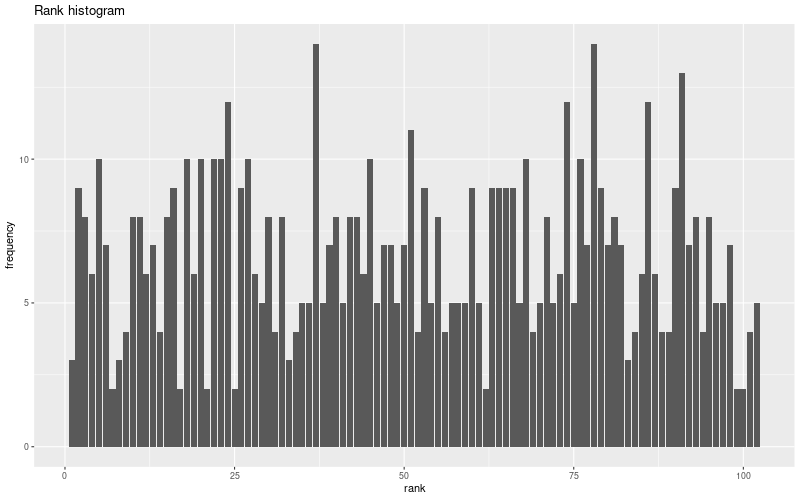
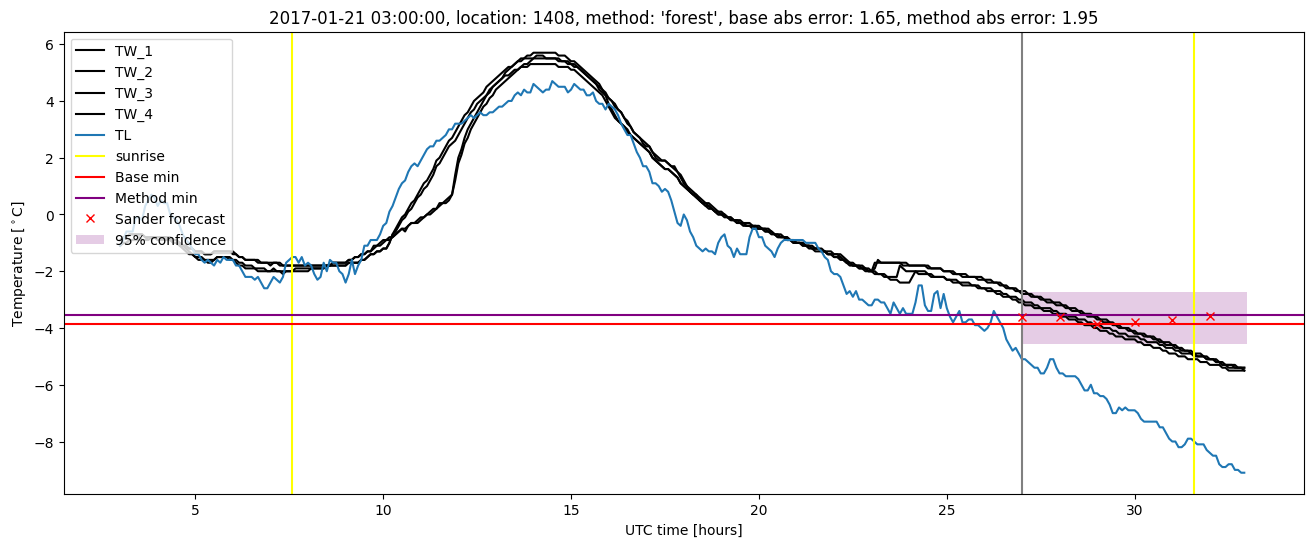
Random forest plots
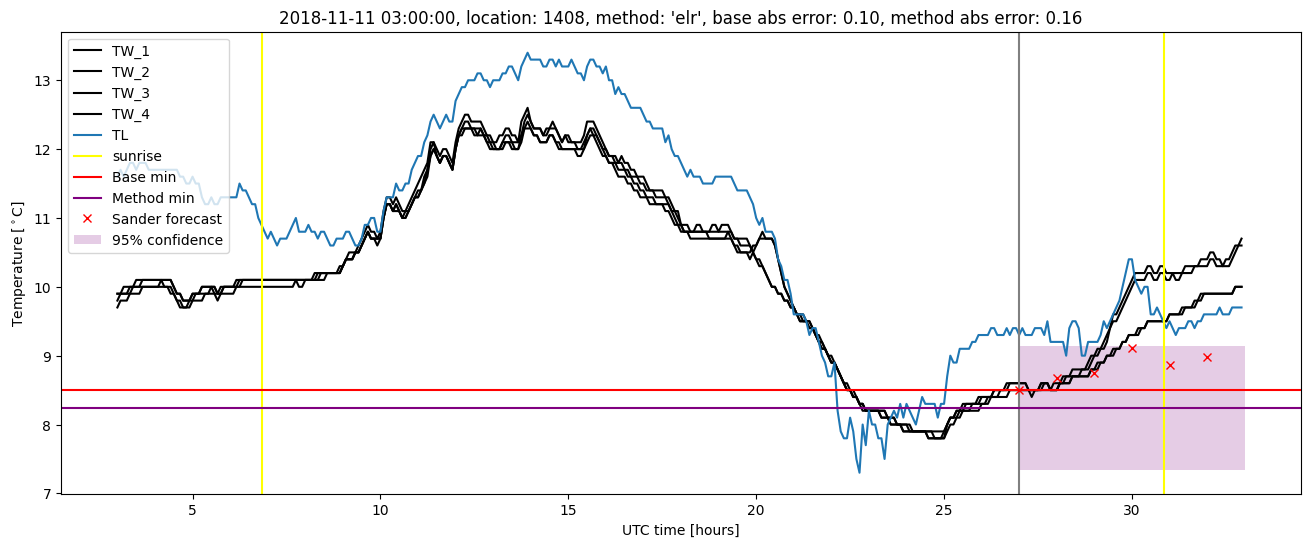
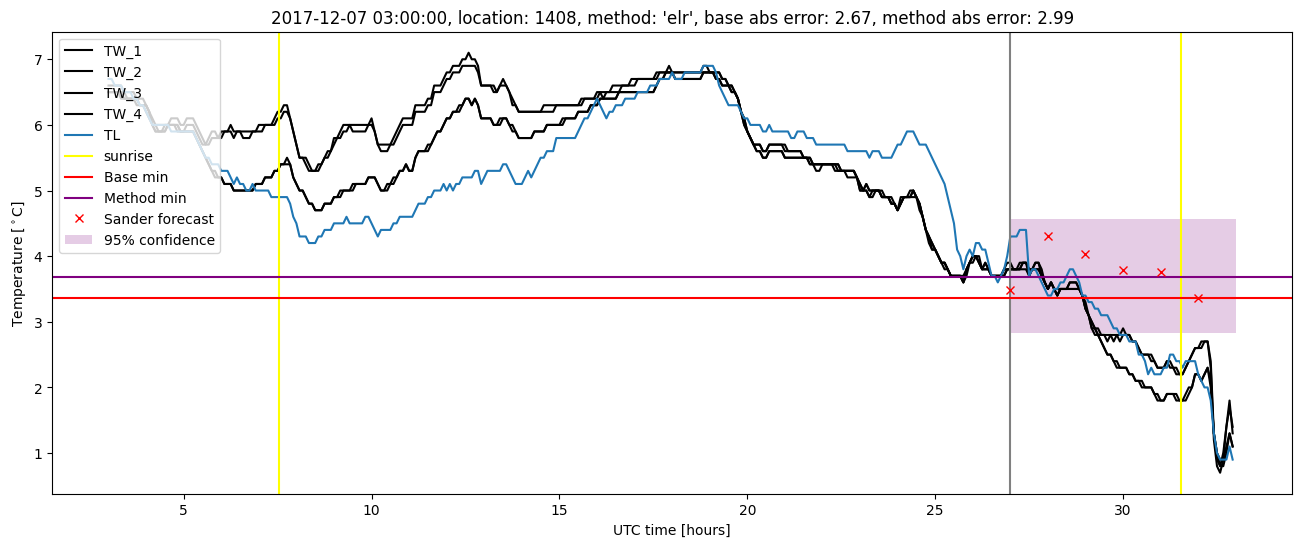
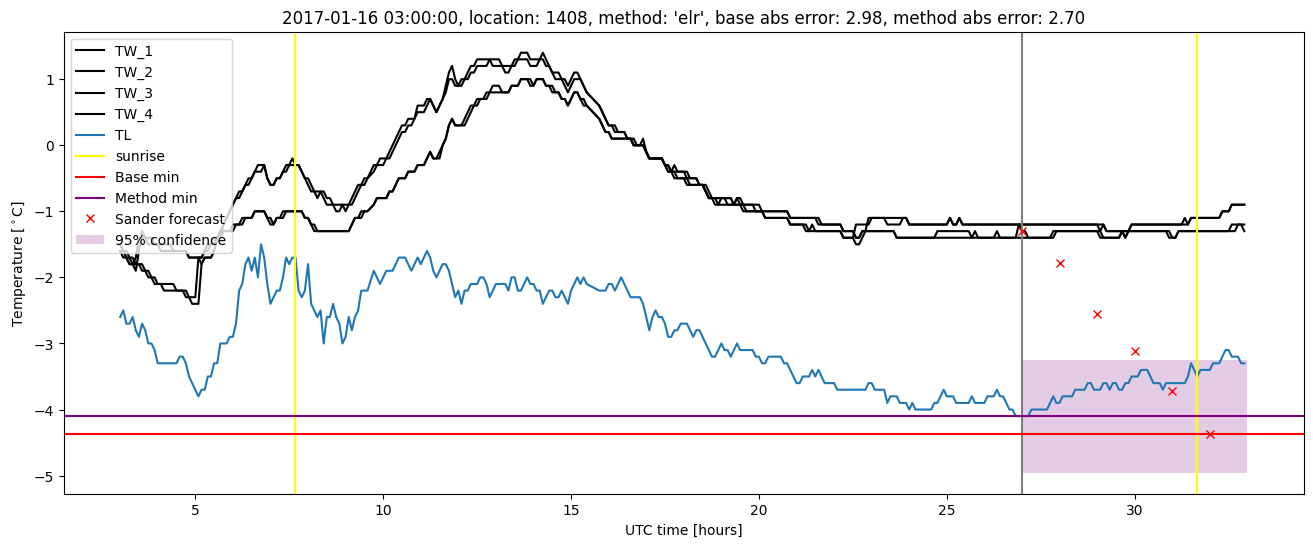
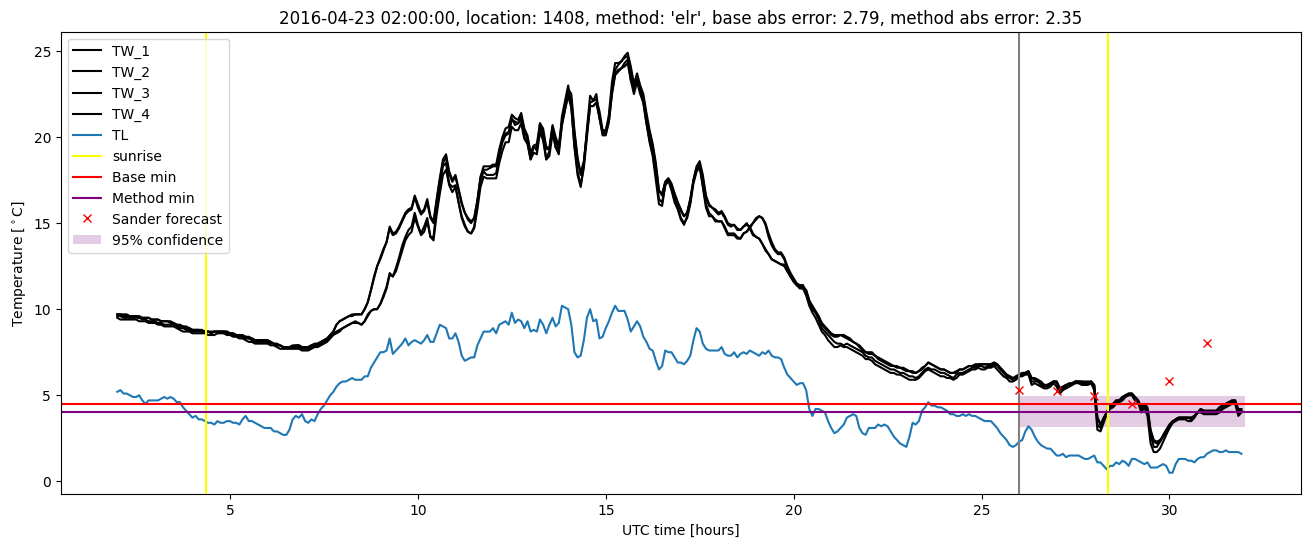
Extended logistic regression results
| names |
period |
power |
significance |
meanSquareError |
absError |
maxError |
CRPS |
IGN |
| baseline |
winter 2016 |
0.989 |
0.103 |
0.344 |
0.425 |
2.788 |
NaN |
NaN |
| elr |
winter 2016 |
0.994 |
0.103 |
0.313 |
0.422 |
2.352 |
0.544 |
4.303 |
| baseline |
winter 2017 |
0.973 |
0.105 |
0.481 |
0.488 |
2.977 |
NaN |
NaN |
| elr |
winter 2017 |
0.991 |
0.079 |
0.423 |
0.451 |
2.704 |
0.494 |
3.997 |
| baseline |
winter 2018 |
1.000 |
0.105 |
0.356 |
0.435 |
2.668 |
NaN |
NaN |
| elr |
winter 2018 |
0.993 |
0.079 |
0.421 |
0.494 |
2.988 |
0.600 |
5.396 |
| baseline |
winter 2019 |
0.986 |
0.000e+00 |
0.331 |
0.427 |
1.698 |
NaN |
NaN |
| elr |
winter 2019 |
0.986 |
0.000e+00 |
0.282 |
0.402 |
1.497 |
0.608 |
4.811 |
| baseline |
all |
0.988 |
0.093 |
0.374 |
0.442 |
2.977 |
NaN |
NaN |
| elr |
all |
0.991 |
0.076 |
0.358 |
0.443 |
2.988 |
0.562 |
4.634 |
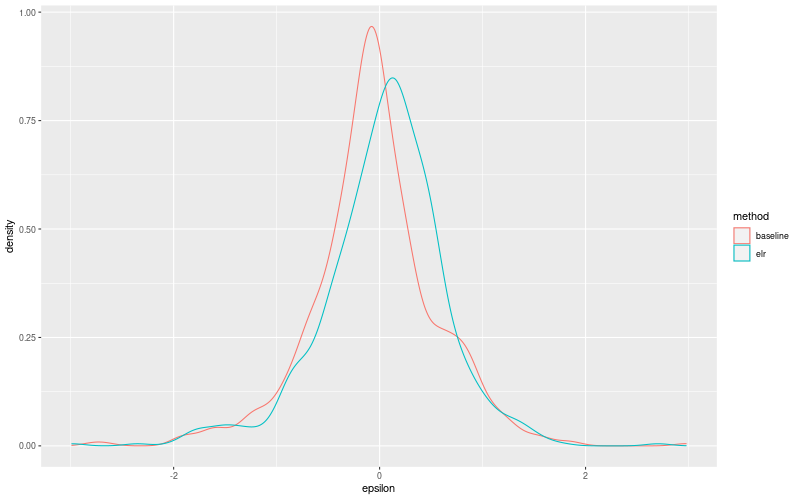
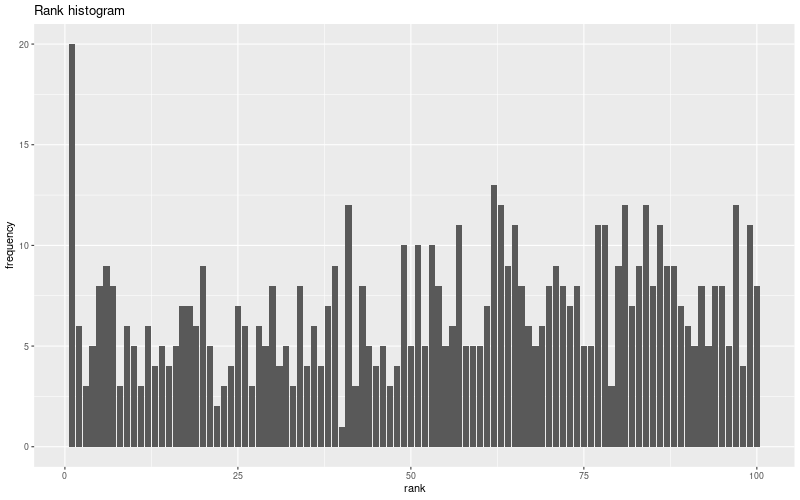
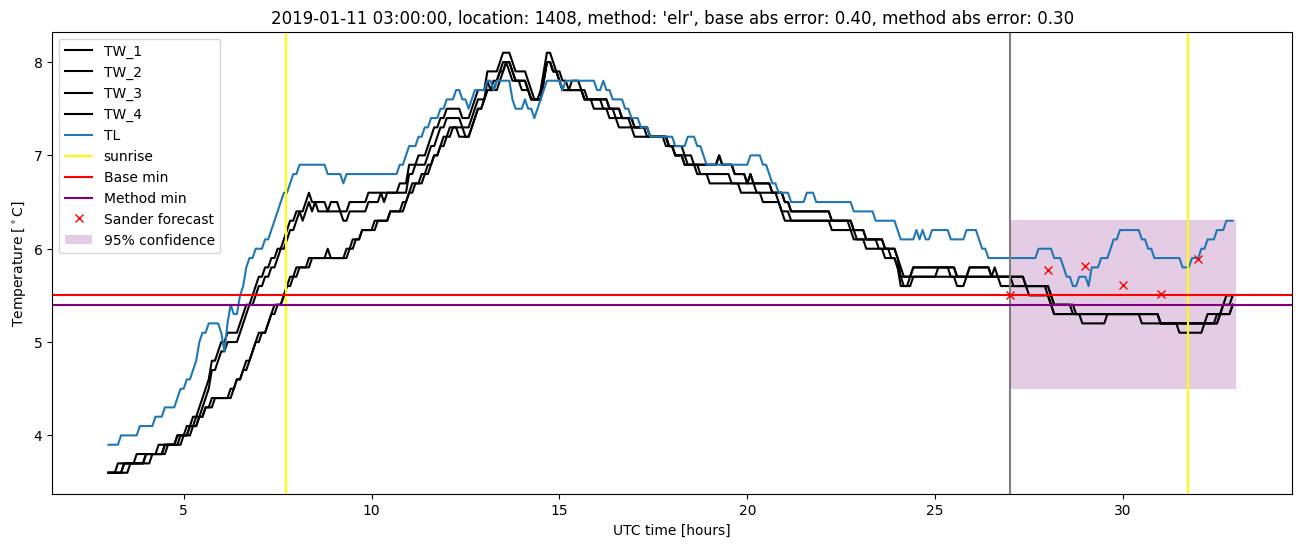
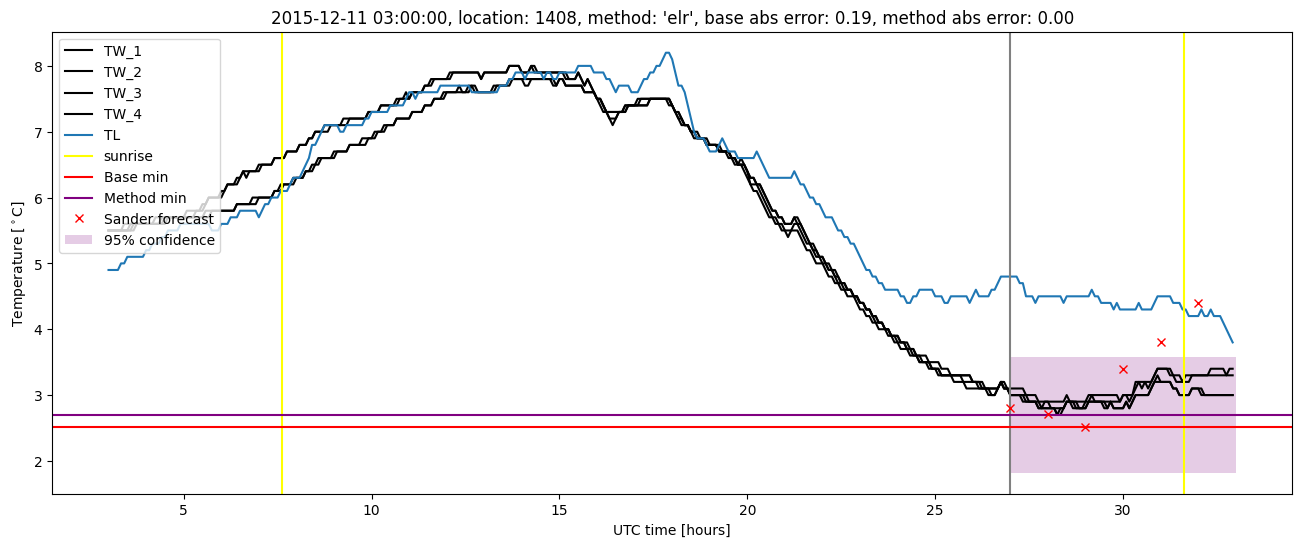
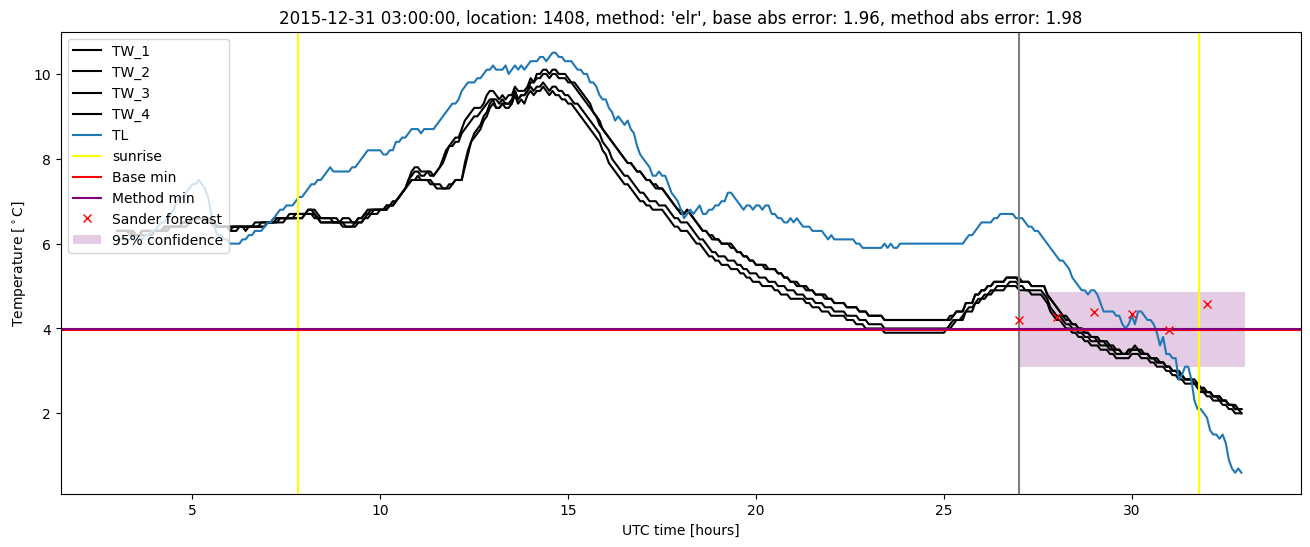
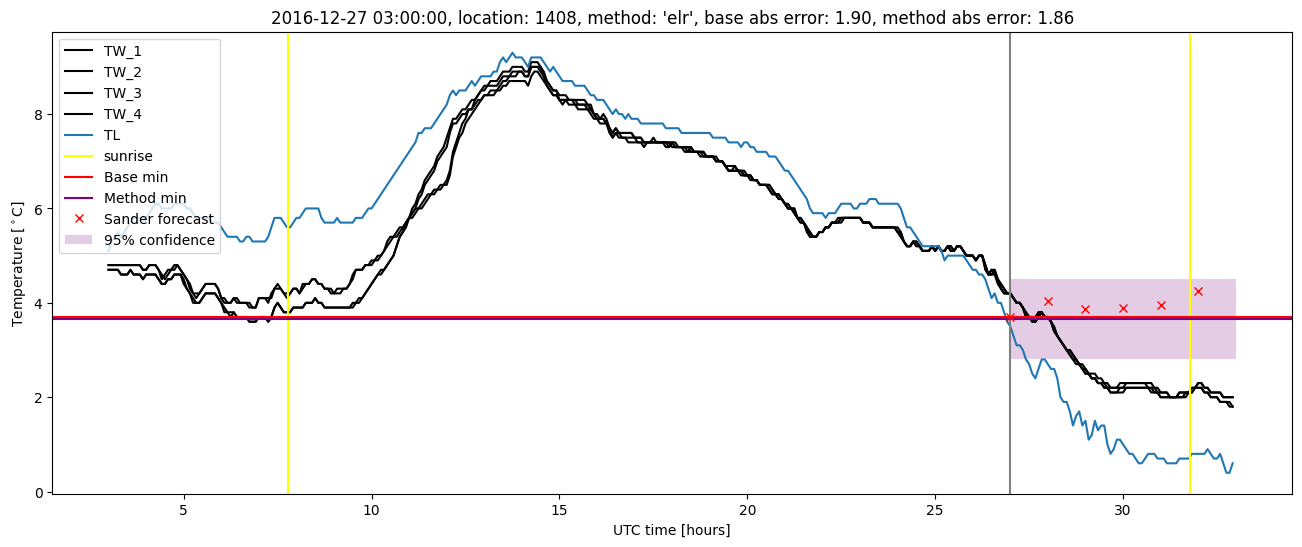
Extended logistic regression plots