GMS location: 1407
Random forest results
| names |
period |
power |
significance |
meanSquareError |
absError |
maxError |
CRPS |
IGN |
| baseline |
winter 2016 |
0.983 |
0.069 |
0.339 |
0.436 |
2.184 |
NaN |
NaN |
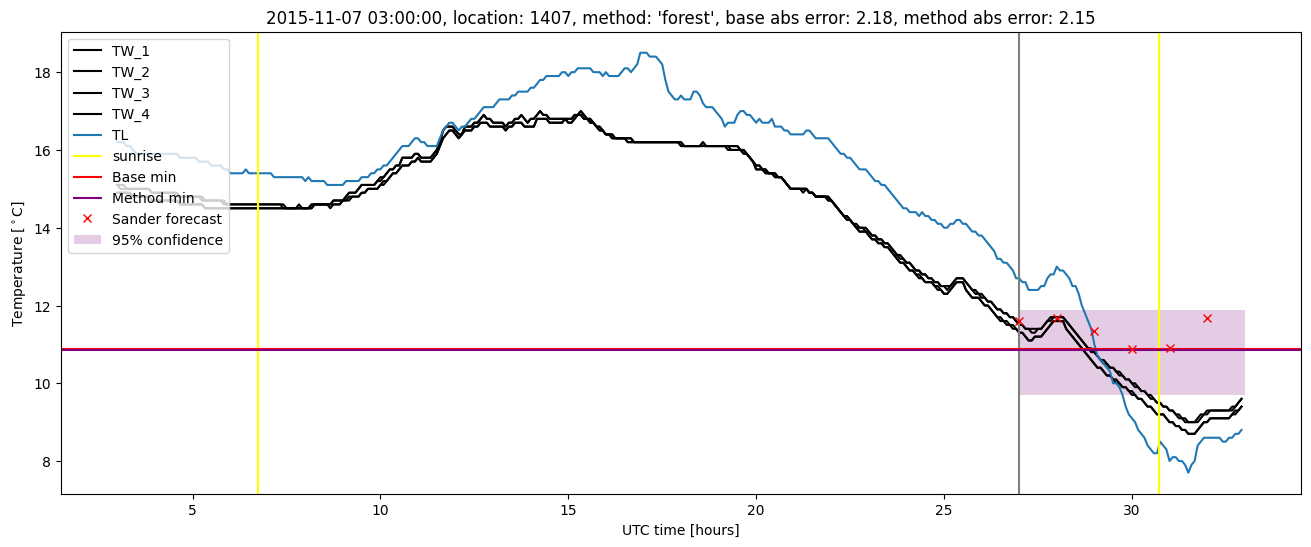
| forest |
winter 2016 |
1.000 |
0.035 |
0.299 |
0.403 |
2.148 |
0.449 |
5.822 |
| baseline |
winter 2017 |
0.991 |
0.053 |
0.396 |
0.465 |
2.779 |
NaN |
NaN |
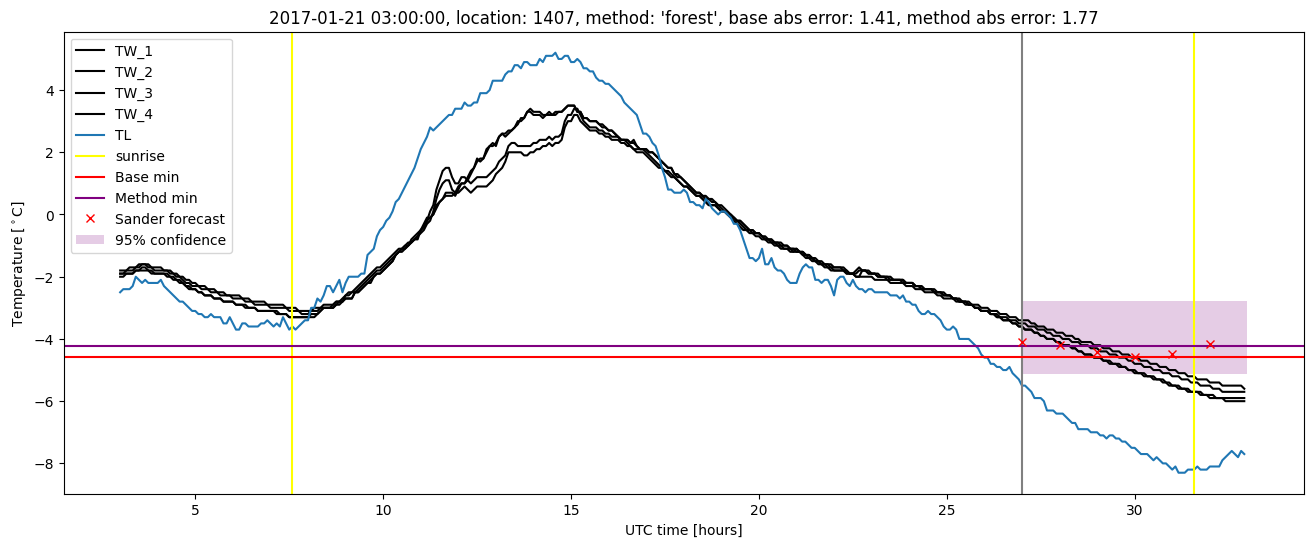
| forest |
winter 2017 |
0.991 |
0.053 |
0.345 |
0.439 |
2.235 |
0.446 |
5.234 |
| baseline |
winter 2018 |
0.993 |
0.147 |
0.355 |
0.455 |
1.780 |
NaN |
NaN |
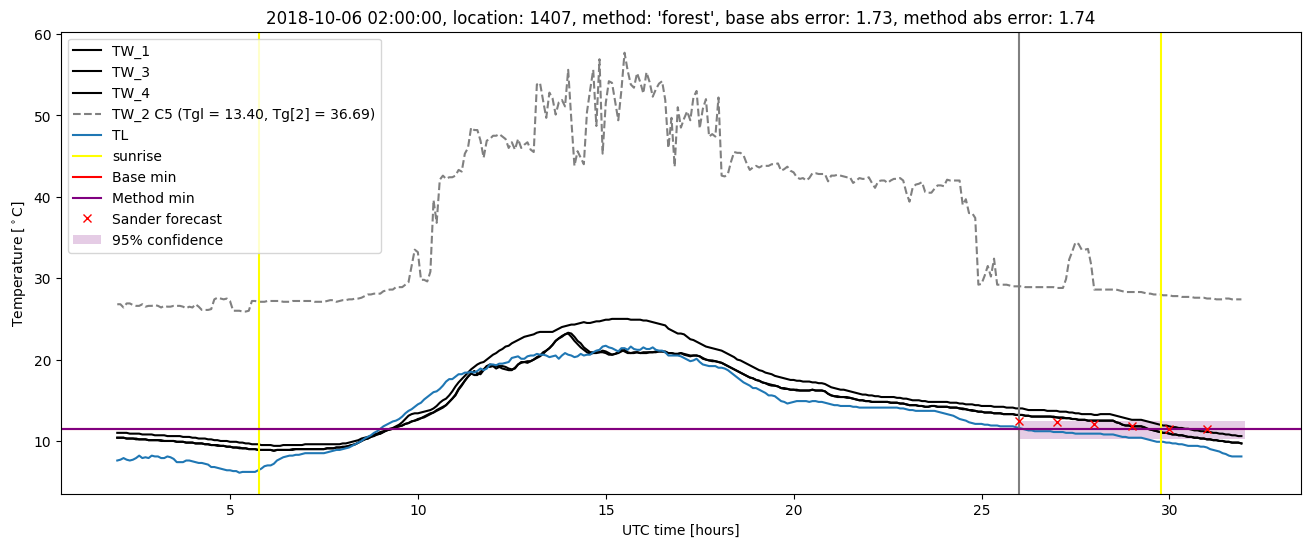
| forest |
winter 2018 |
1.000 |
0.147 |
0.282 |
0.406 |
1.637 |
0.454 |
4.739 |
| baseline |
winter 2019 |
0.985 |
0.000e+00 |
0.349 |
0.432 |
1.799 |
NaN |
NaN |
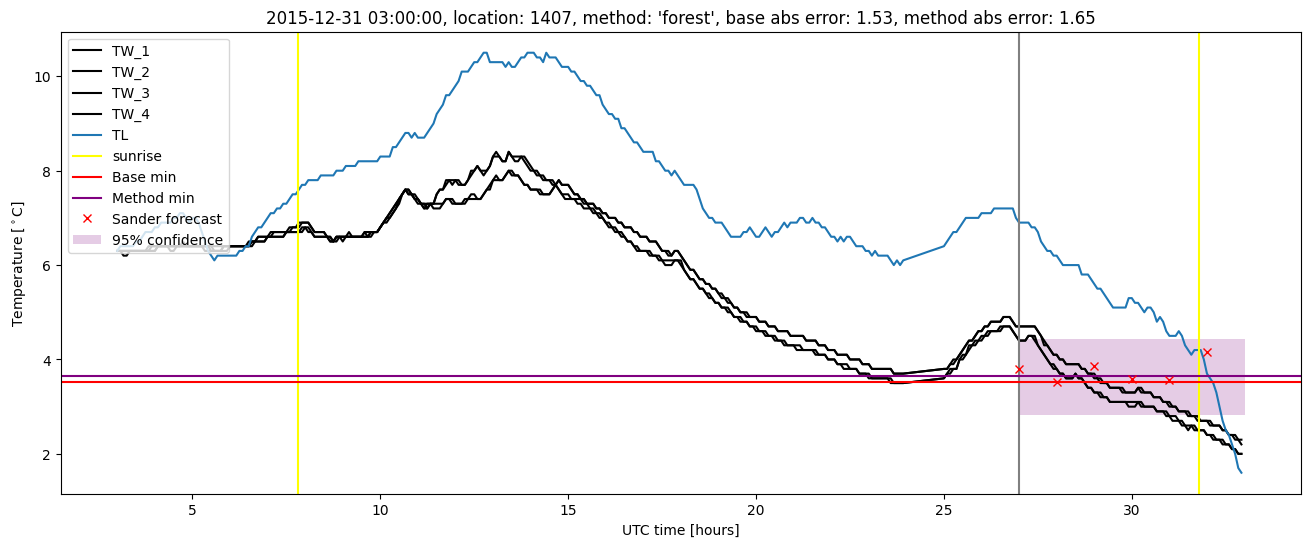
| forest |
winter 2019 |
0.985 |
0.000e+00 |
0.278 |
0.388 |
1.744 |
0.452 |
4.530 |
| baseline |
all |
0.987 |
0.080 |
0.358 |
0.446 |
2.779 |
NaN |
NaN |
| forest |
all |
0.995 |
0.071 |
0.300 |
0.409 |
2.235 |
0.450 |
5.137 |
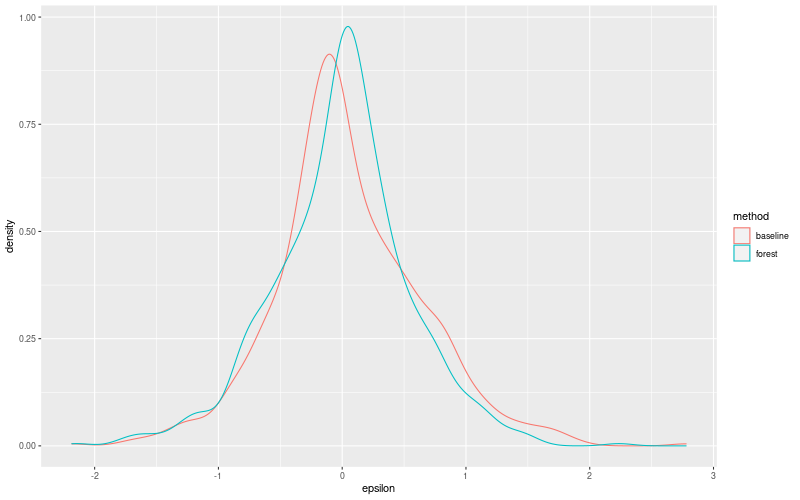
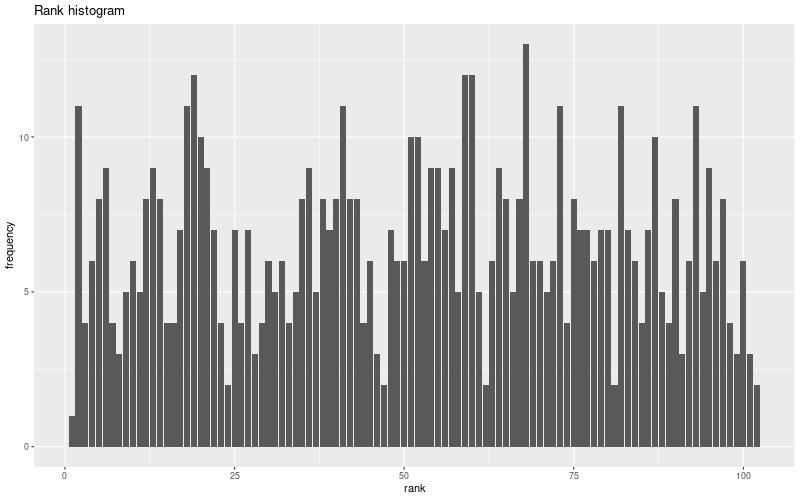
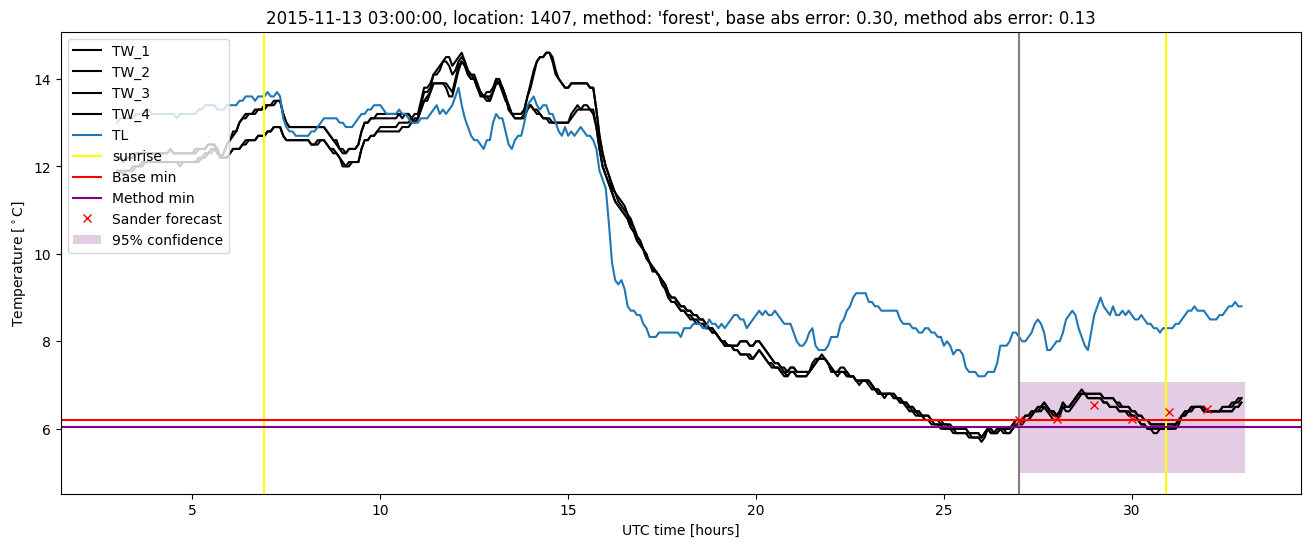
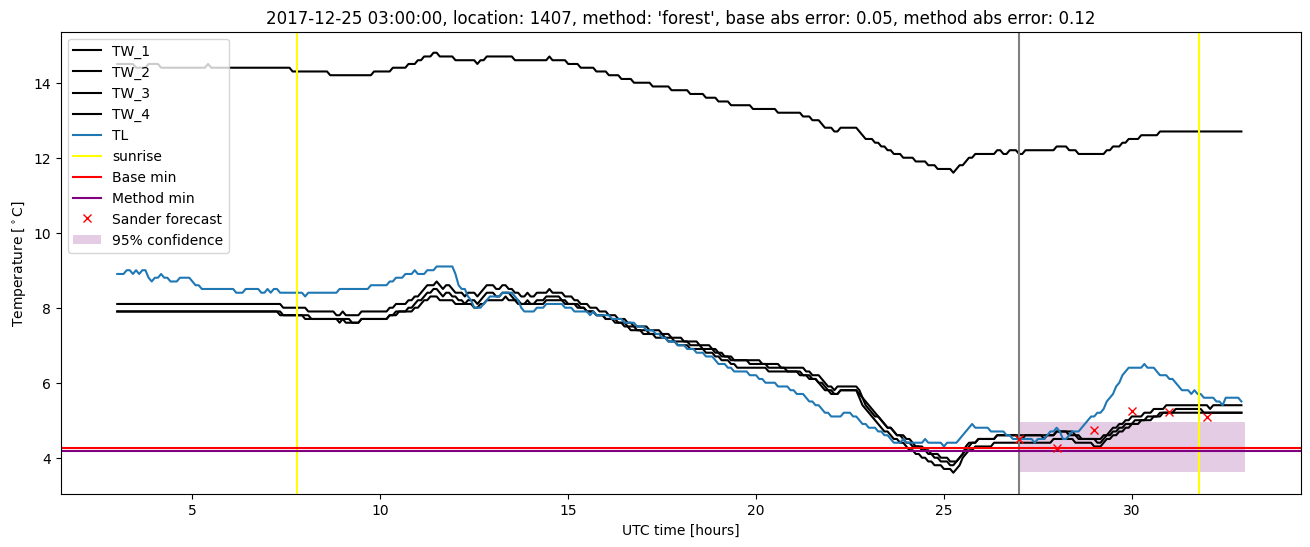
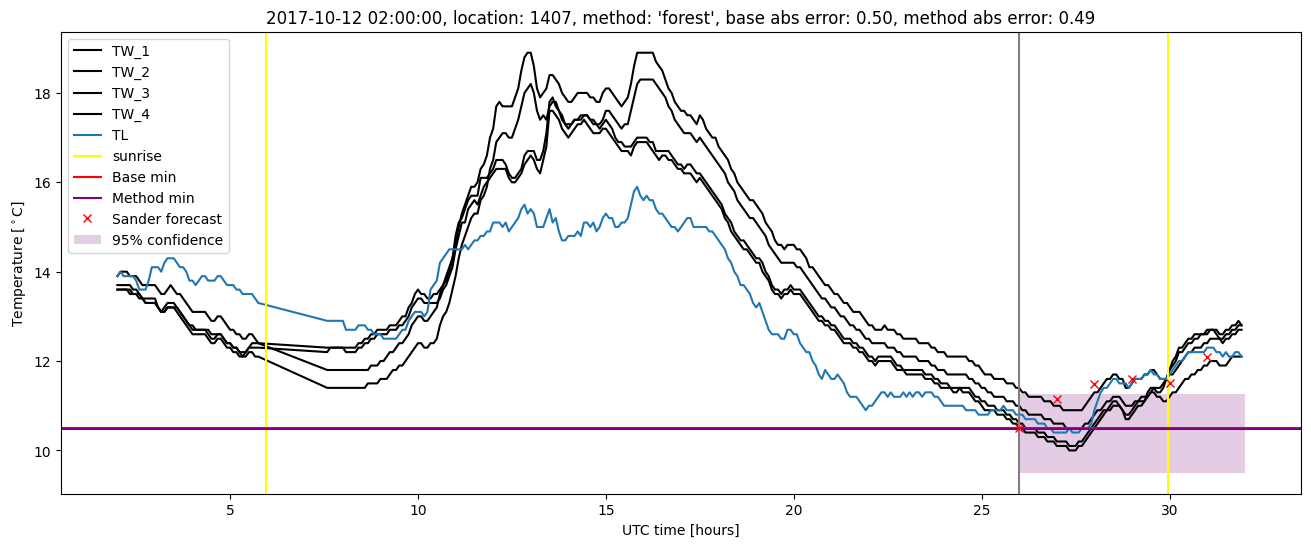
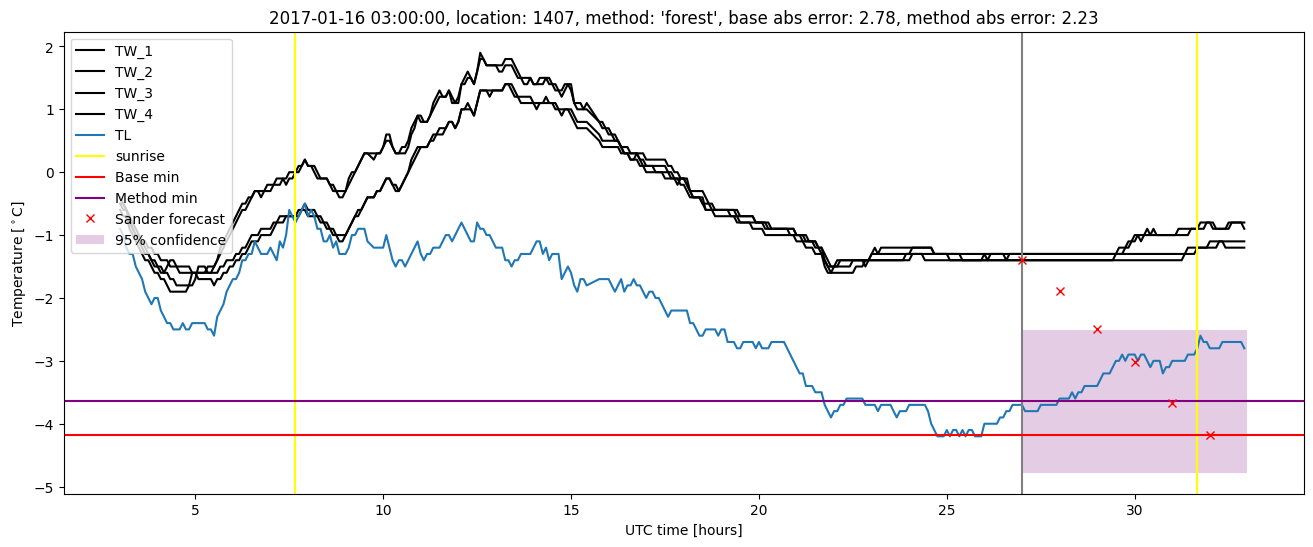
Random forest plots
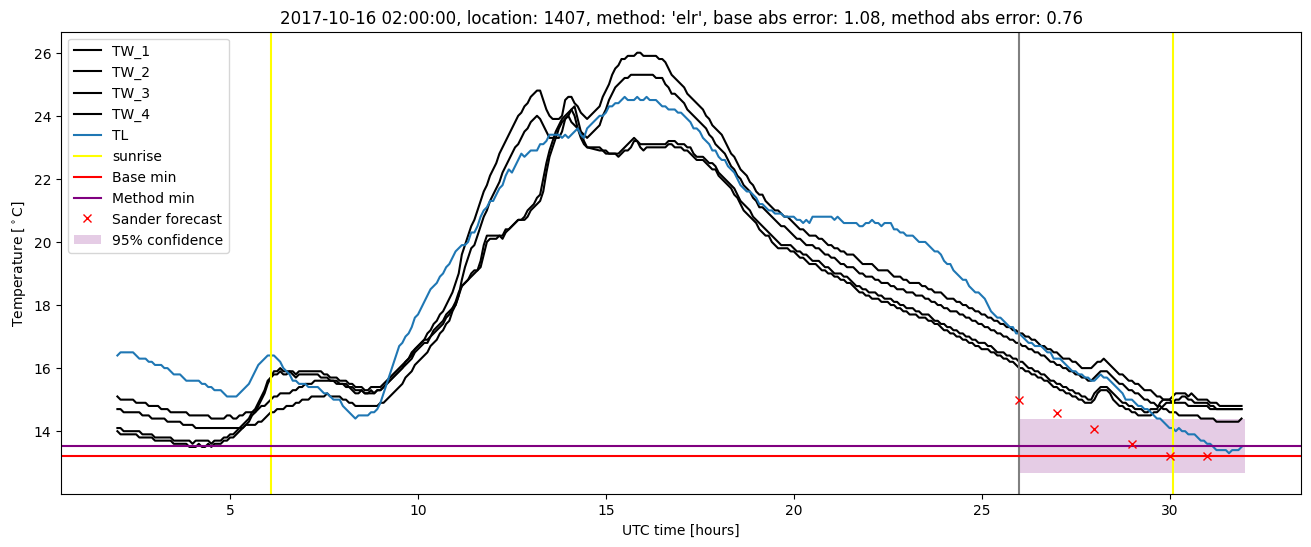
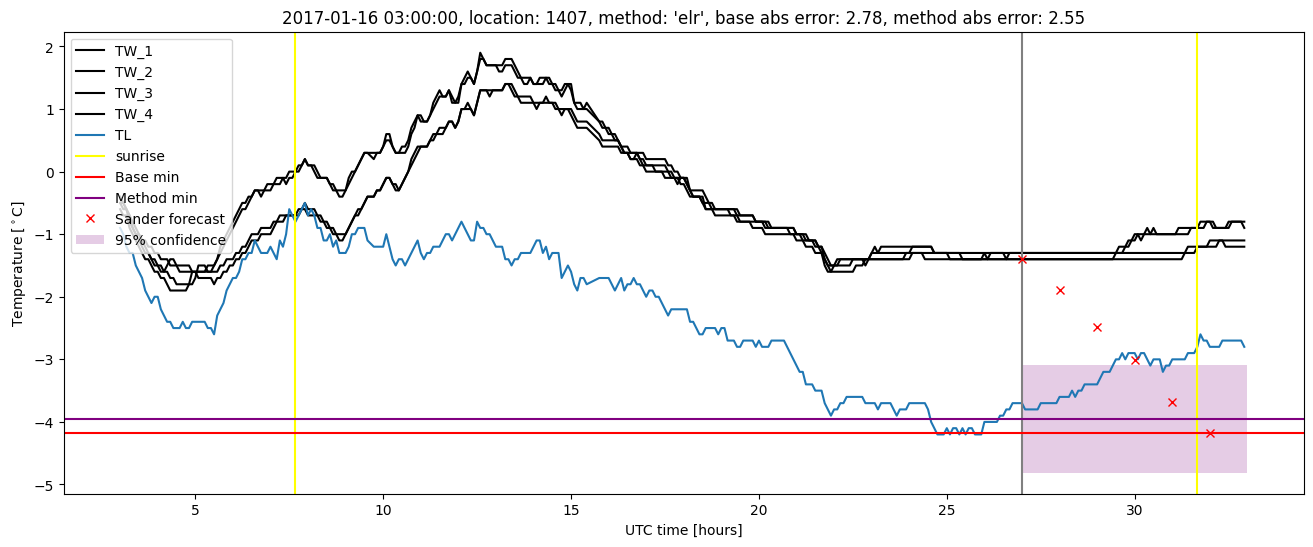
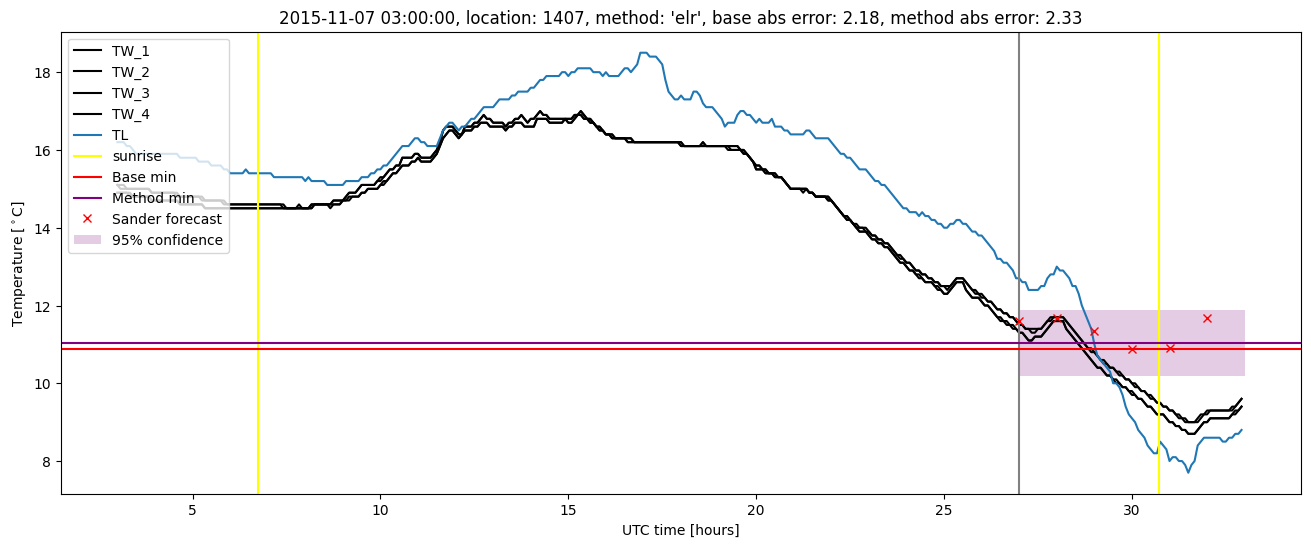
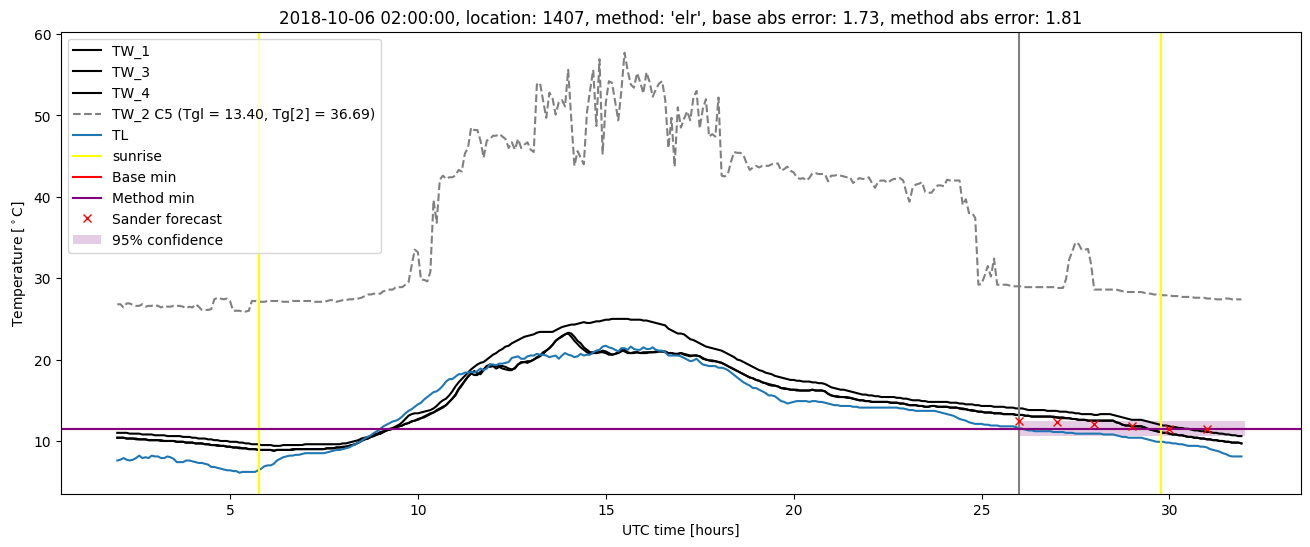
Extended logistic regression results
| names |
period |
power |
significance |
meanSquareError |
absError |
maxError |
CRPS |
IGN |
| baseline |
winter 2016 |
0.983 |
0.069 |
0.339 |
0.436 |
2.184 |
NaN |
NaN |
| elr |
winter 2016 |
0.989 |
0.103 |
0.338 |
0.429 |
2.329 |
0.509 |
4.256 |
| baseline |
winter 2017 |
0.991 |
0.053 |
0.396 |
0.465 |
2.779 |
NaN |
NaN |
| elr |
winter 2017 |
0.991 |
0.026 |
0.349 |
0.456 |
2.554 |
0.506 |
4.117 |
| baseline |
winter 2018 |
0.993 |
0.147 |
0.355 |
0.455 |
1.780 |
NaN |
NaN |
| elr |
winter 2018 |
1.000 |
0.147 |
0.311 |
0.432 |
1.733 |
0.526 |
4.472 |
| baseline |
winter 2019 |
0.985 |
0.000e+00 |
0.349 |
0.432 |
1.799 |
NaN |
NaN |
| elr |
winter 2019 |
0.985 |
0.000e+00 |
0.282 |
0.393 |
1.814 |
0.514 |
3.892 |
| baseline |
all |
0.987 |
0.080 |
0.358 |
0.446 |
2.779 |
NaN |
NaN |
| elr |
all |
0.991 |
0.080 |
0.321 |
0.428 |
2.554 |
0.514 |
4.199 |
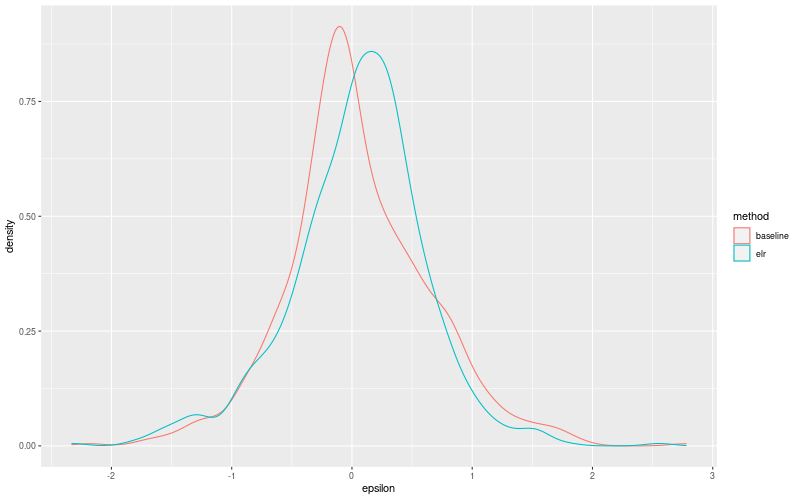
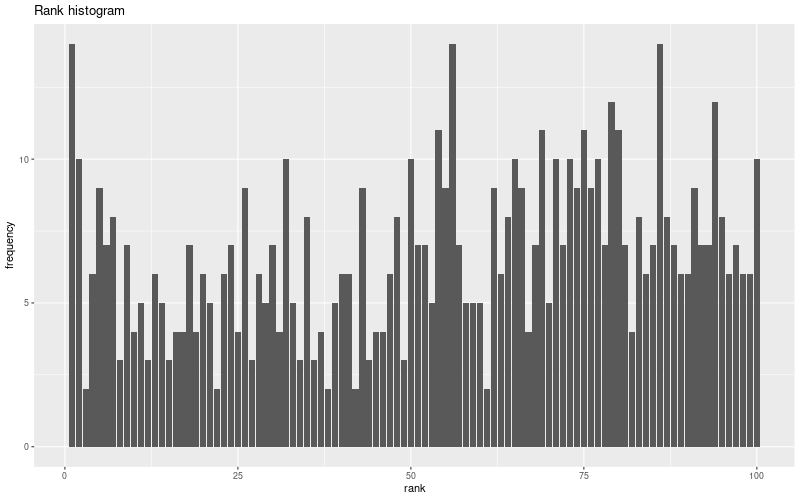
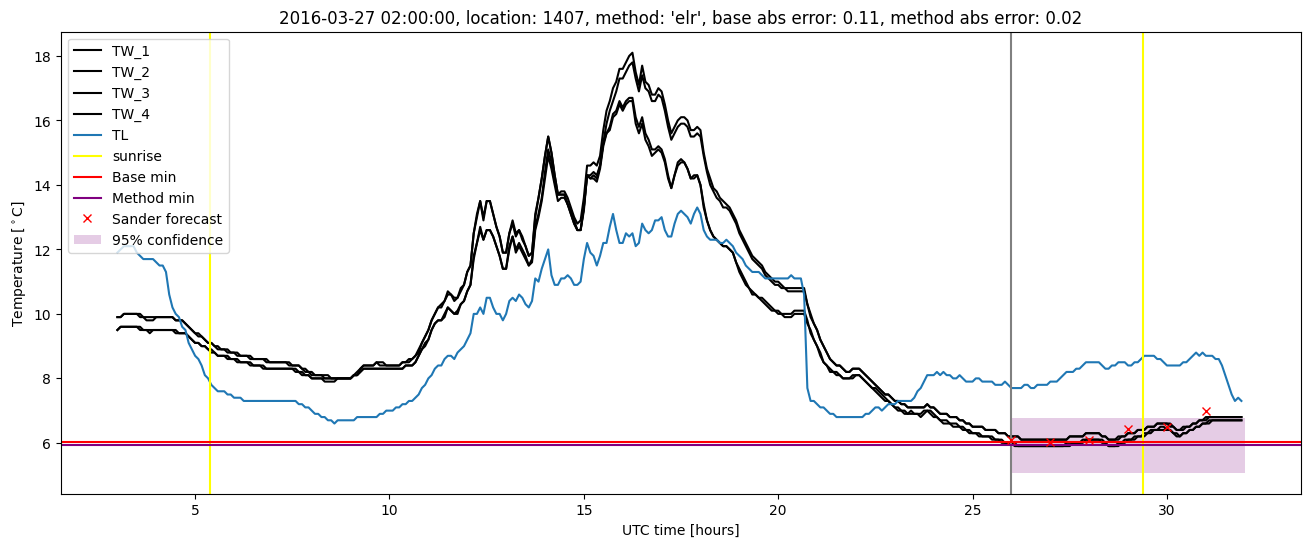
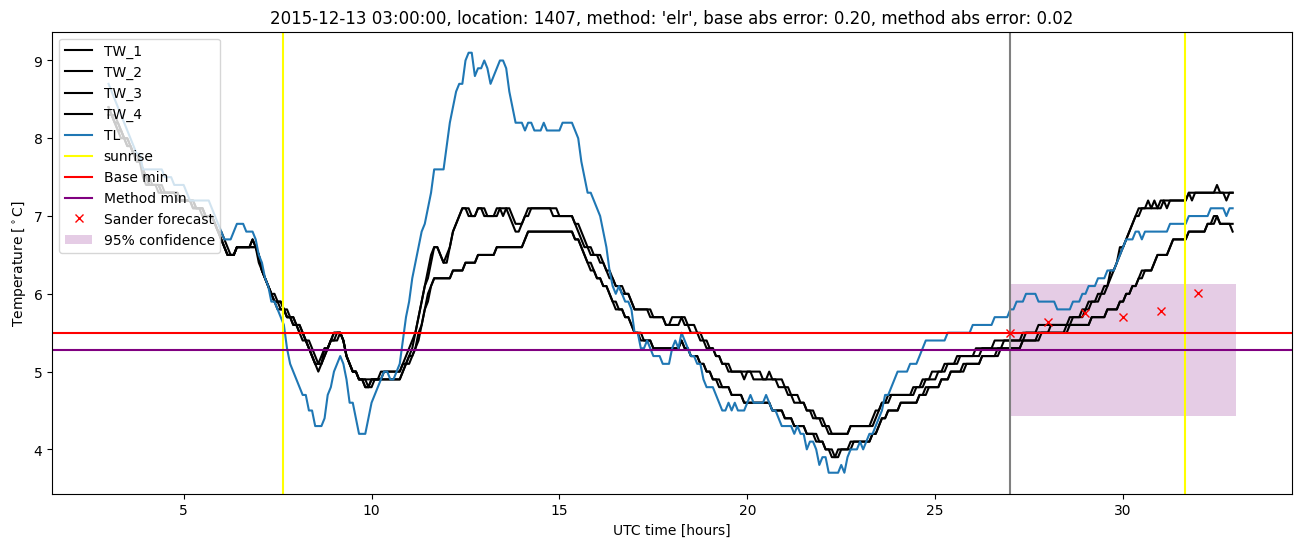
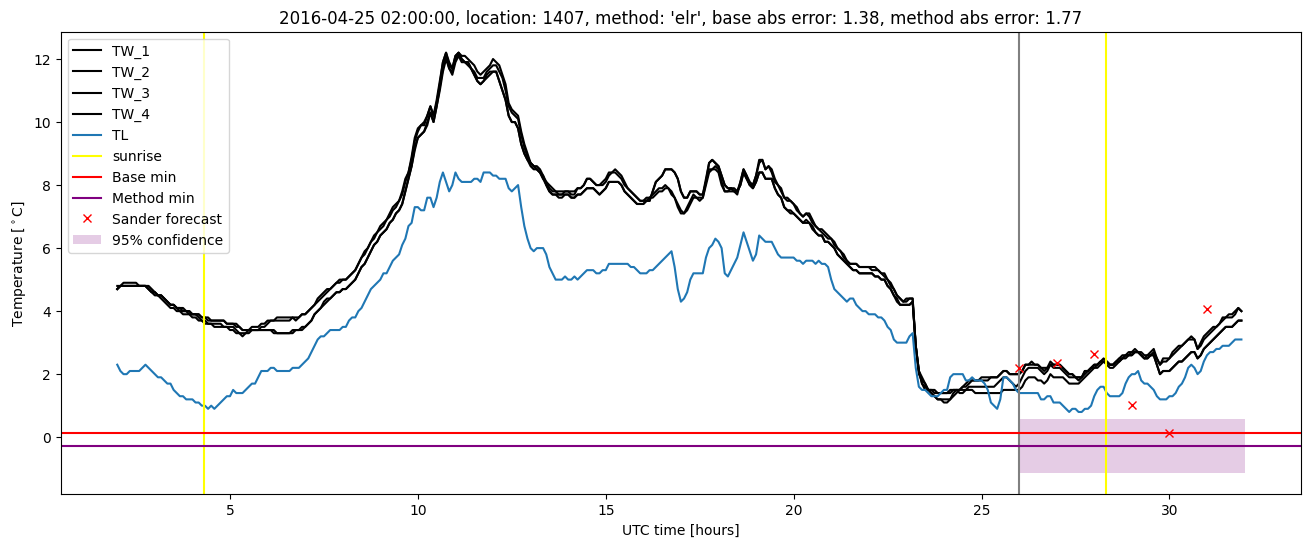
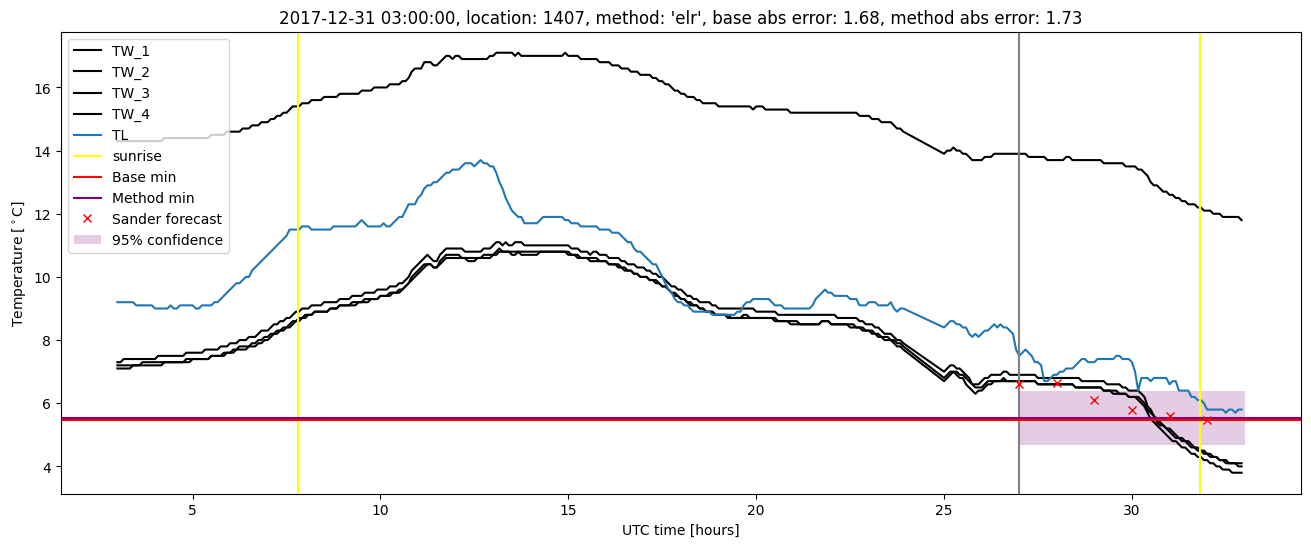
Extended logistic regression plots