GMS location: 1406
Random forest results
| names |
period |
power |
significance |
meanSquareError |
absError |
maxError |
CRPS |
IGN |
| baseline |
winter 2016 |
0.978 |
0.154 |
0.292 |
0.427 |
1.630 |
NaN |
NaN |
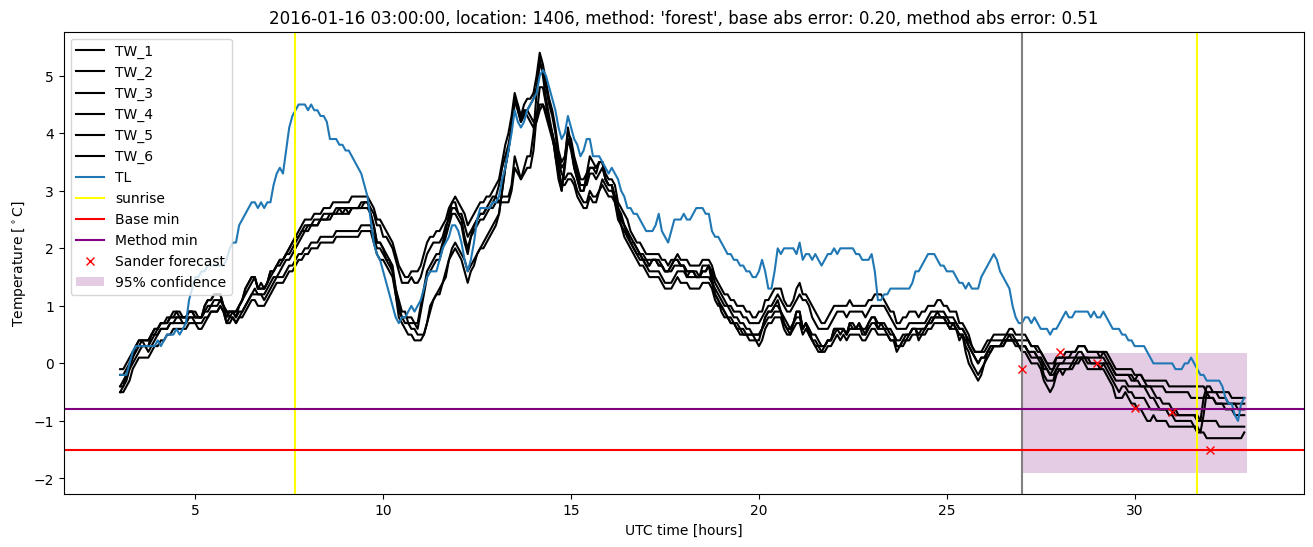
| forest |
winter 2016 |
0.994 |
0.192 |
0.234 |
0.375 |
1.346 |
0.442 |
3.696 |
| baseline |
winter 2017 |
0.982 |
0.026 |
0.417 |
0.475 |
3.000 |
NaN |
NaN |
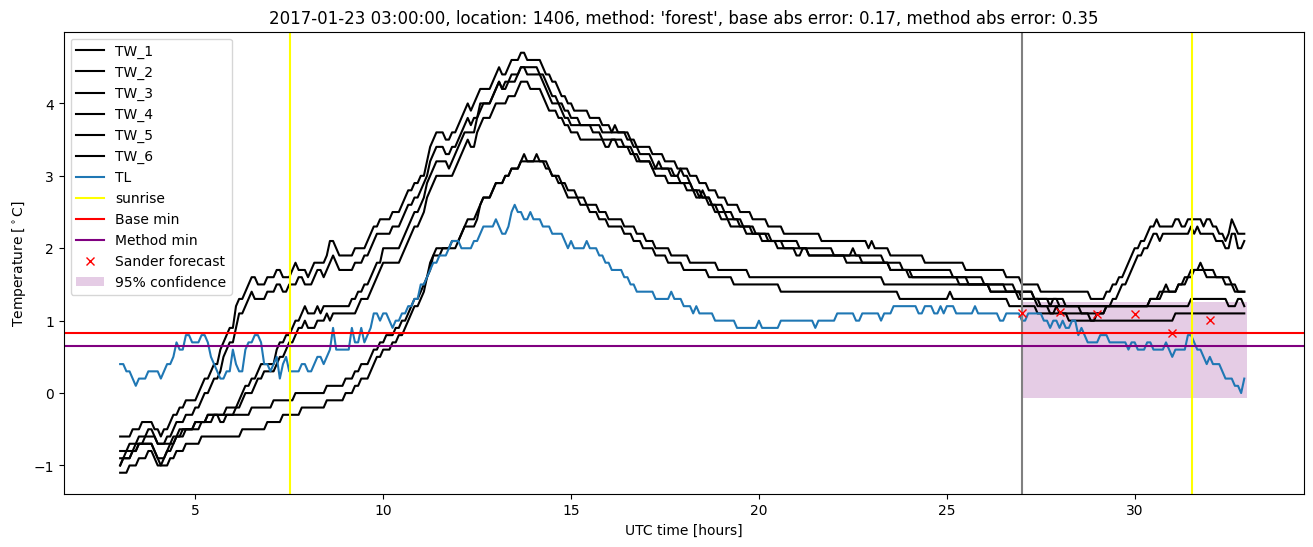
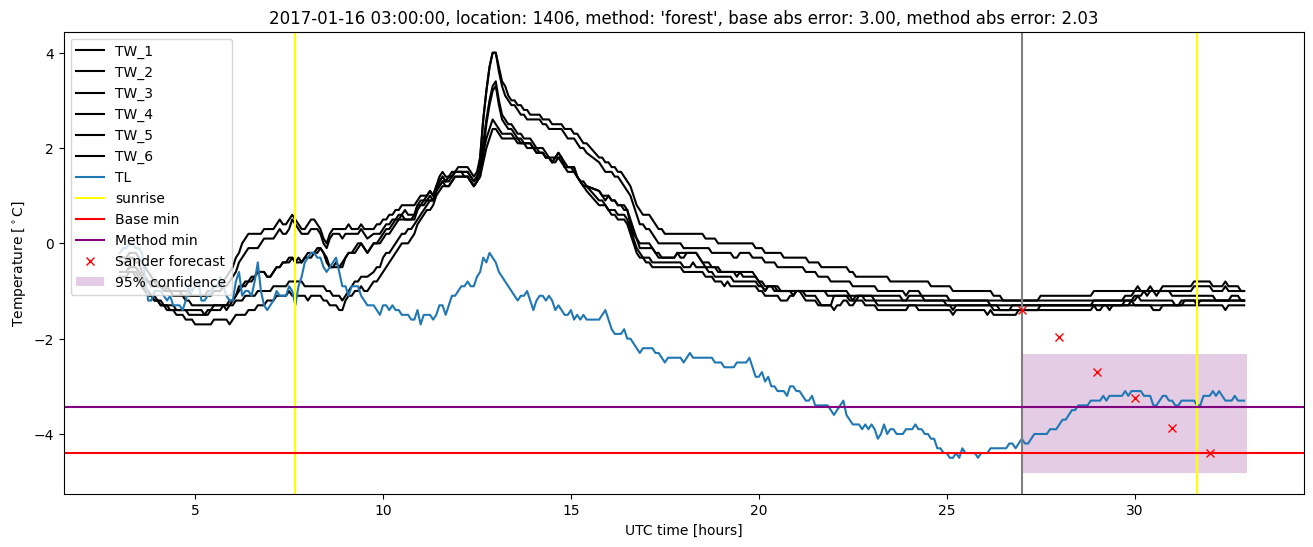
| forest |
winter 2017 |
0.991 |
0.051 |
0.302 |
0.405 |
2.034 |
0.453 |
5.107 |
| baseline |
winter 2018 |
0.992 |
0.097 |
0.394 |
0.481 |
2.085 |
NaN |
NaN |
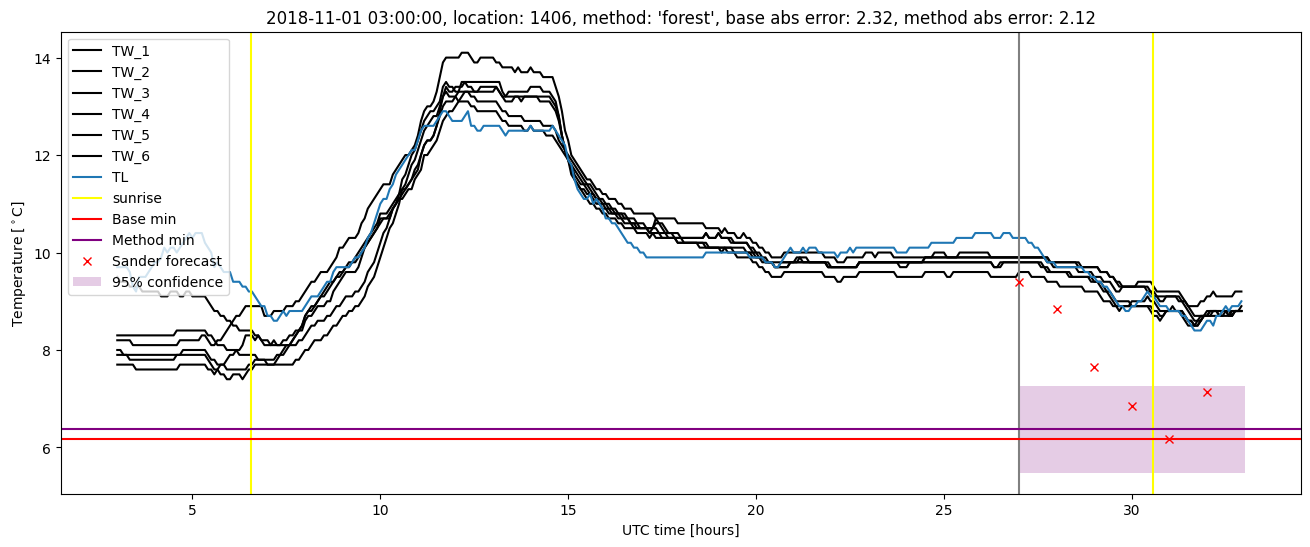
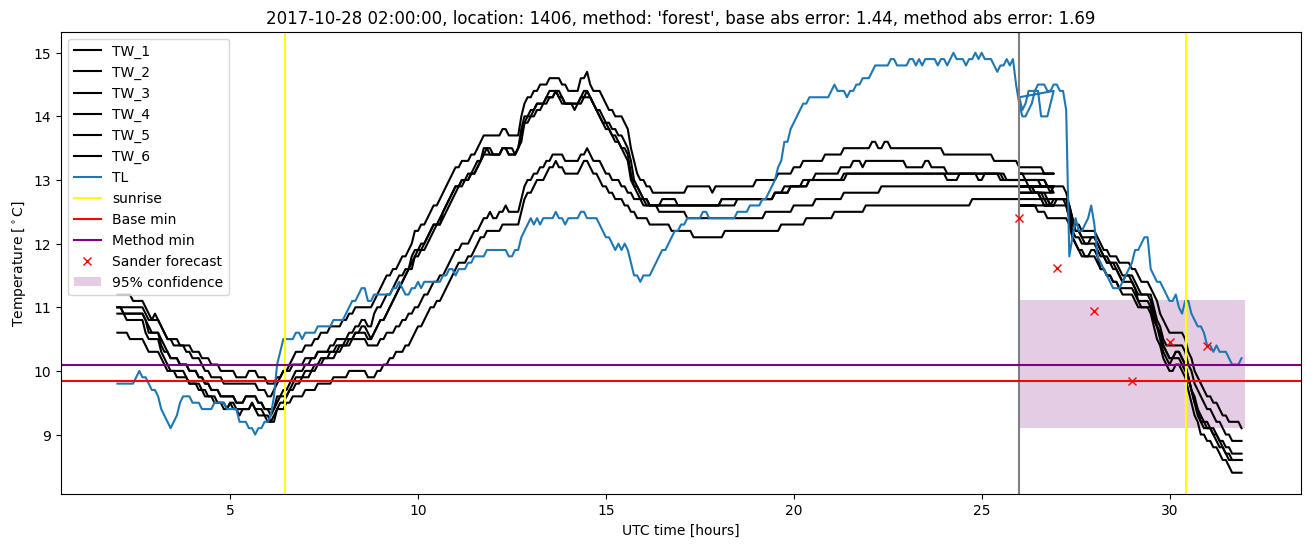
| forest |
winter 2018 |
0.992 |
0.129 |
0.315 |
0.436 |
1.692 |
0.445 |
3.587 |
| baseline |
winter 2019 |
0.985 |
0.077 |
0.384 |
0.439 |
2.318 |
NaN |
NaN |
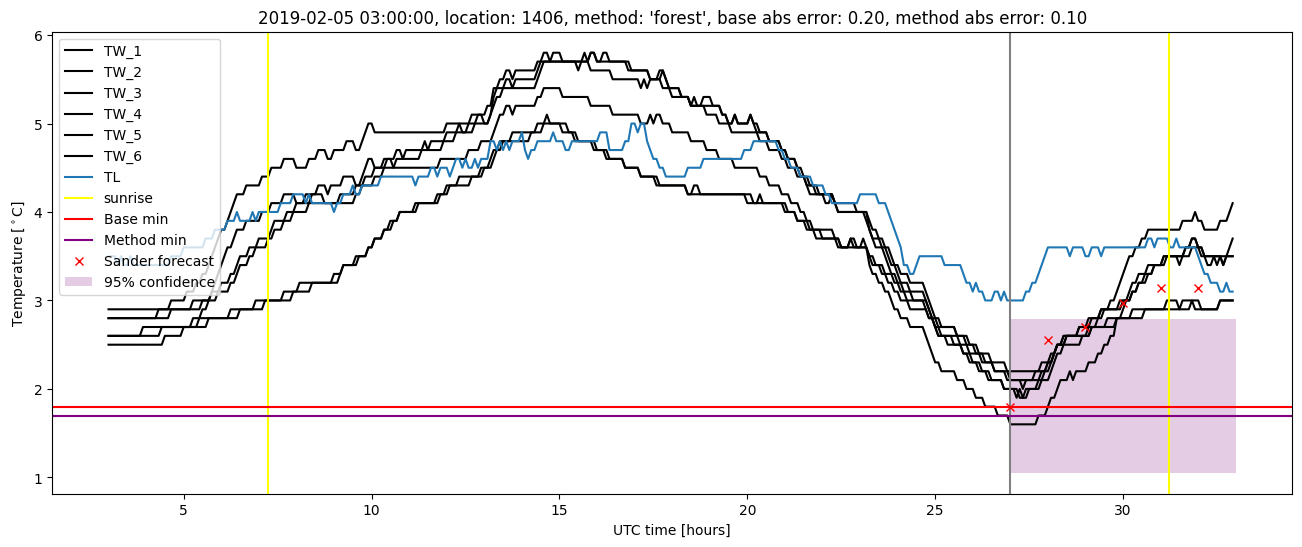
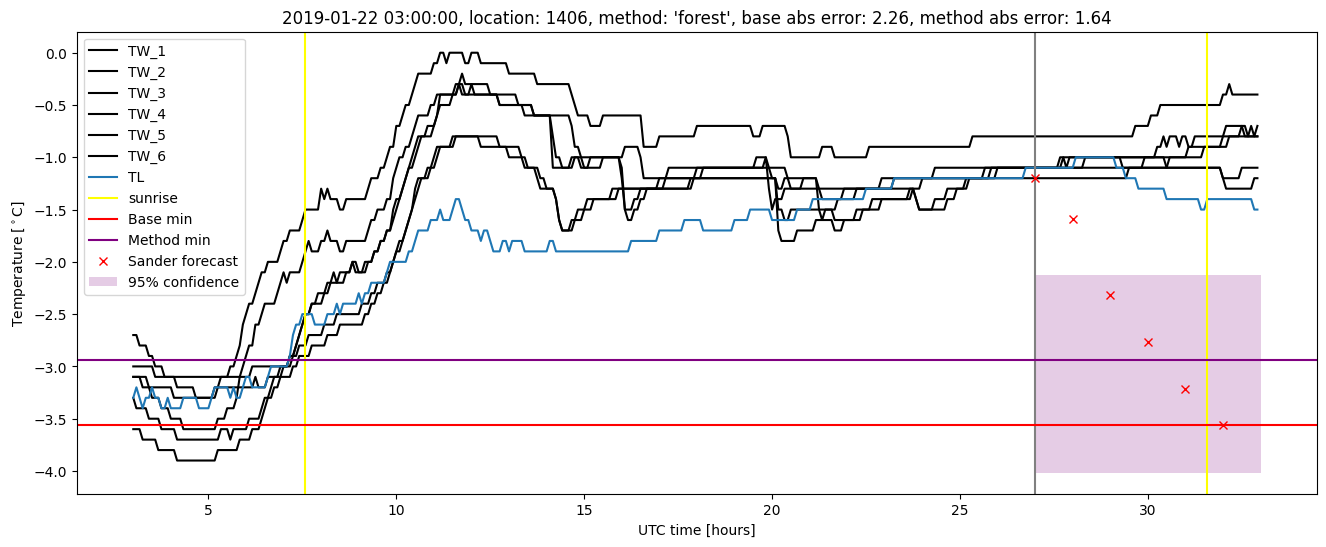
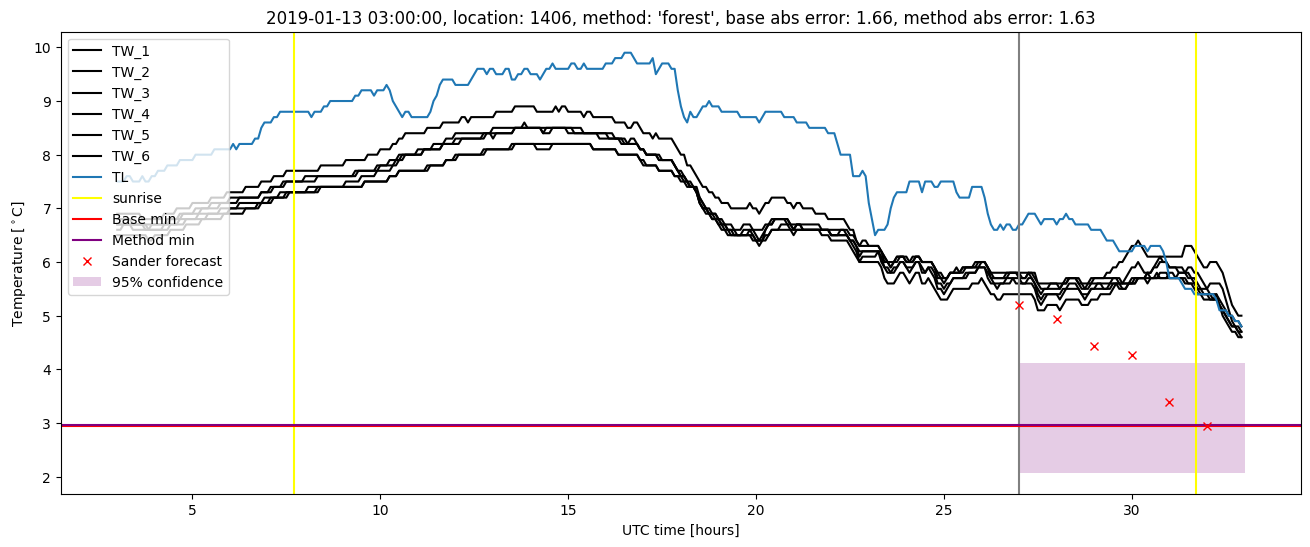
| forest |
winter 2019 |
0.985 |
0.077 |
0.283 |
0.375 |
2.122 |
0.450 |
3.969 |
| baseline |
all |
0.984 |
0.083 |
0.365 |
0.453 |
3.000 |
NaN |
NaN |
| forest |
all |
0.991 |
0.110 |
0.280 |
0.396 |
2.122 |
0.447 |
4.058 |
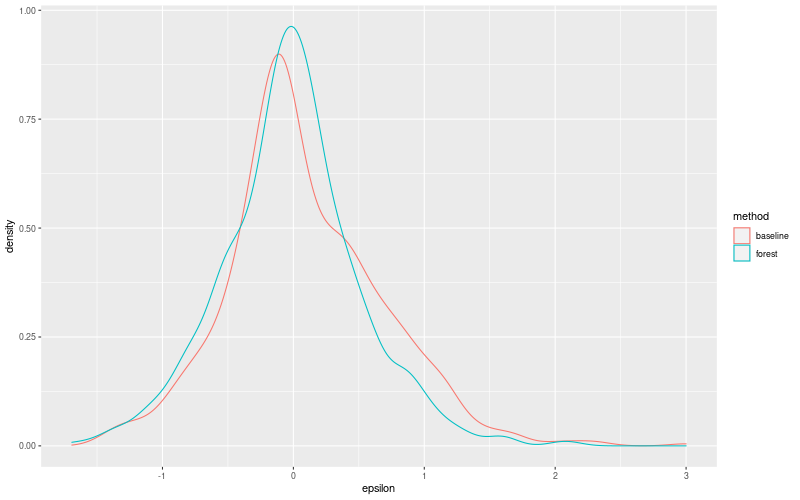
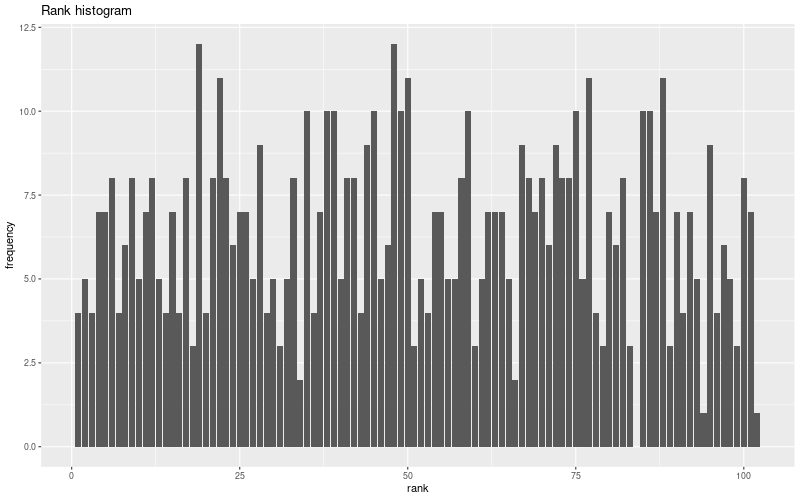
Random forest plots
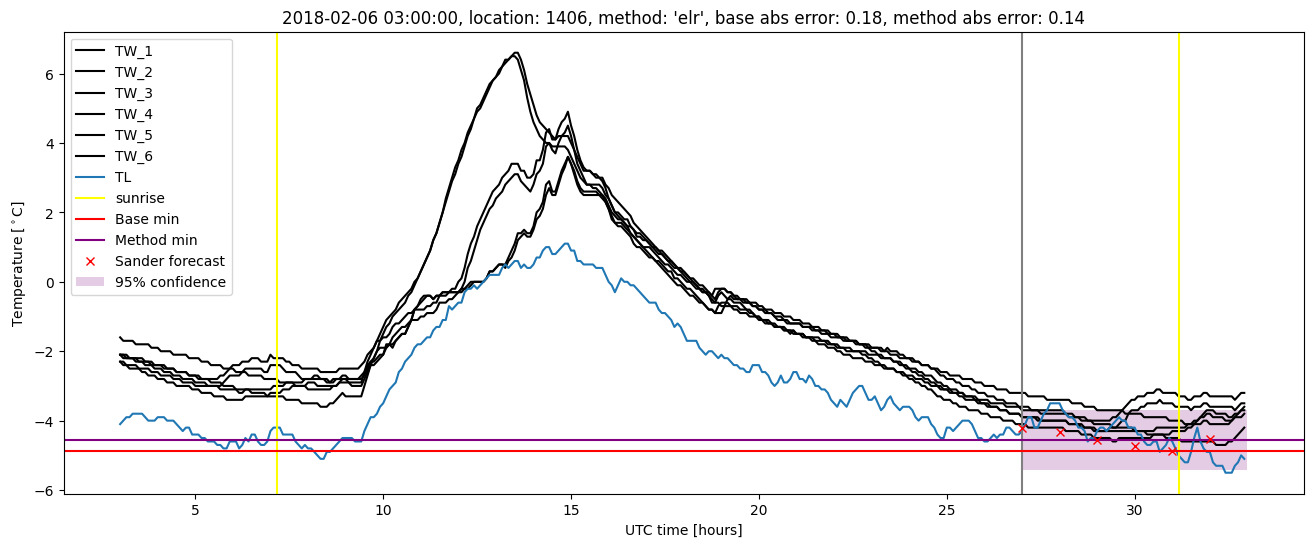
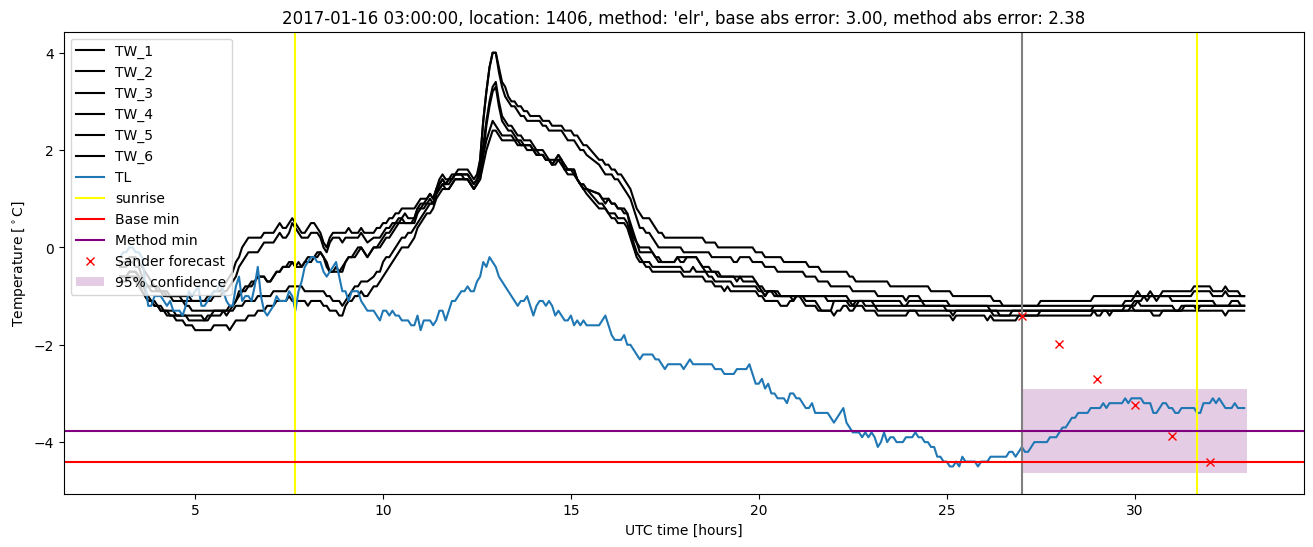
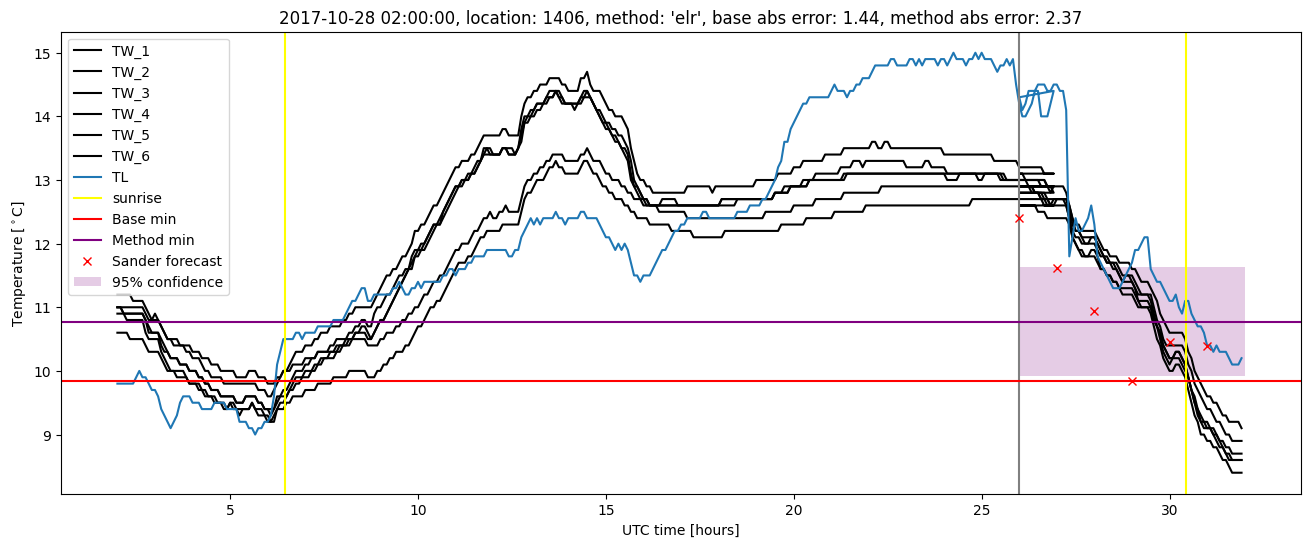
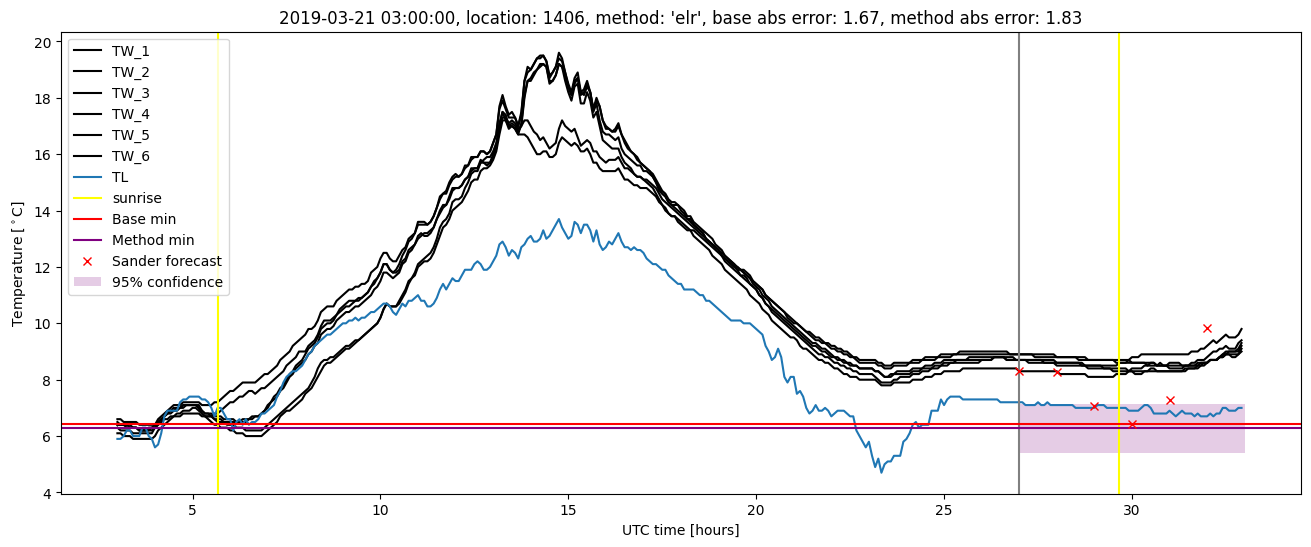
Extended logistic regression results
| names |
period |
power |
significance |
meanSquareError |
absError |
maxError |
CRPS |
IGN |
| baseline |
winter 2016 |
0.978 |
0.154 |
0.292 |
0.427 |
1.630 |
NaN |
NaN |
| elr |
winter 2016 |
0.994 |
0.115 |
0.265 |
0.418 |
1.443 |
0.516 |
3.945 |
| baseline |
winter 2017 |
0.982 |
0.026 |
0.417 |
0.475 |
3.000 |
NaN |
NaN |
| elr |
winter 2017 |
0.982 |
0.103 |
0.323 |
0.421 |
2.378 |
0.531 |
4.501 |
| baseline |
winter 2018 |
0.992 |
0.097 |
0.394 |
0.481 |
2.085 |
NaN |
NaN |
| elr |
winter 2018 |
0.984 |
0.065 |
0.333 |
0.452 |
2.369 |
0.525 |
4.338 |
| baseline |
winter 2019 |
0.985 |
0.077 |
0.384 |
0.439 |
2.318 |
NaN |
NaN |
| elr |
winter 2019 |
0.992 |
0.077 |
0.269 |
0.391 |
1.827 |
0.505 |
3.995 |
| baseline |
all |
0.984 |
0.083 |
0.365 |
0.453 |
3.000 |
NaN |
NaN |
| elr |
all |
0.989 |
0.092 |
0.295 |
0.421 |
2.378 |
0.519 |
4.177 |
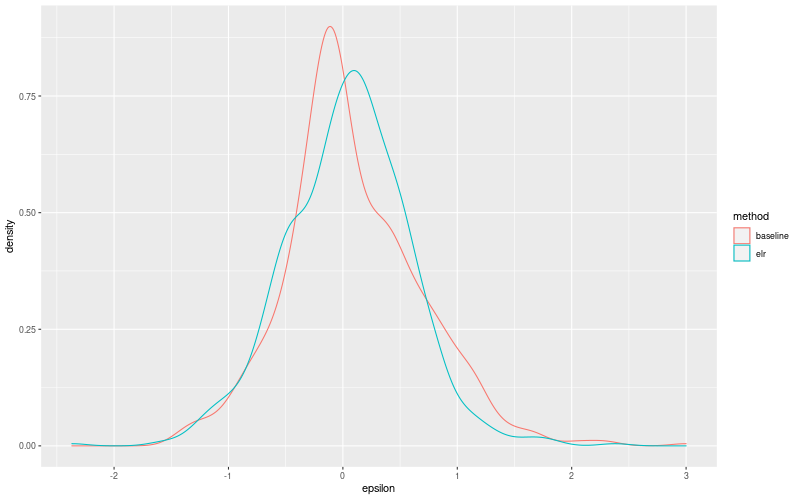
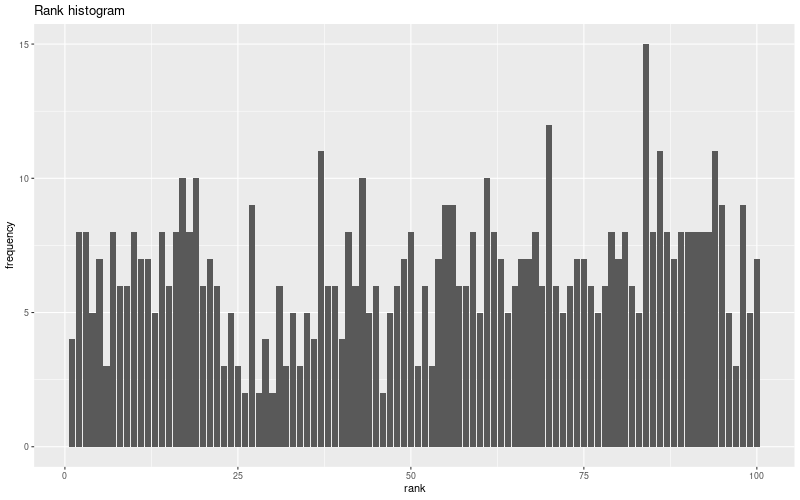
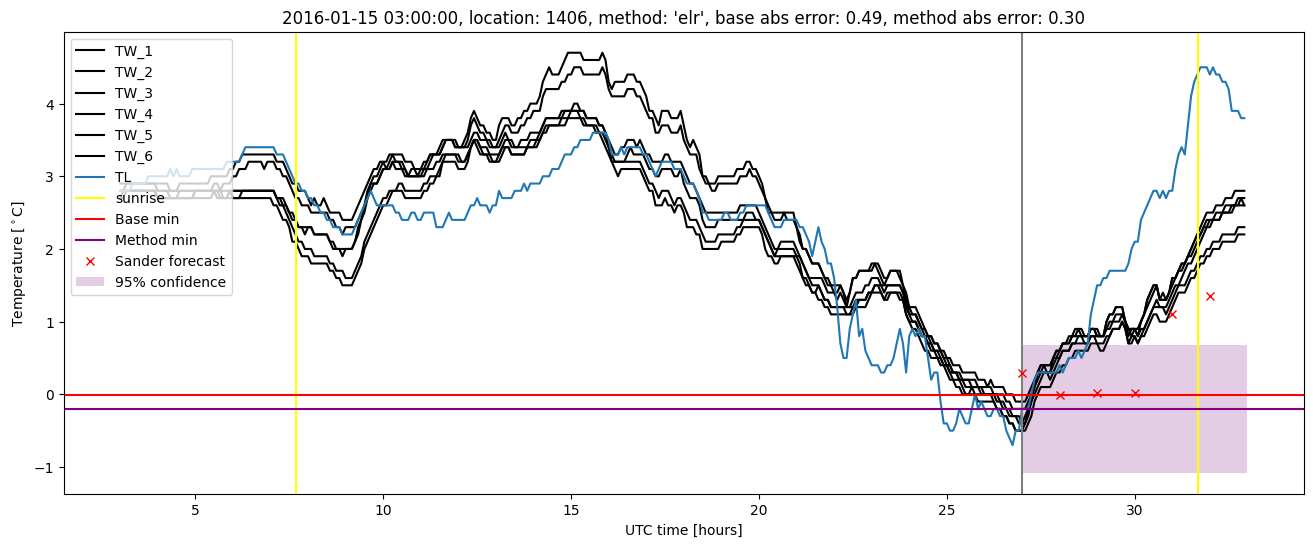
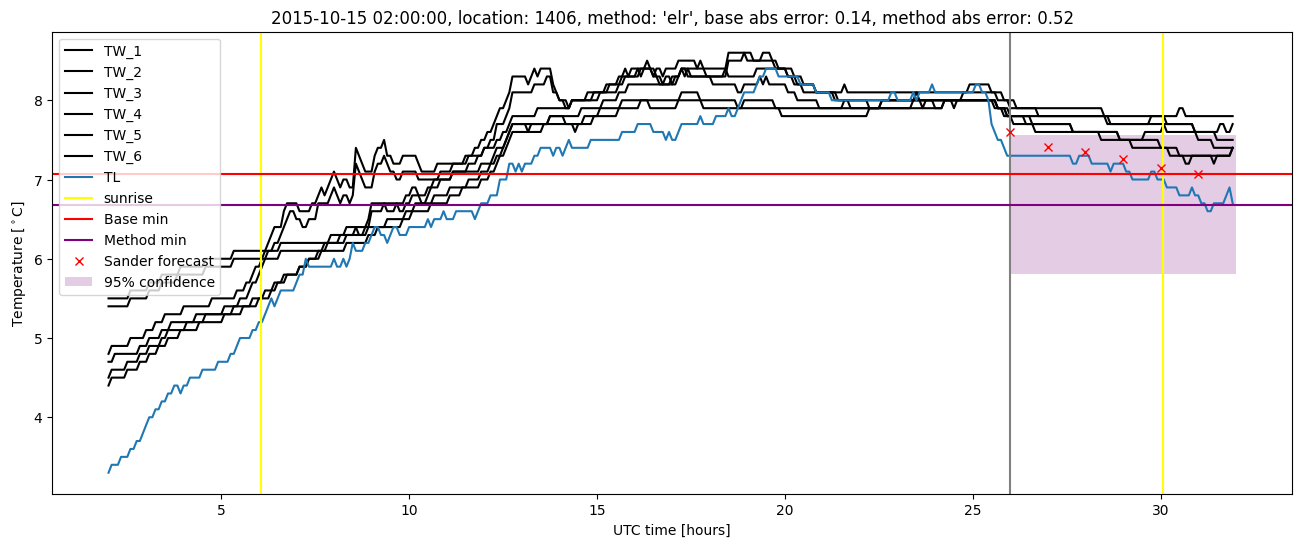
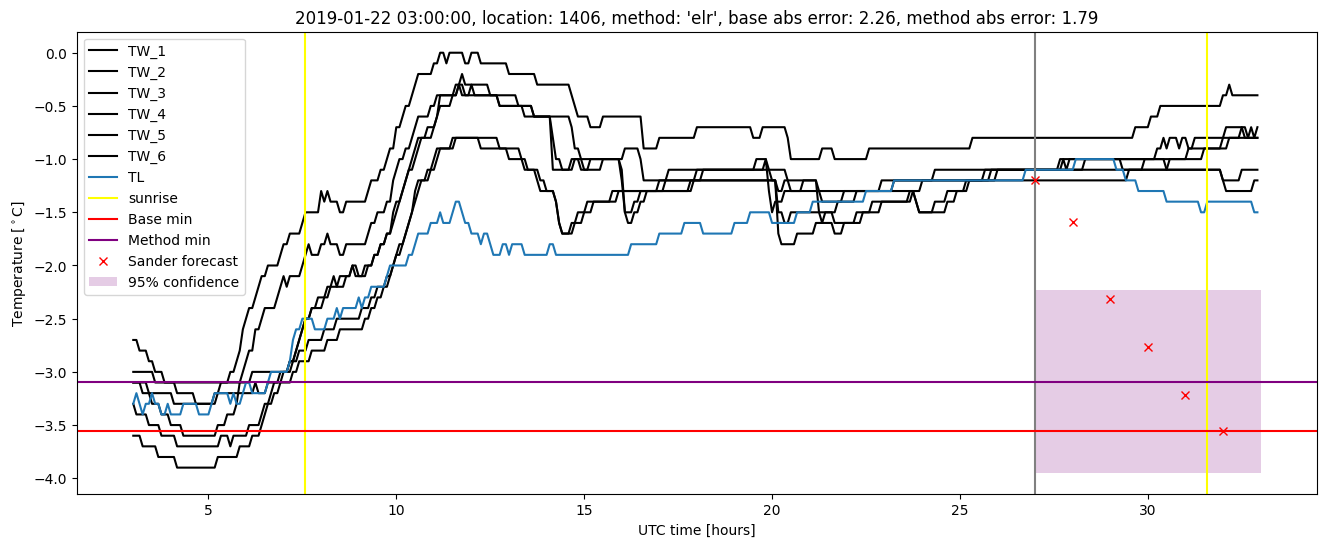
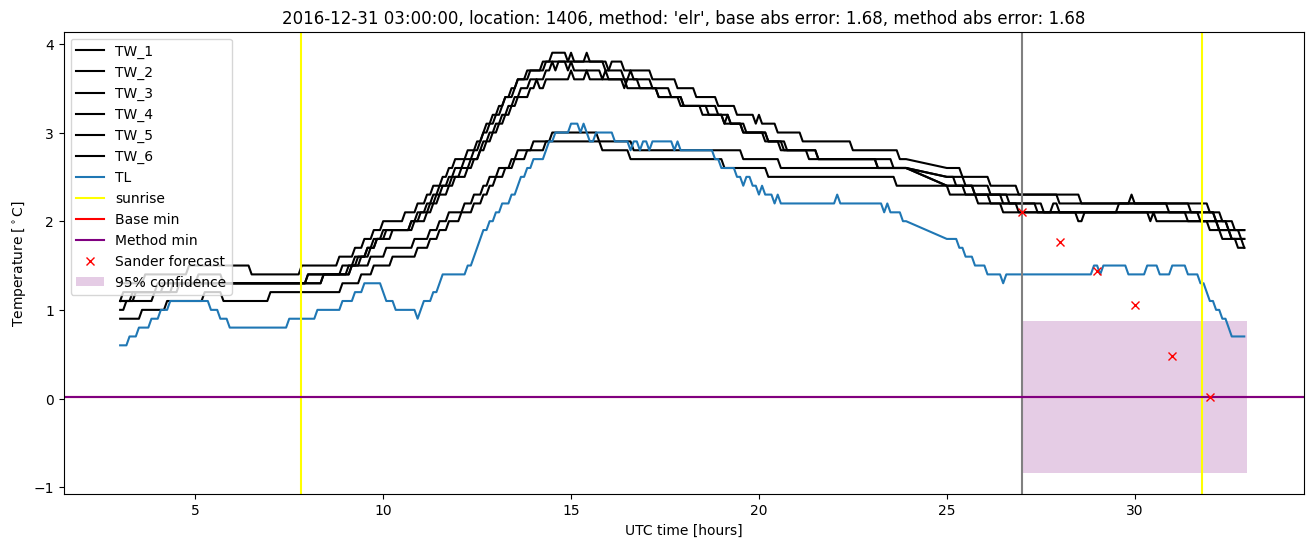
Extended logistic regression plots