GMS location: 1405
Random forest results
| names |
period |
power |
significance |
meanSquareError |
absError |
maxError |
CRPS |
IGN |
| baseline |
winter 2016 |
0.983 |
0.138 |
0.343 |
0.454 |
1.699 |
NaN |
NaN |
| forest |
winter 2016 |
0.983 |
0.138 |
0.260 |
0.382 |
1.403 |
0.477 |
4.114 |
| baseline |
winter 2017 |
0.965 |
0.050 |
0.472 |
0.517 |
2.350 |
NaN |
NaN |
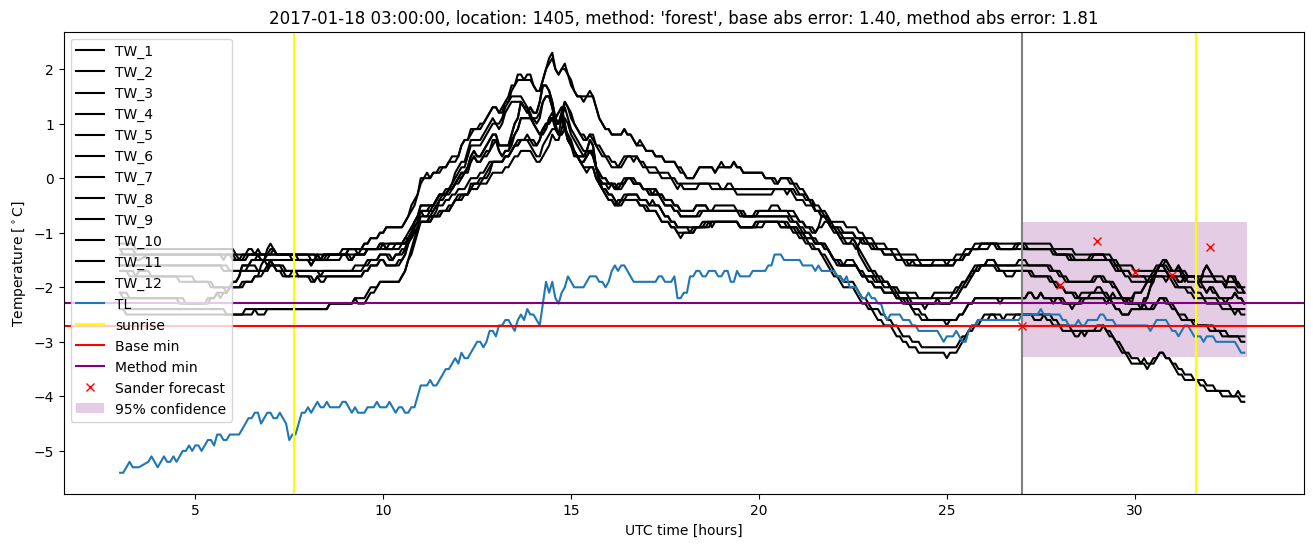
| forest |
winter 2017 |
0.965 |
0.025 |
0.403 |
0.475 |
1.864 |
0.479 |
3.698 |
| baseline |
winter 2018 |
1.000 |
0.091 |
0.364 |
0.465 |
1.700 |
NaN |
NaN |
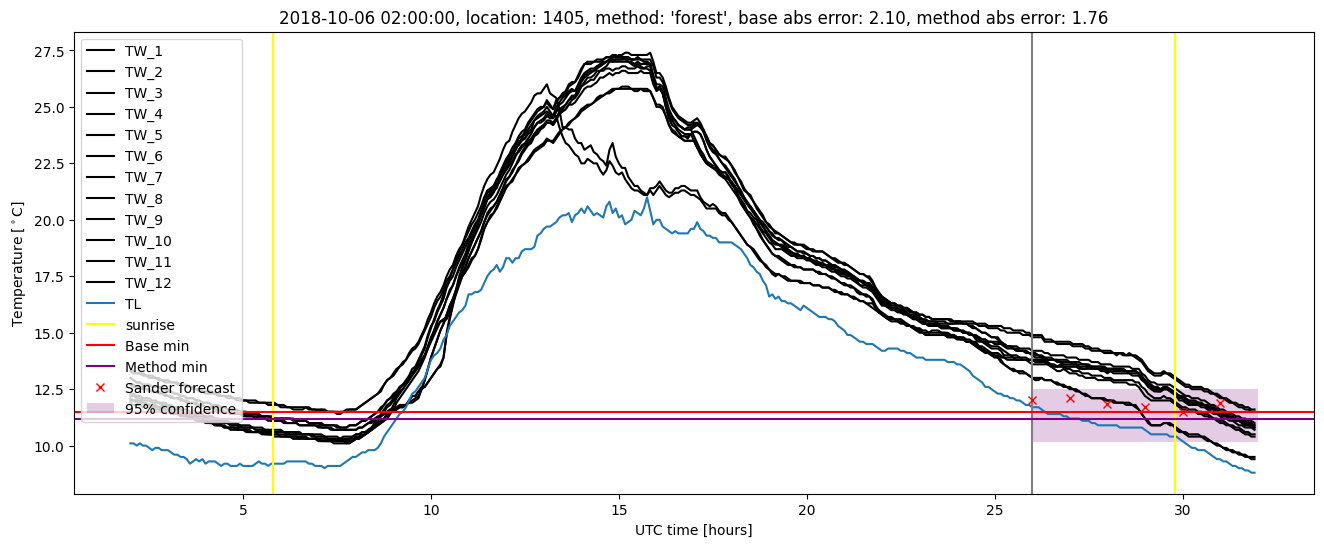
| forest |
winter 2018 |
0.992 |
0.061 |
0.277 |
0.410 |
1.601 |
0.480 |
2.776 |
| baseline |
winter 2019 |
0.993 |
0.000e+00 |
0.382 |
0.441 |
2.208 |
NaN |
NaN |
| forest |
winter 2019 |
0.993 |
0.000e+00 |
0.279 |
0.392 |
1.815 |
0.488 |
3.645 |
| baseline |
all |
0.986 |
0.078 |
0.386 |
0.468 |
2.350 |
NaN |
NaN |
| forest |
all |
0.984 |
0.061 |
0.300 |
0.412 |
1.864 |
0.481 |
3.595 |
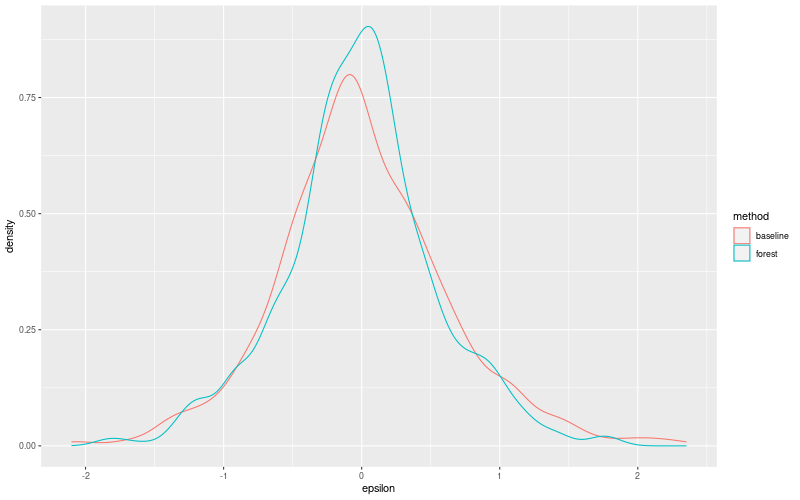
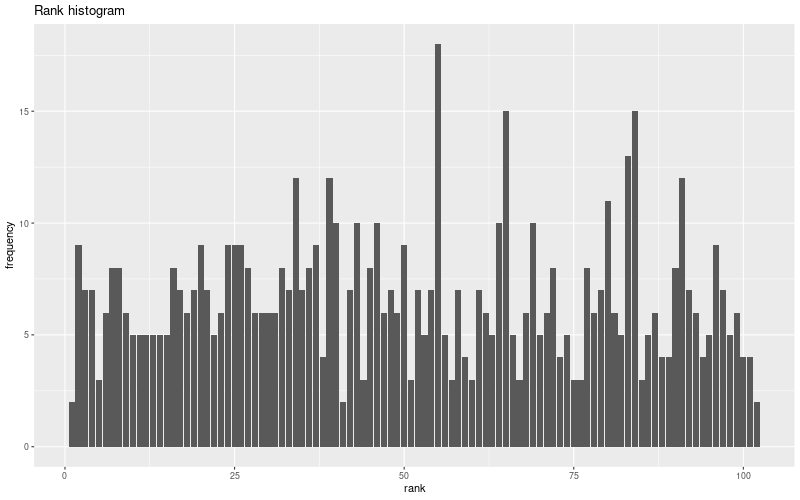
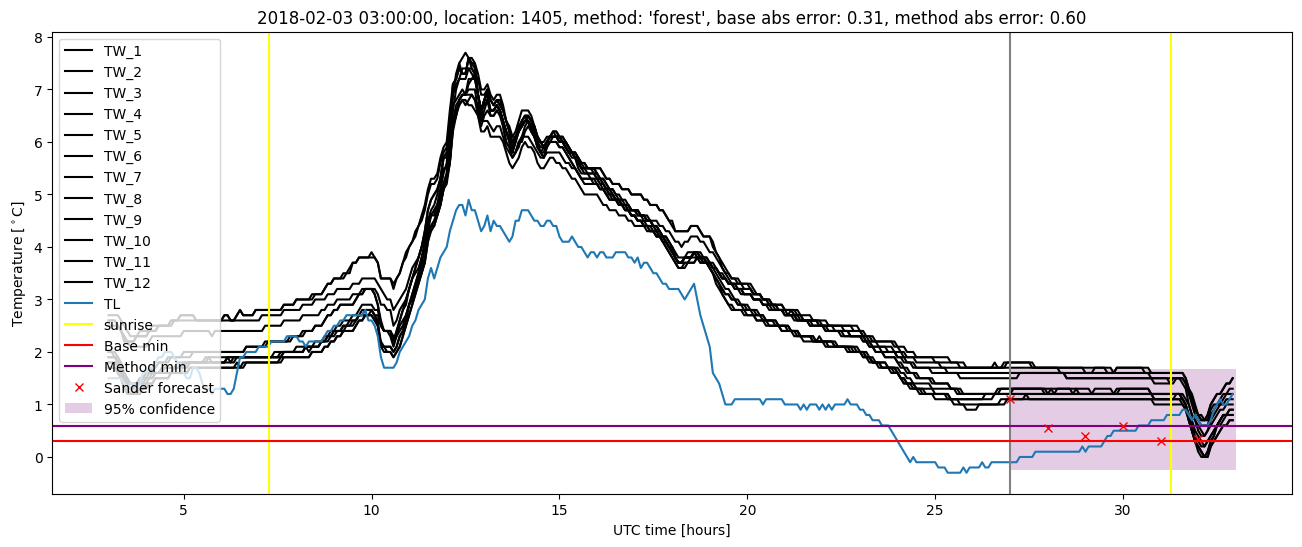
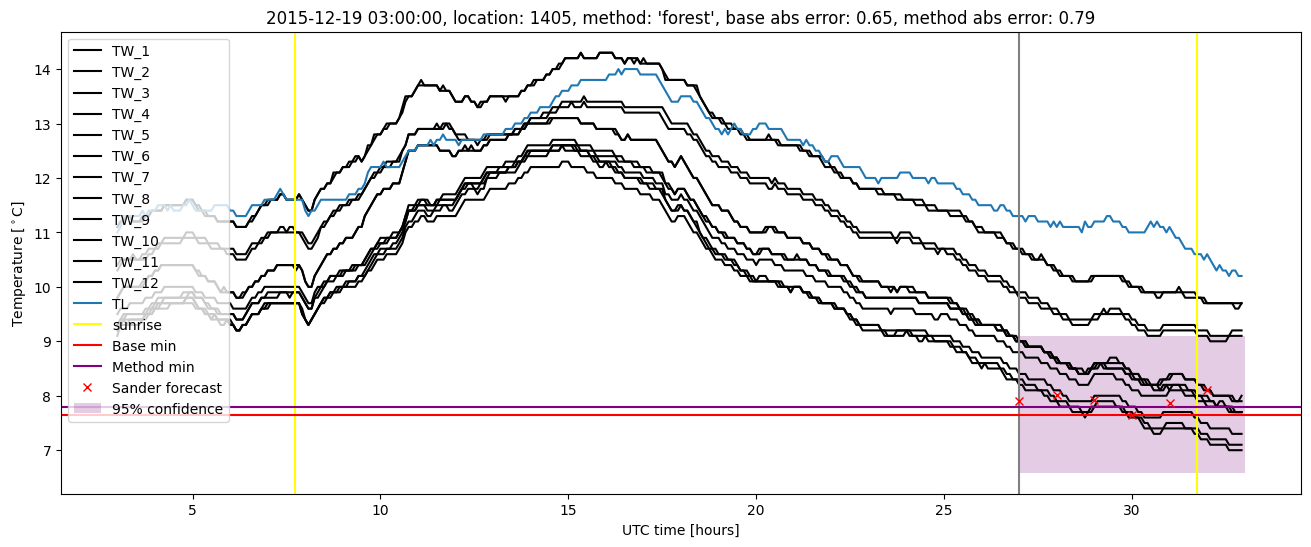
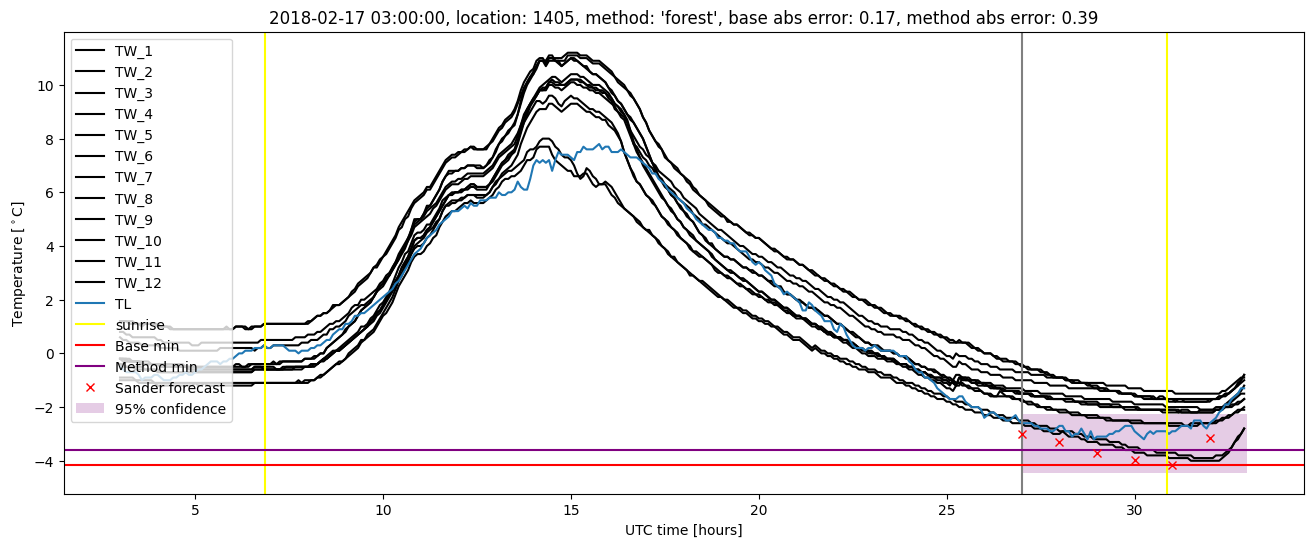
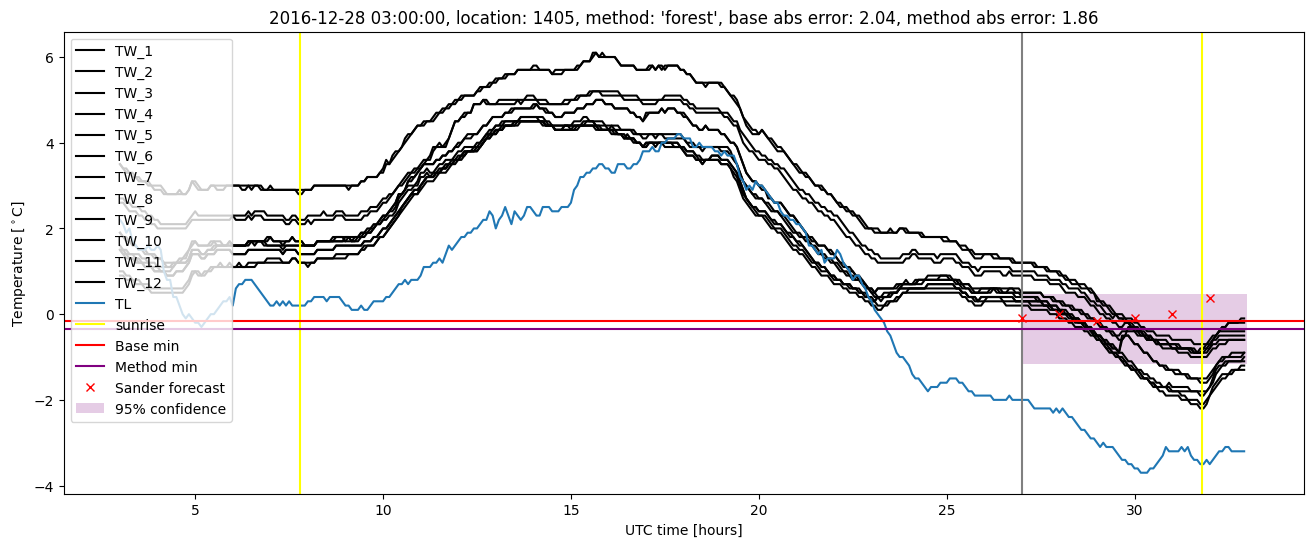
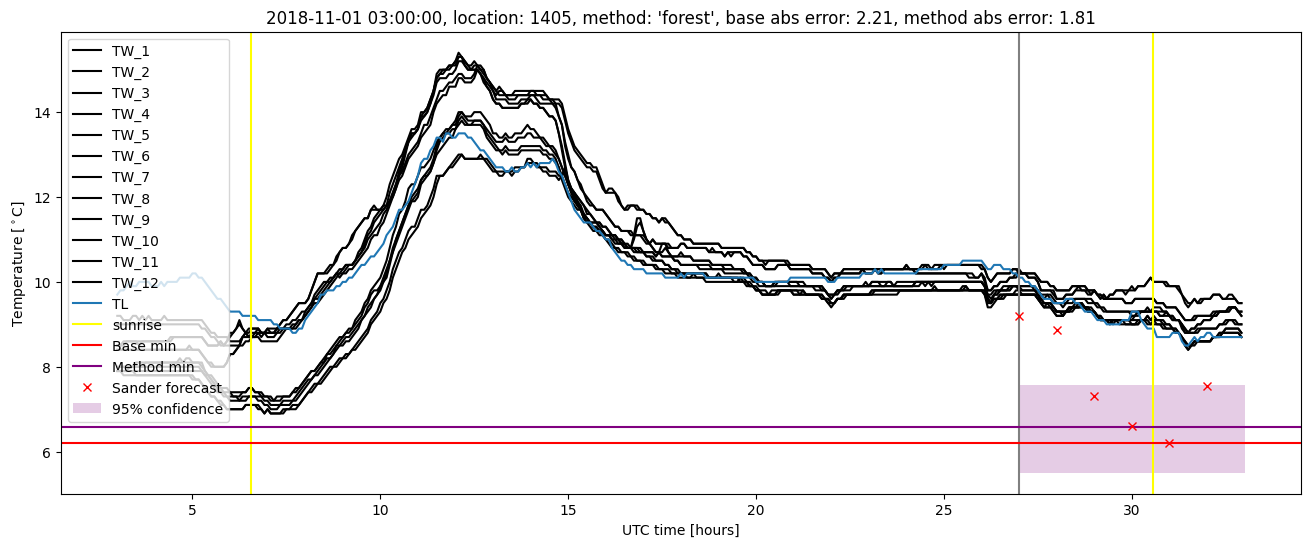
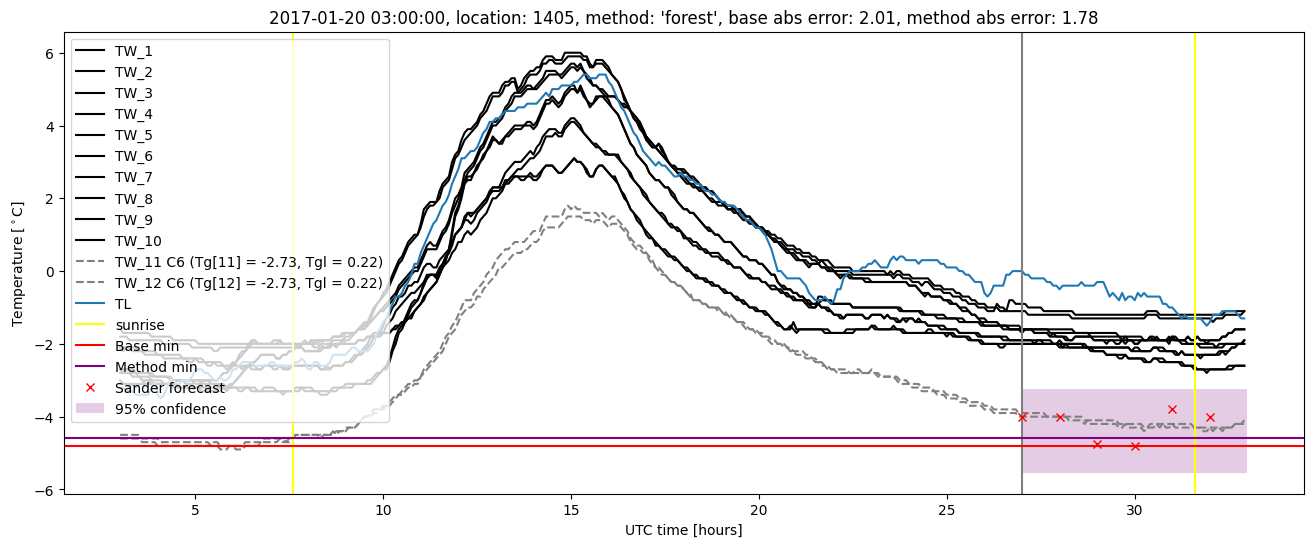
Random forest plots
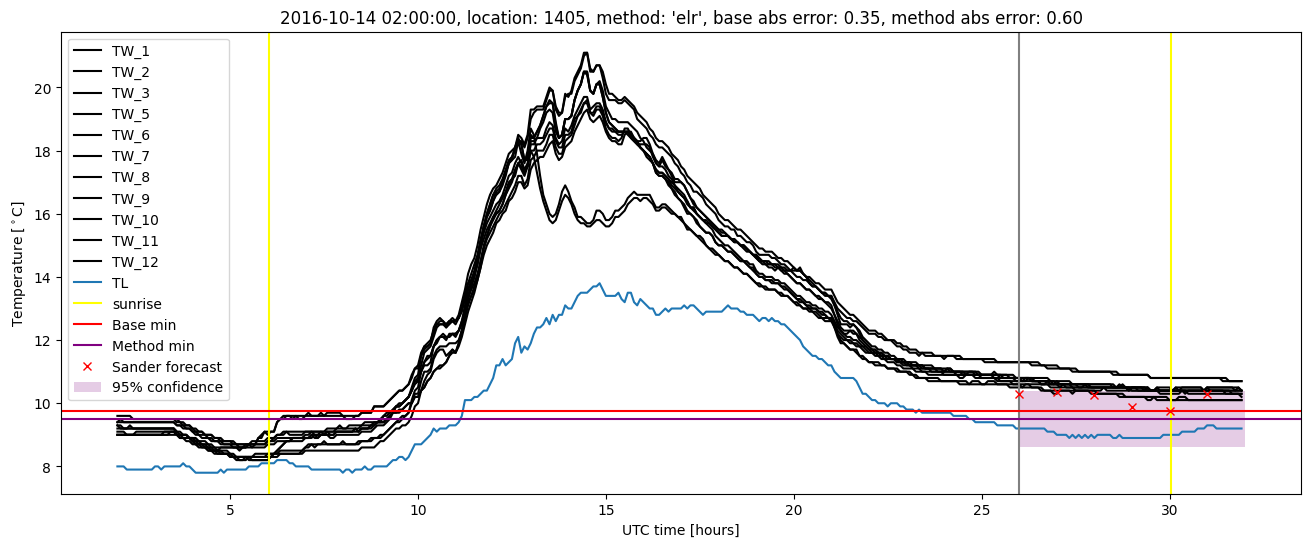
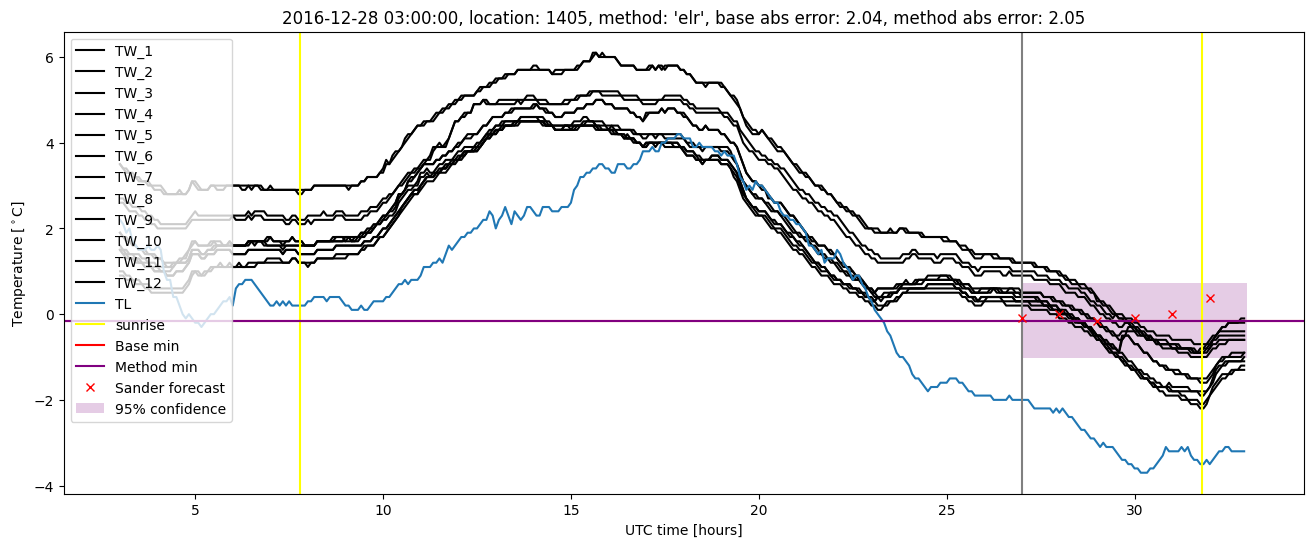
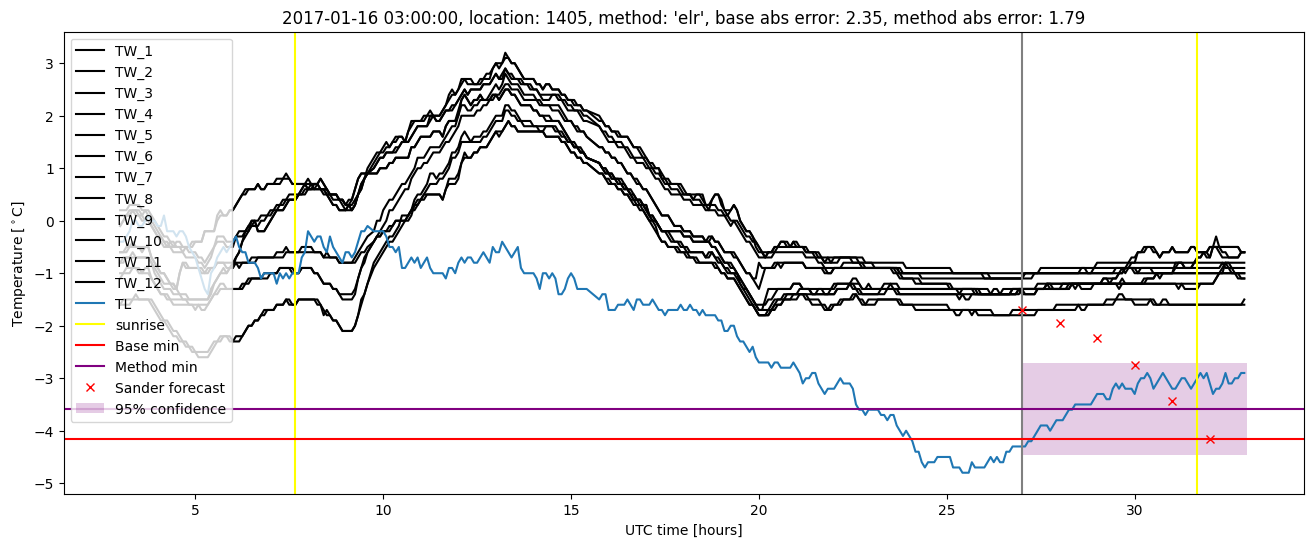
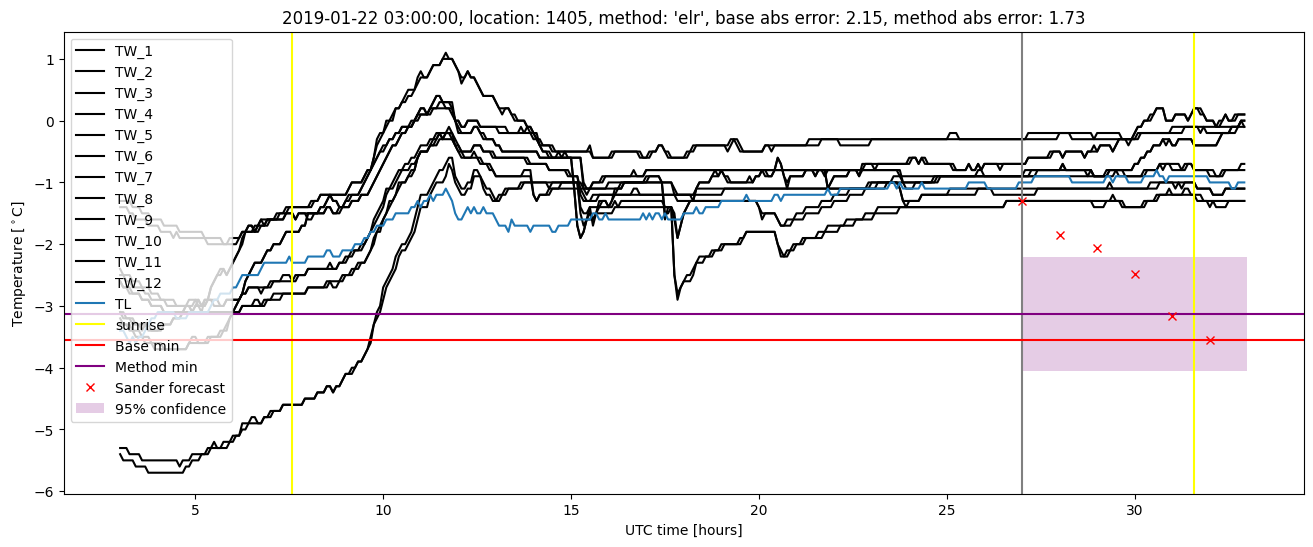
Extended logistic regression results
| names |
period |
power |
significance |
meanSquareError |
absError |
maxError |
CRPS |
IGN |
| baseline |
winter 2016 |
0.983 |
0.138 |
0.343 |
0.454 |
1.699 |
NaN |
NaN |
| elr |
winter 2016 |
0.978 |
0.138 |
0.329 |
0.448 |
1.647 |
0.551 |
3.627 |
| baseline |
winter 2017 |
0.965 |
0.050 |
0.472 |
0.517 |
2.350 |
NaN |
NaN |
| elr |
winter 2017 |
0.974 |
0.050 |
0.401 |
0.481 |
2.047 |
0.519 |
3.996 |
| baseline |
winter 2018 |
1.000 |
0.091 |
0.364 |
0.465 |
1.700 |
NaN |
NaN |
| elr |
winter 2018 |
1.000 |
0.061 |
0.315 |
0.457 |
1.628 |
0.541 |
3.526 |
| baseline |
winter 2019 |
0.993 |
0.000e+00 |
0.382 |
0.441 |
2.208 |
NaN |
NaN |
| elr |
winter 2019 |
0.993 |
0.000e+00 |
0.323 |
0.430 |
1.858 |
0.520 |
3.337 |
| baseline |
all |
0.986 |
0.078 |
0.386 |
0.468 |
2.350 |
NaN |
NaN |
| elr |
all |
0.986 |
0.070 |
0.341 |
0.453 |
2.047 |
0.534 |
3.618 |
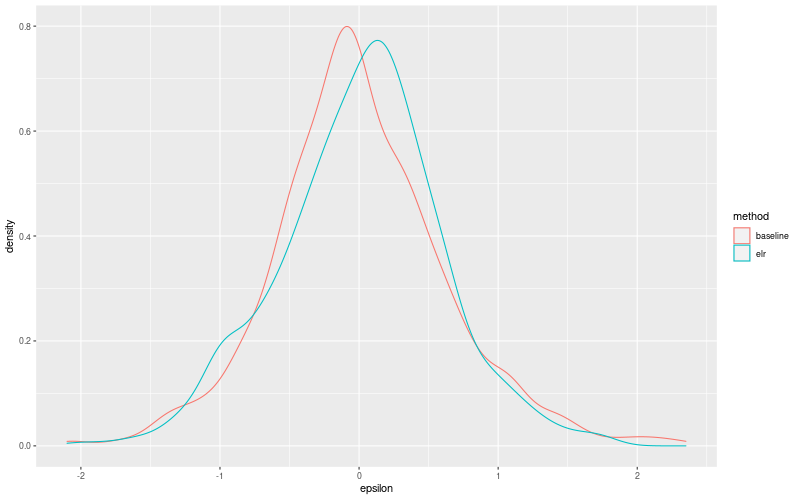
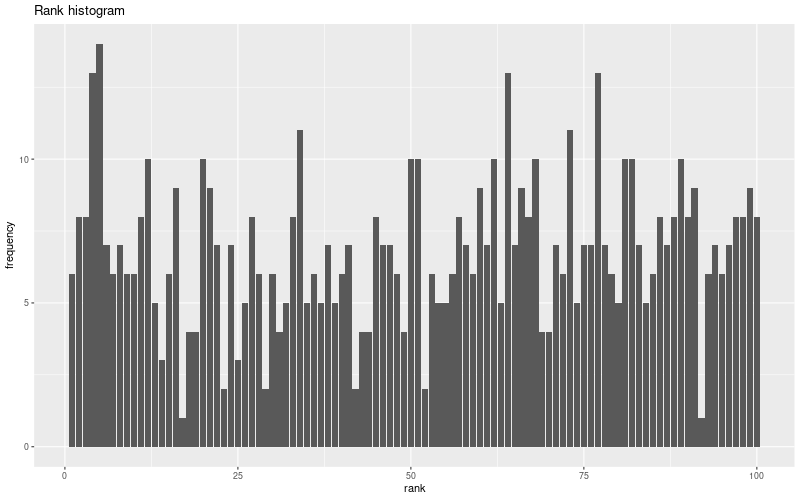
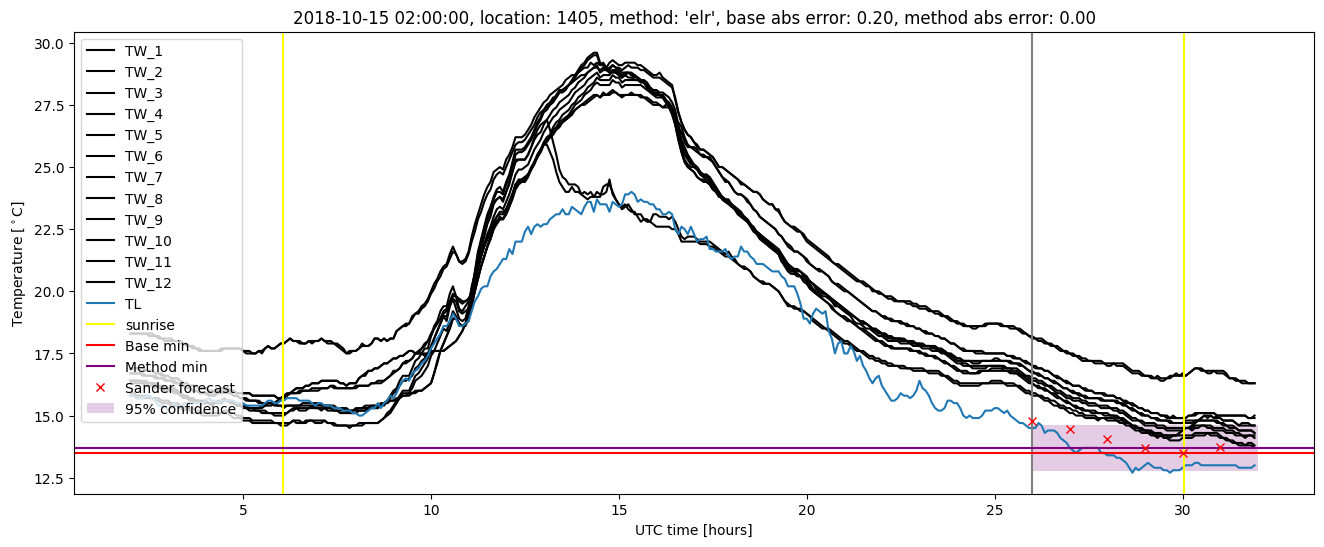
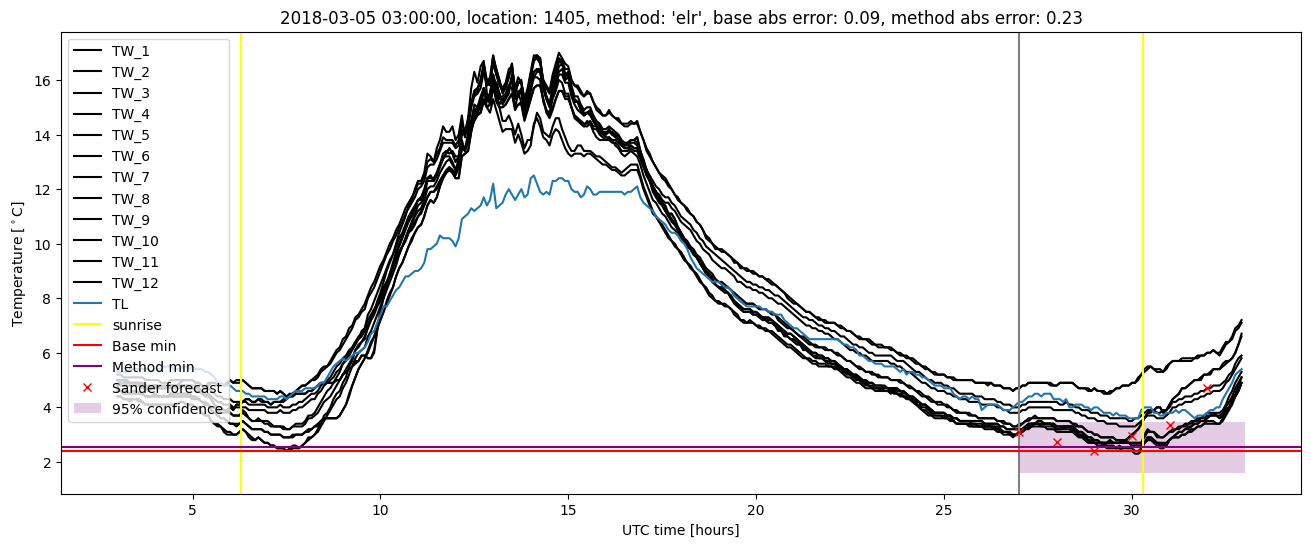
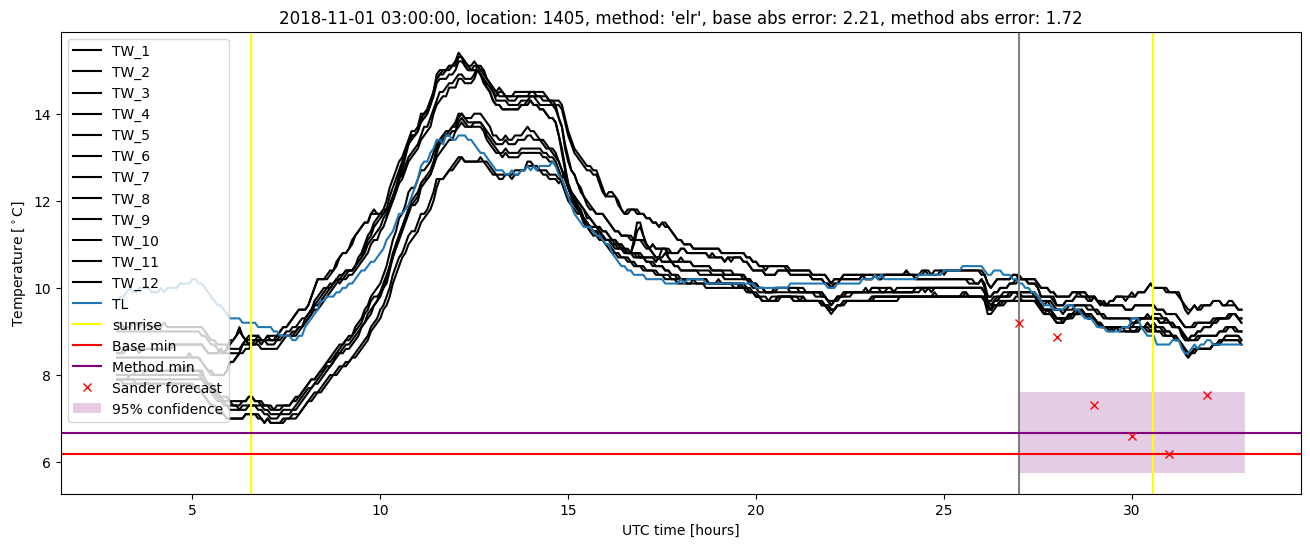
Extended logistic regression plots