GMS location: 1404
Random forest results
| names |
period |
power |
significance |
meanSquareError |
absError |
maxError |
CRPS |
IGN |
| baseline |
winter 2016 |
0.983 |
0.045 |
0.355 |
0.439 |
1.832 |
NaN |
NaN |
| forest |
winter 2016 |
0.995 |
0.045 |
0.241 |
0.372 |
1.546 |
0.453 |
5.810 |
| baseline |
winter 2017 |
0.983 |
0.056 |
0.381 |
0.466 |
2.566 |
NaN |
NaN |
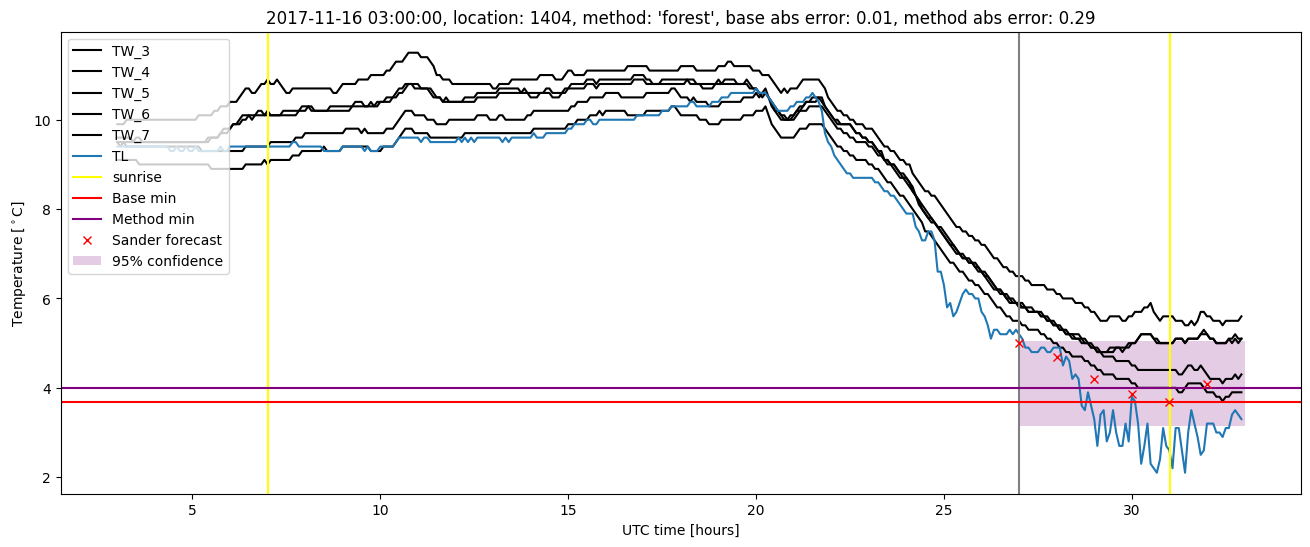
| forest |
winter 2017 |
0.991 |
0.111 |
0.258 |
0.379 |
1.582 |
0.452 |
5.718 |
| baseline |
winter 2018 |
0.993 |
0.156 |
0.337 |
0.441 |
1.579 |
NaN |
NaN |
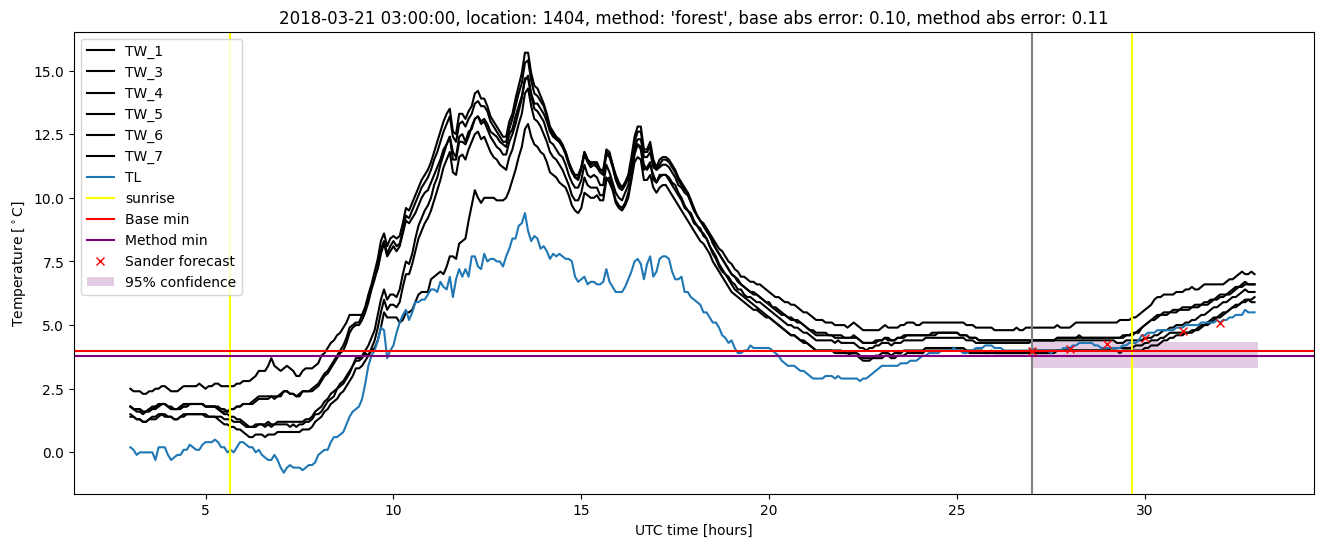
| forest |
winter 2018 |
0.985 |
0.125 |
0.265 |
0.386 |
1.920 |
0.456 |
5.894 |
| baseline |
winter 2019 |
0.985 |
0.154 |
0.424 |
0.477 |
2.360 |
NaN |
NaN |
| forest |
winter 2019 |
0.992 |
0.154 |
0.294 |
0.395 |
1.817 |
0.445 |
6.125 |
| baseline |
all |
0.986 |
0.097 |
0.371 |
0.454 |
2.566 |
NaN |
NaN |
| forest |
all |
0.991 |
0.107 |
0.262 |
0.382 |
1.920 |
0.452 |
5.879 |
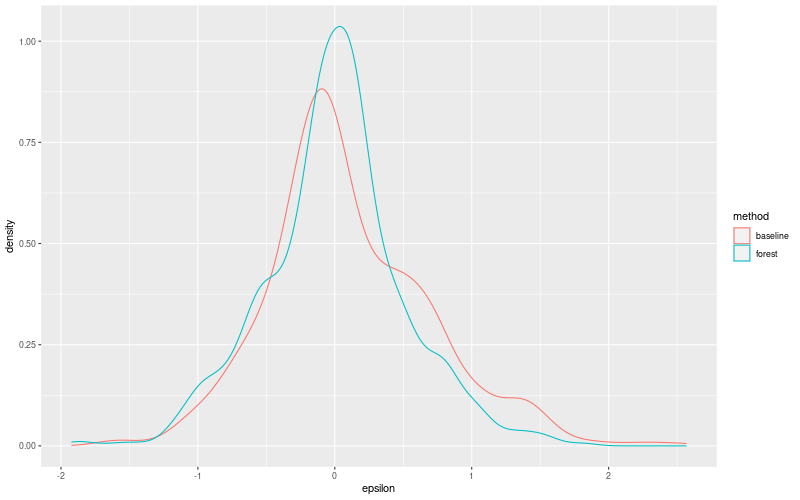
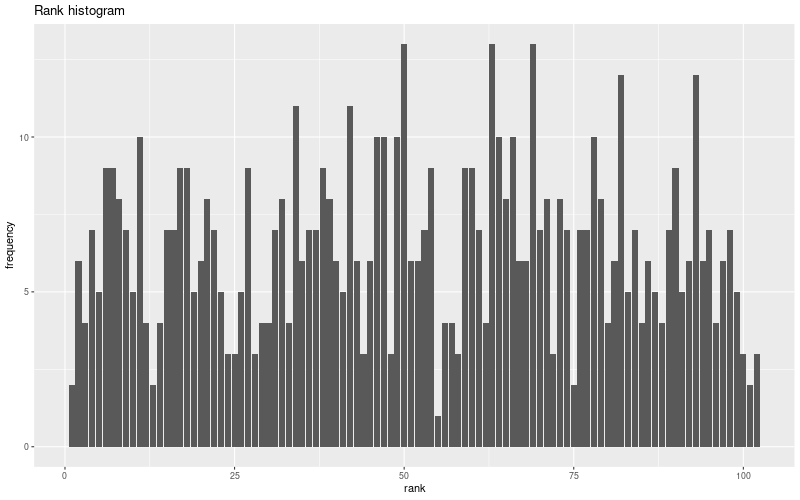
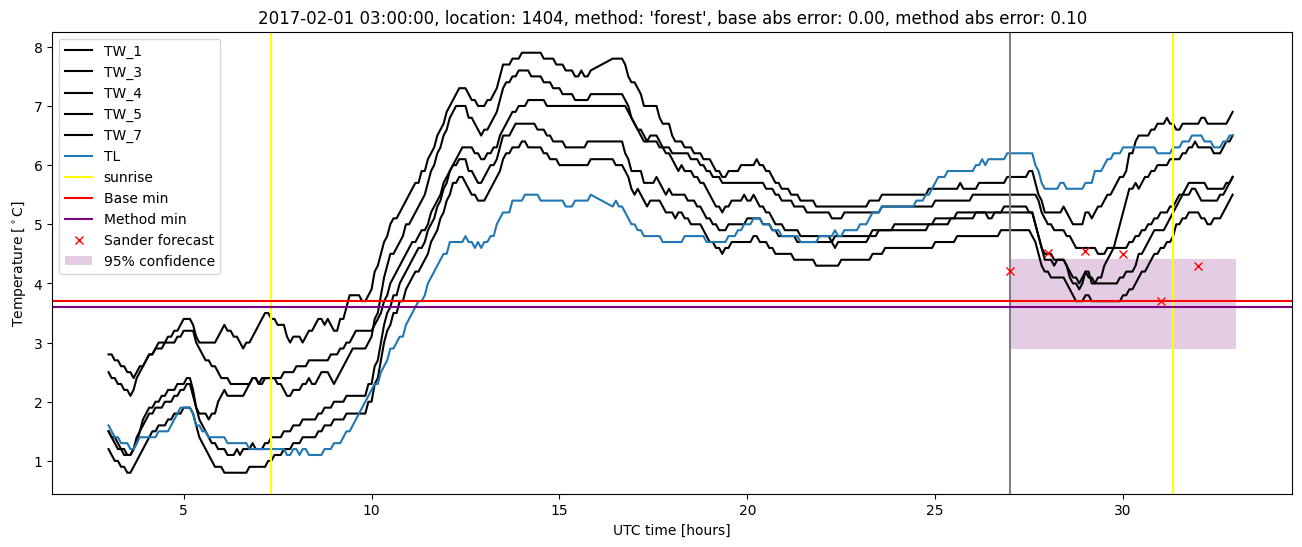
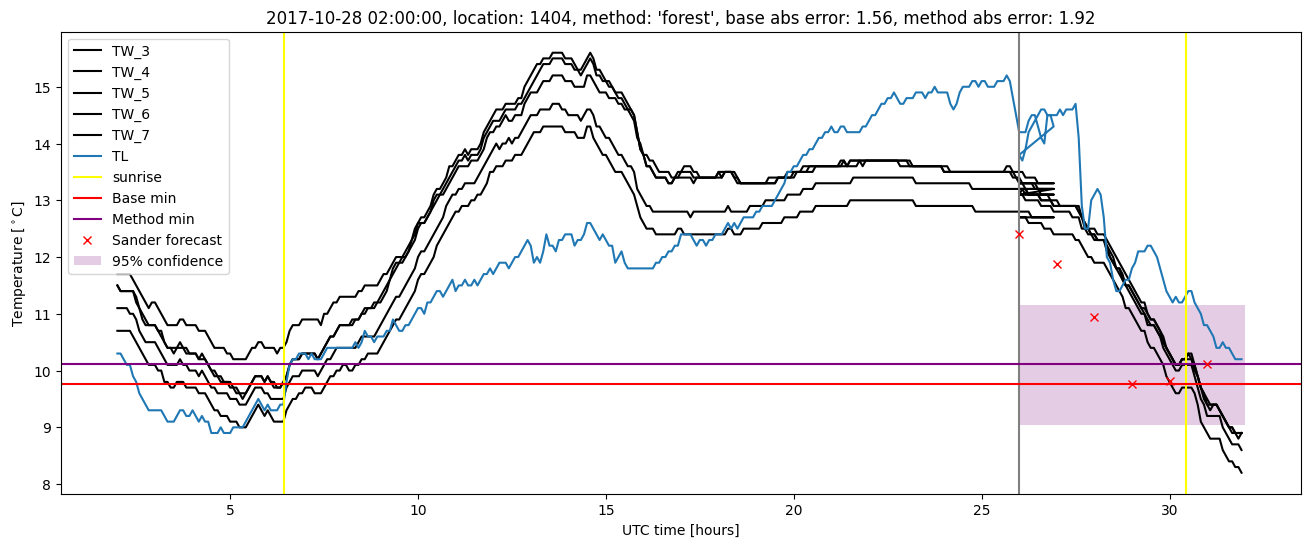
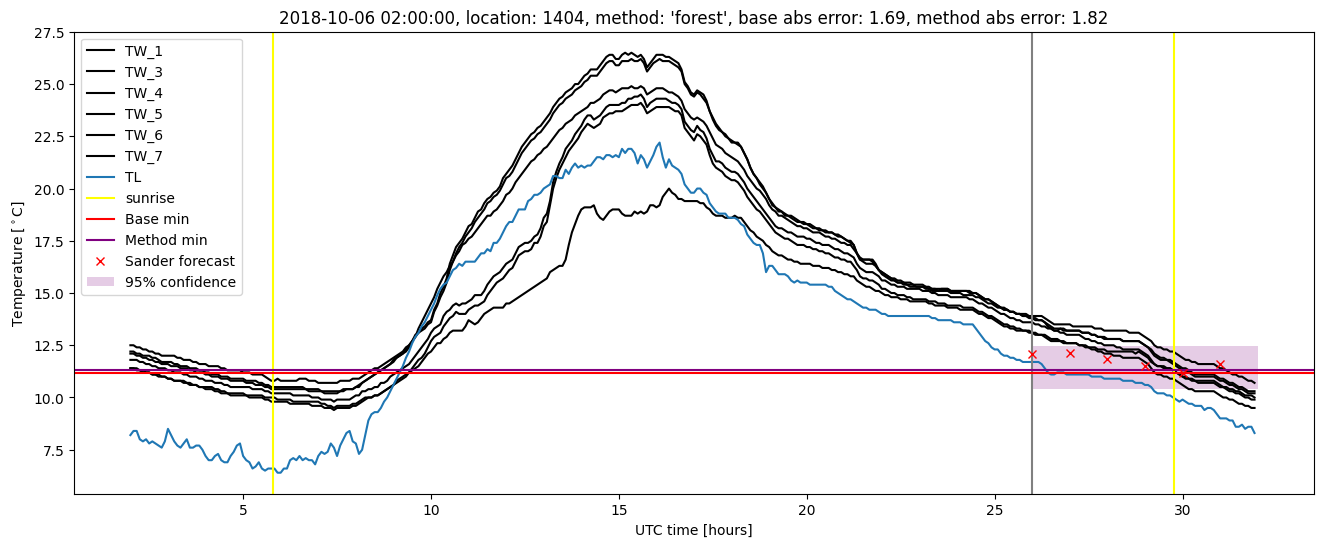
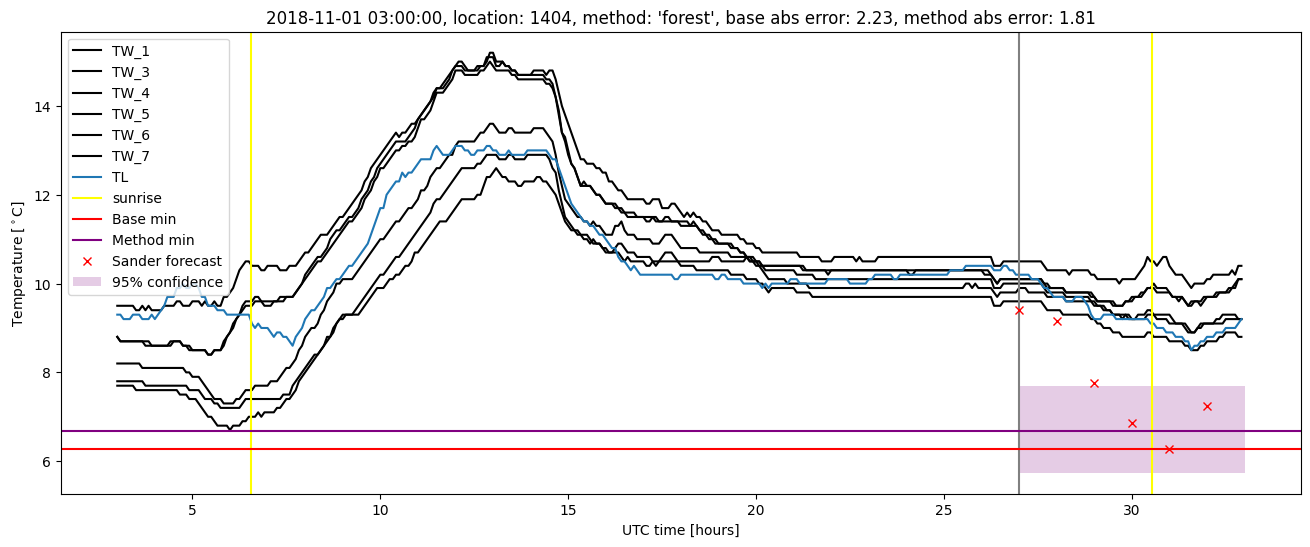
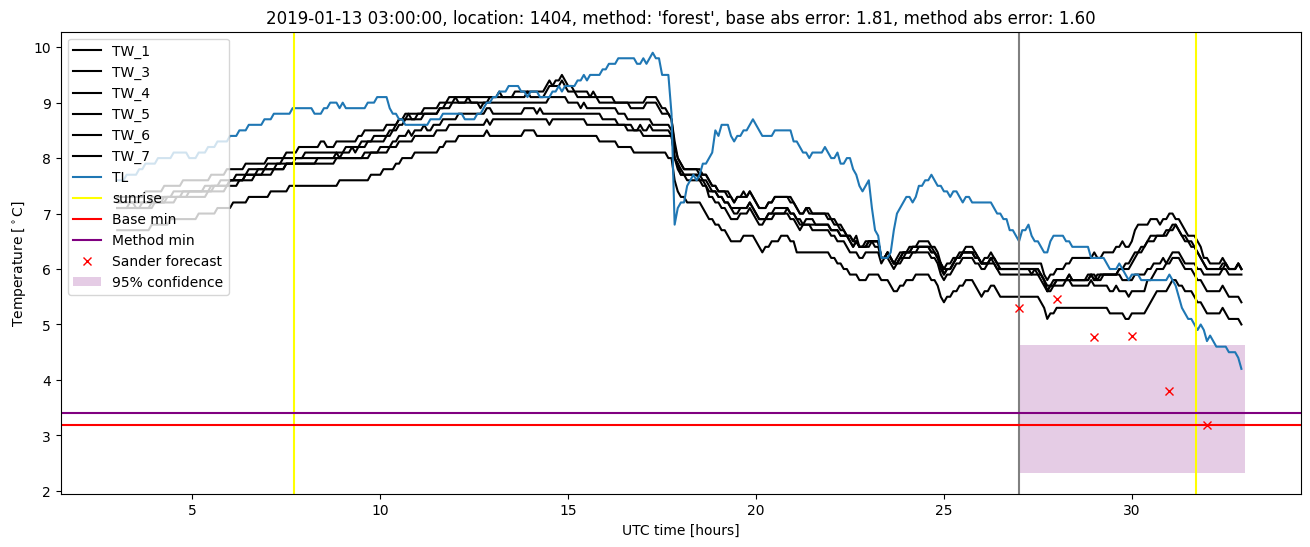
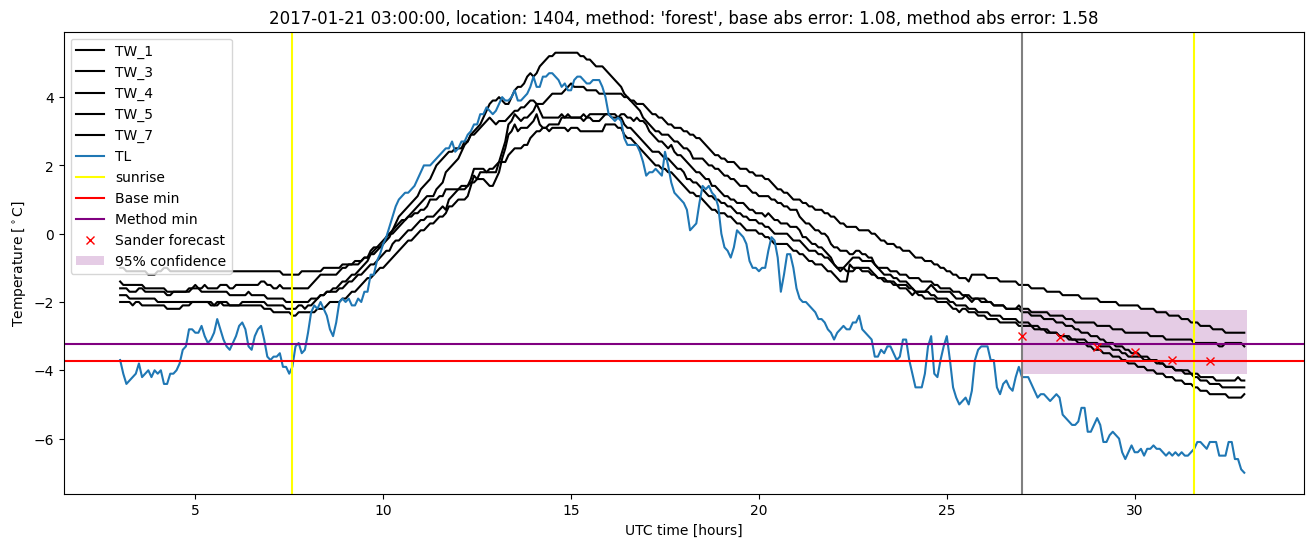
Random forest plots
Extended logistic regression results
| names |
period |
power |
significance |
meanSquareError |
absError |
maxError |
CRPS |
IGN |
| baseline |
winter 2016 |
0.983 |
0.045 |
0.355 |
0.439 |
1.832 |
NaN |
NaN |
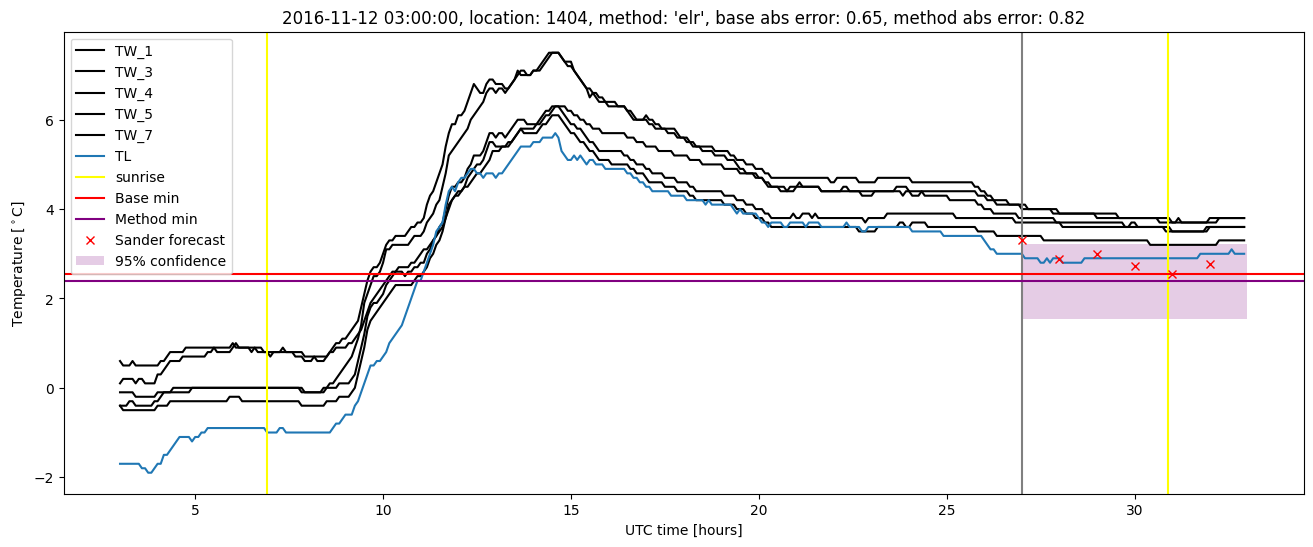
| elr |
winter 2016 |
0.995 |
0.000e+00 |
0.275 |
0.403 |
1.861 |
0.524 |
4.894 |
| baseline |
winter 2017 |
0.983 |
0.056 |
0.381 |
0.466 |
2.566 |
NaN |
NaN |
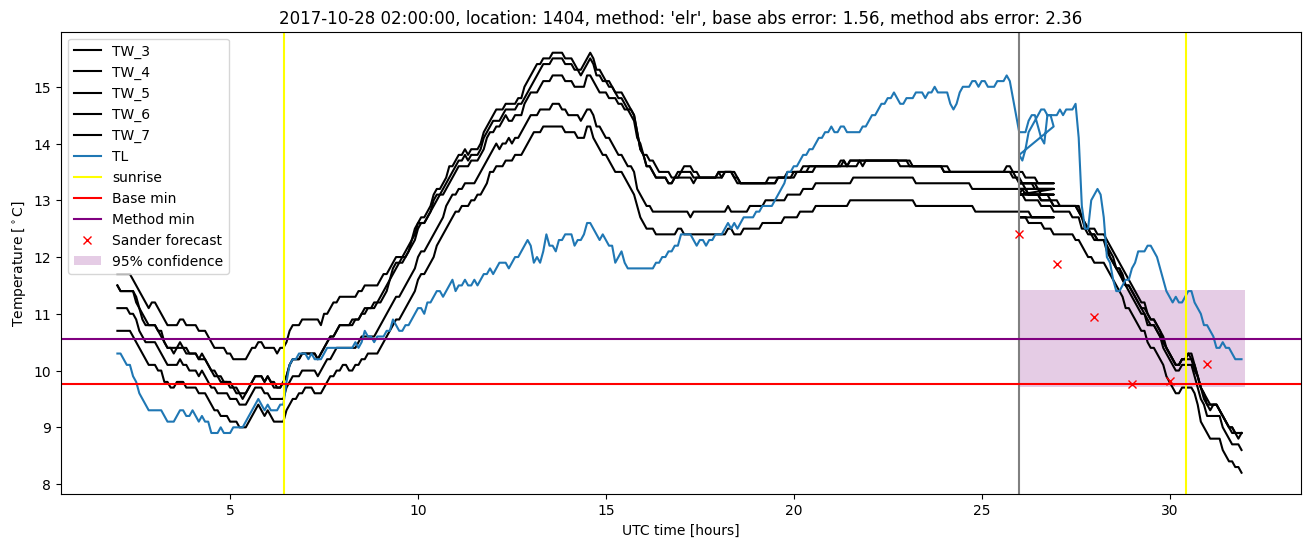
| elr |
winter 2017 |
0.983 |
0.083 |
0.268 |
0.397 |
2.032 |
0.517 |
4.569 |
| baseline |
winter 2018 |
0.993 |
0.156 |
0.337 |
0.441 |
1.579 |
NaN |
NaN |
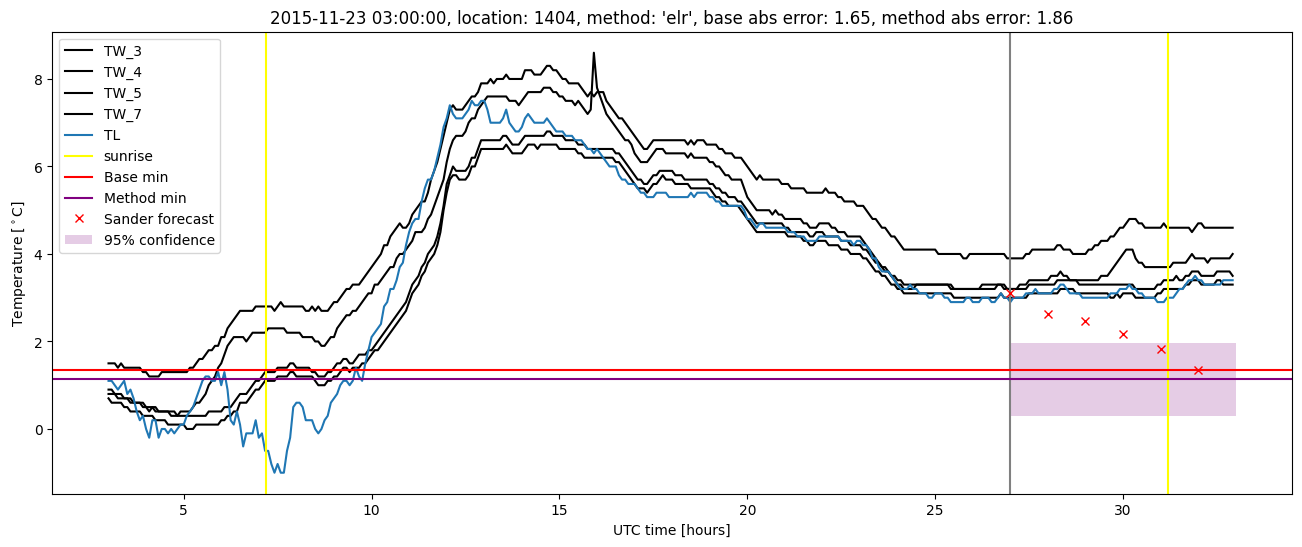
| elr |
winter 2018 |
0.985 |
0.125 |
0.300 |
0.419 |
2.364 |
0.541 |
4.673 |
| baseline |
winter 2019 |
0.985 |
0.154 |
0.424 |
0.477 |
2.360 |
NaN |
NaN |
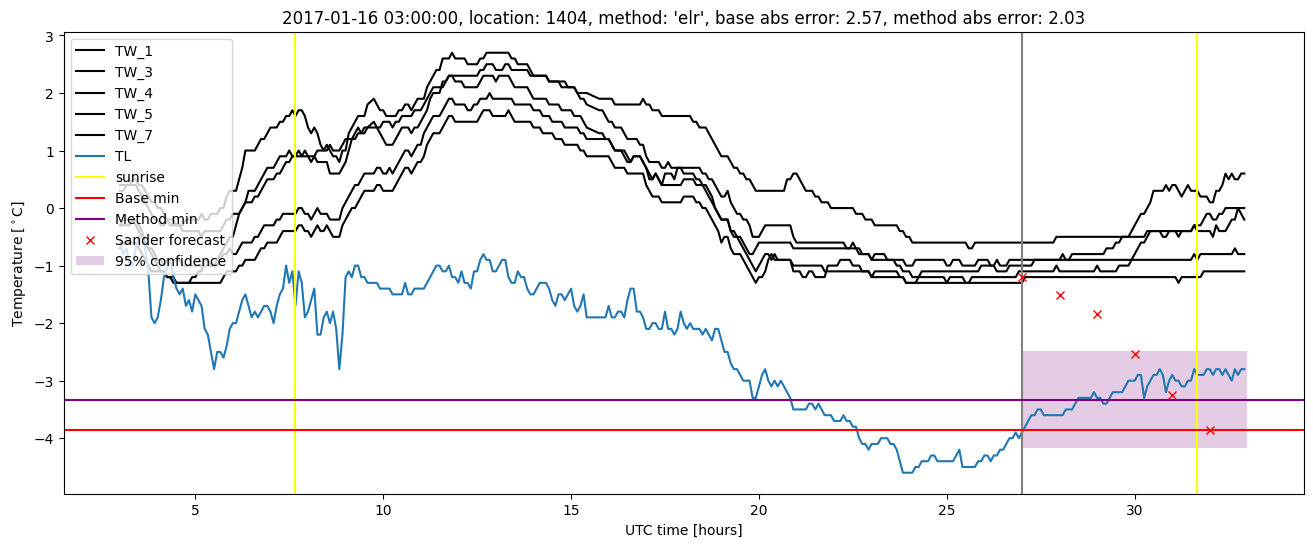
| elr |
winter 2019 |
0.992 |
0.154 |
0.317 |
0.434 |
1.759 |
0.493 |
4.109 |
| baseline |
all |
0.986 |
0.097 |
0.371 |
0.454 |
2.566 |
NaN |
NaN |
| elr |
all |
0.989 |
0.087 |
0.289 |
0.412 |
2.364 |
0.520 |
4.594 |
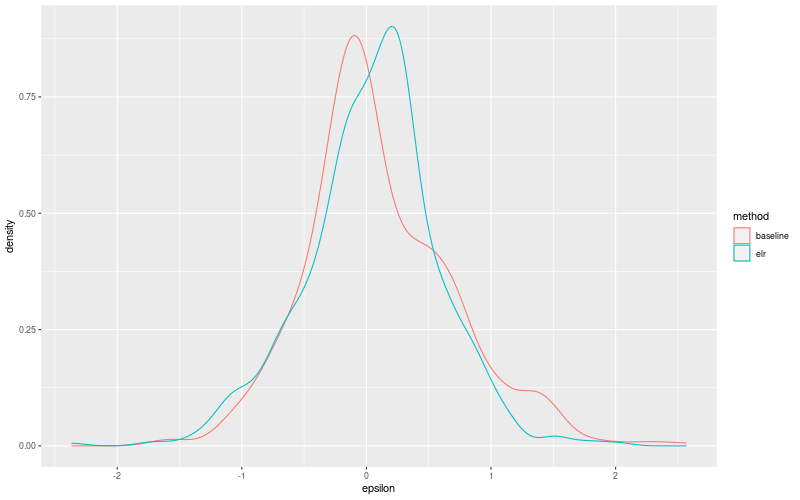
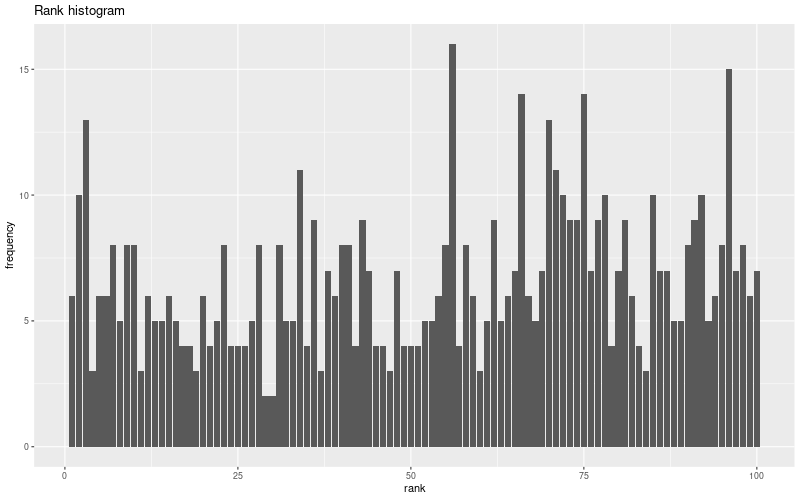
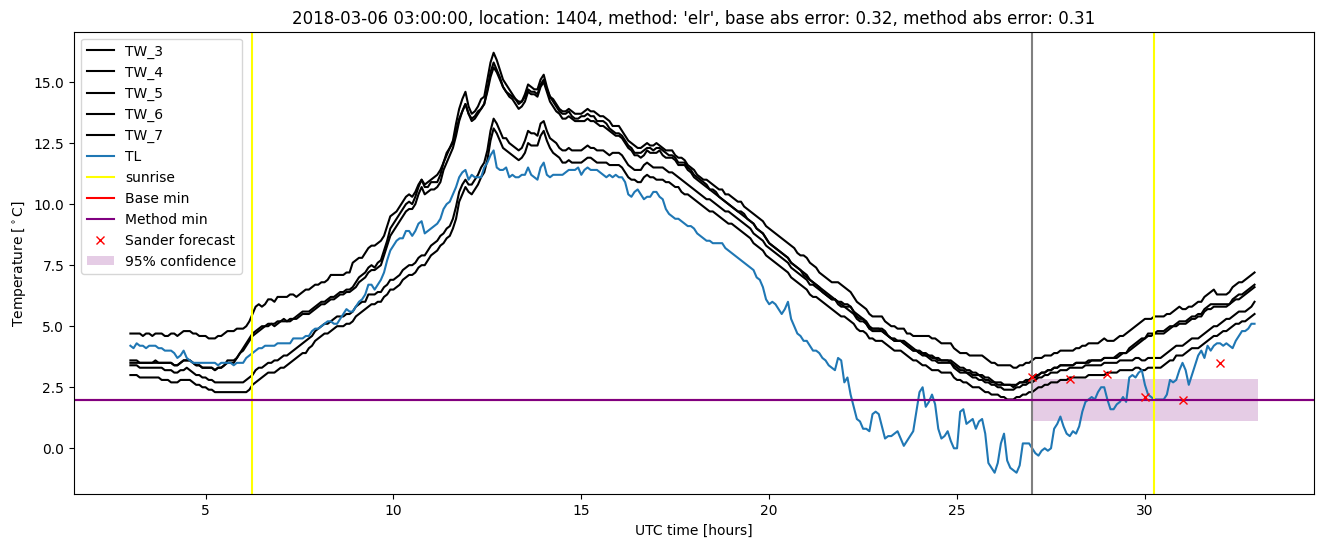
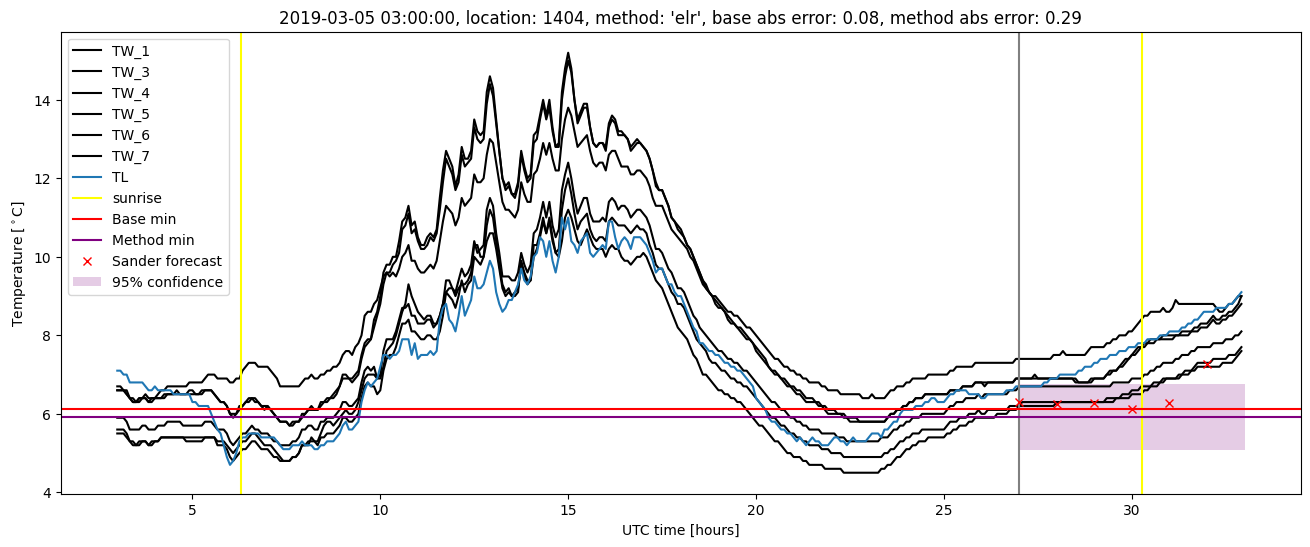
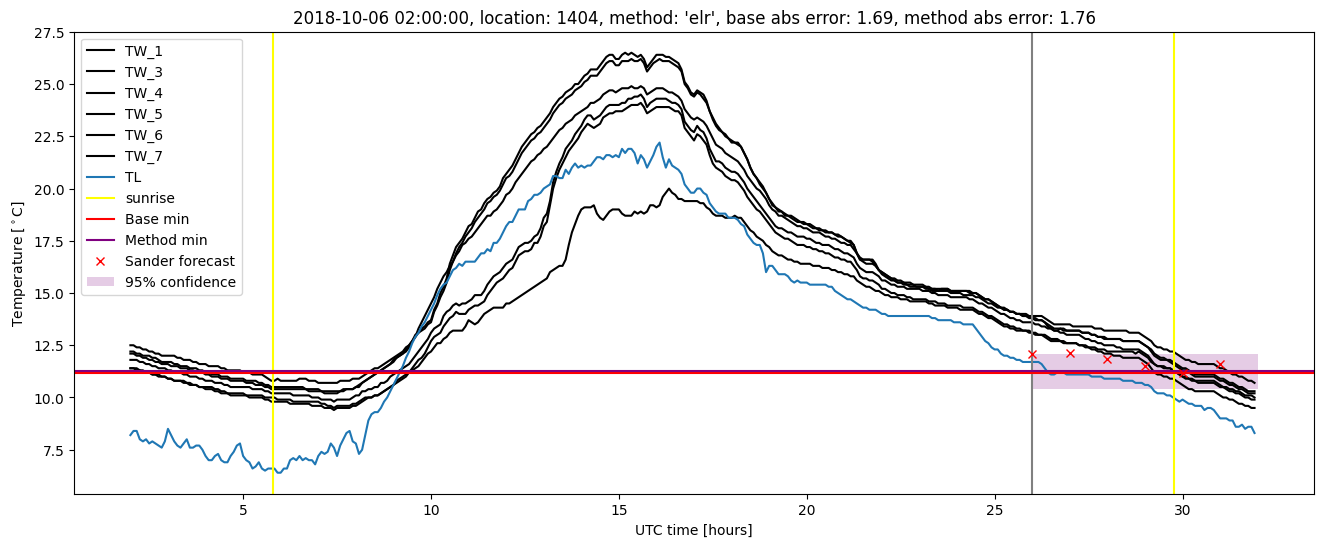
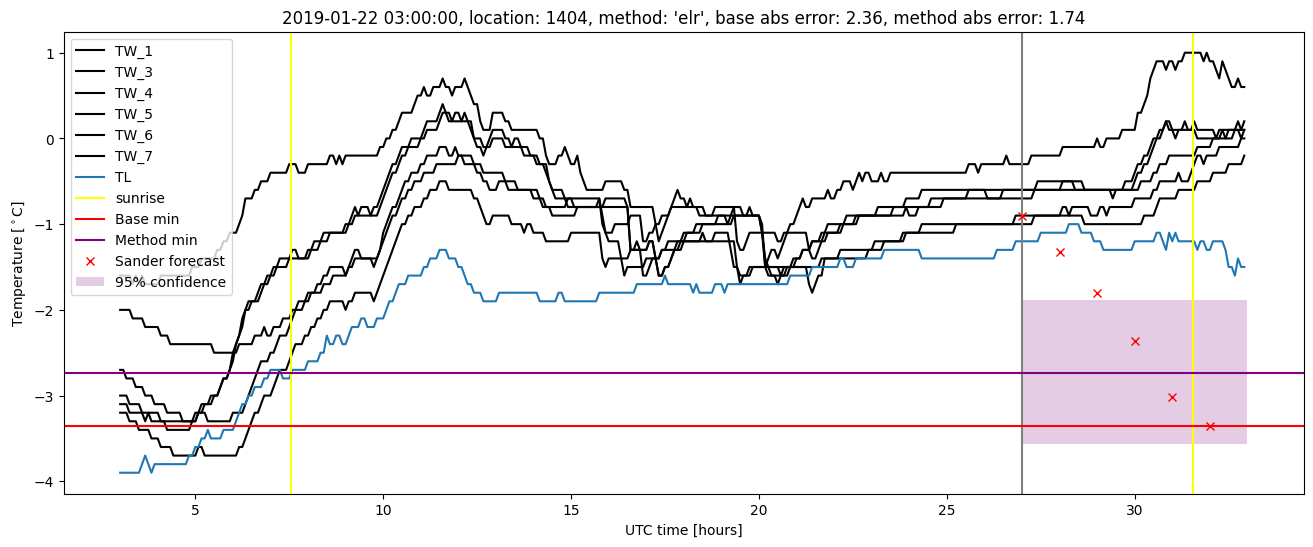
Extended logistic regression plots