GMS location: 1403
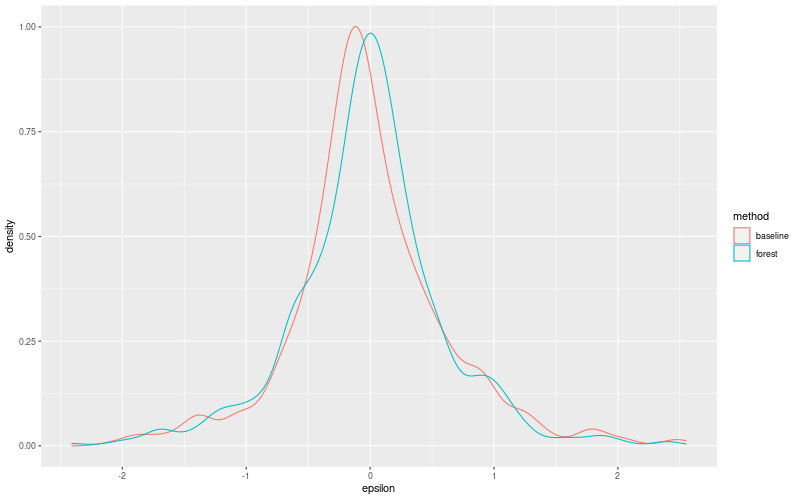
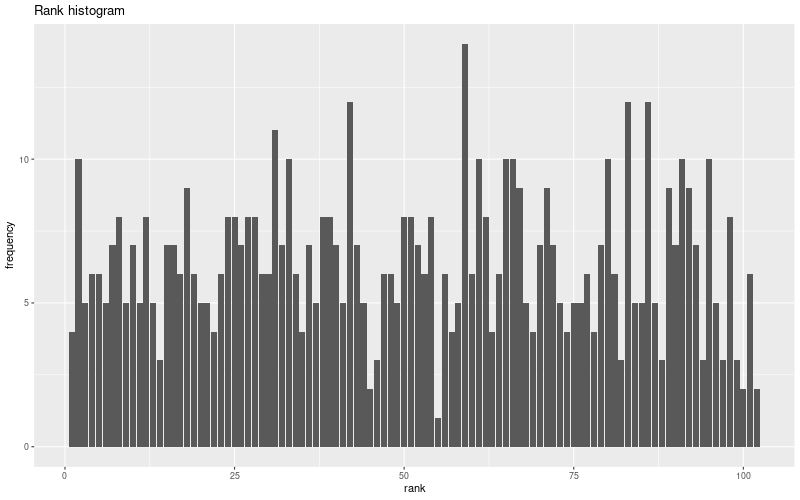
Random forest results
| names |
period |
power |
significance |
meanSquareError |
absError |
maxError |
CRPS |
IGN |
| baseline |
winter 2016 |
0.994 |
0.100 |
0.328 |
0.426 |
1.938 |
NaN |
NaN |
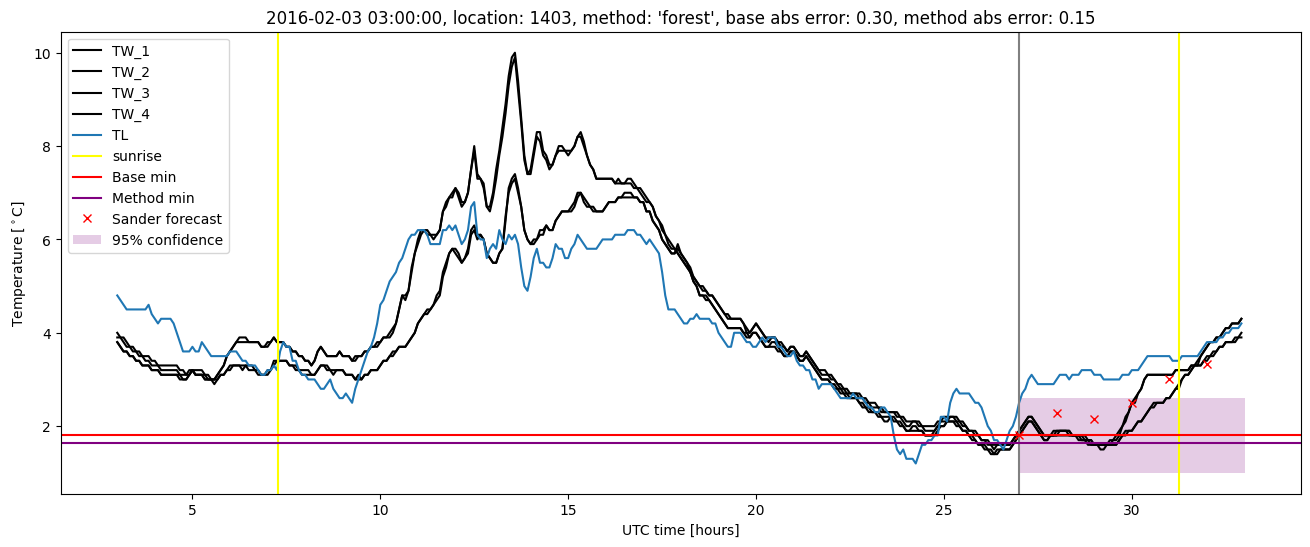
| forest |
winter 2016 |
0.983 |
0.067 |
0.282 |
0.394 |
1.754 |
0.476 |
3.055 |
| baseline |
winter 2017 |
0.991 |
0.021 |
0.522 |
0.518 |
2.550 |
NaN |
NaN |
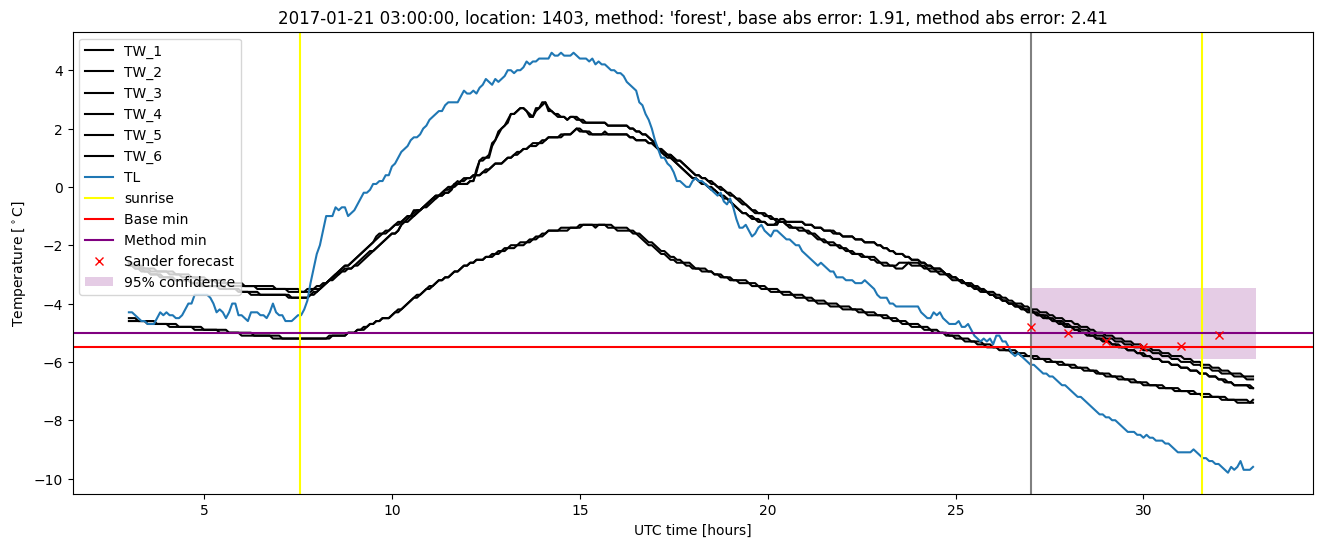
| forest |
winter 2017 |
0.981 |
0.000e+00 |
0.519 |
0.521 |
2.407 |
0.460 |
4.124 |
| baseline |
winter 2018 |
0.977 |
0.139 |
0.402 |
0.449 |
2.445 |
NaN |
NaN |
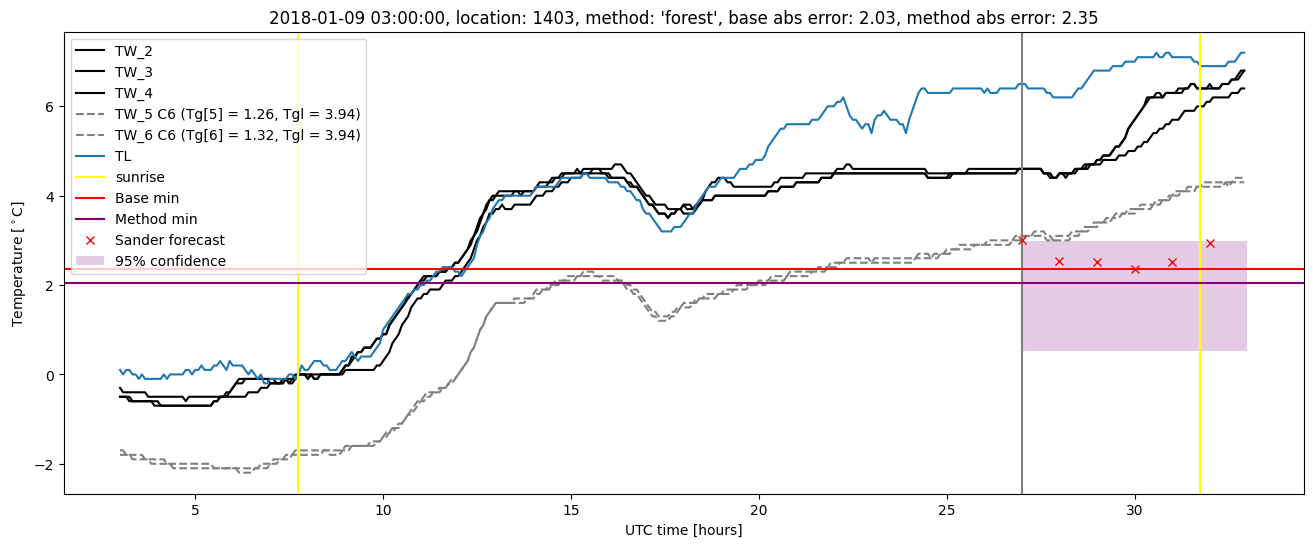
| forest |
winter 2018 |
0.977 |
0.056 |
0.366 |
0.422 |
2.351 |
0.486 |
4.049 |
| baseline |
winter 2019 |
0.982 |
0.045 |
0.365 |
0.406 |
2.441 |
NaN |
NaN |
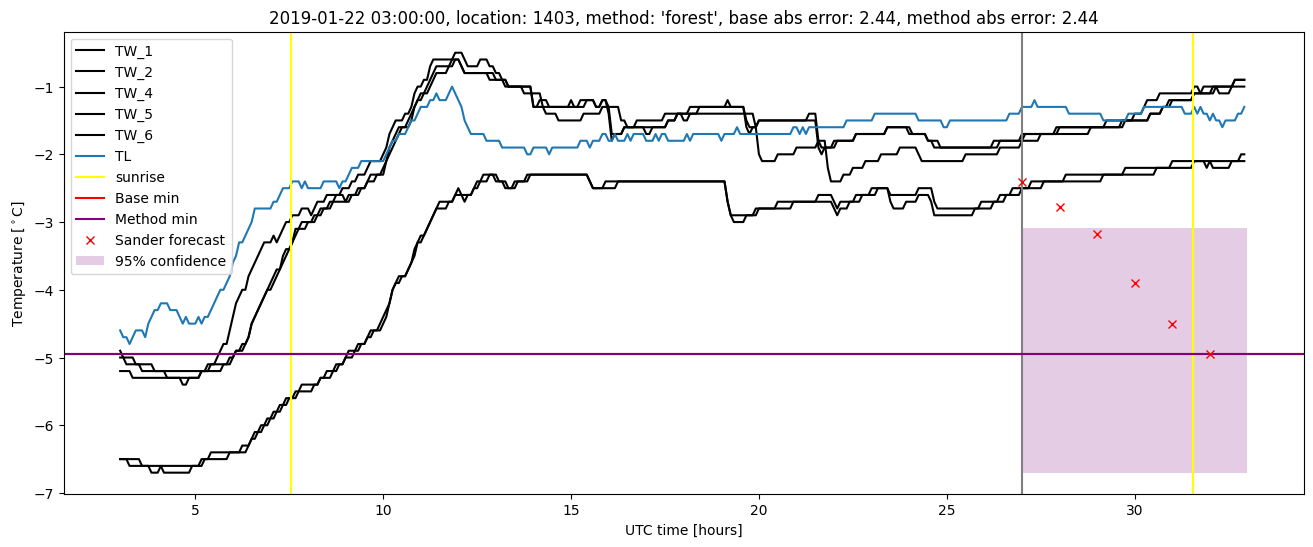
| forest |
winter 2019 |
1.000 |
0.091 |
0.312 |
0.388 |
2.444 |
0.451 |
2.376 |
| baseline |
all |
0.987 |
0.074 |
0.399 |
0.449 |
2.550 |
NaN |
NaN |
| forest |
all |
0.985 |
0.044 |
0.365 |
0.429 |
2.444 |
0.470 |
3.414 |
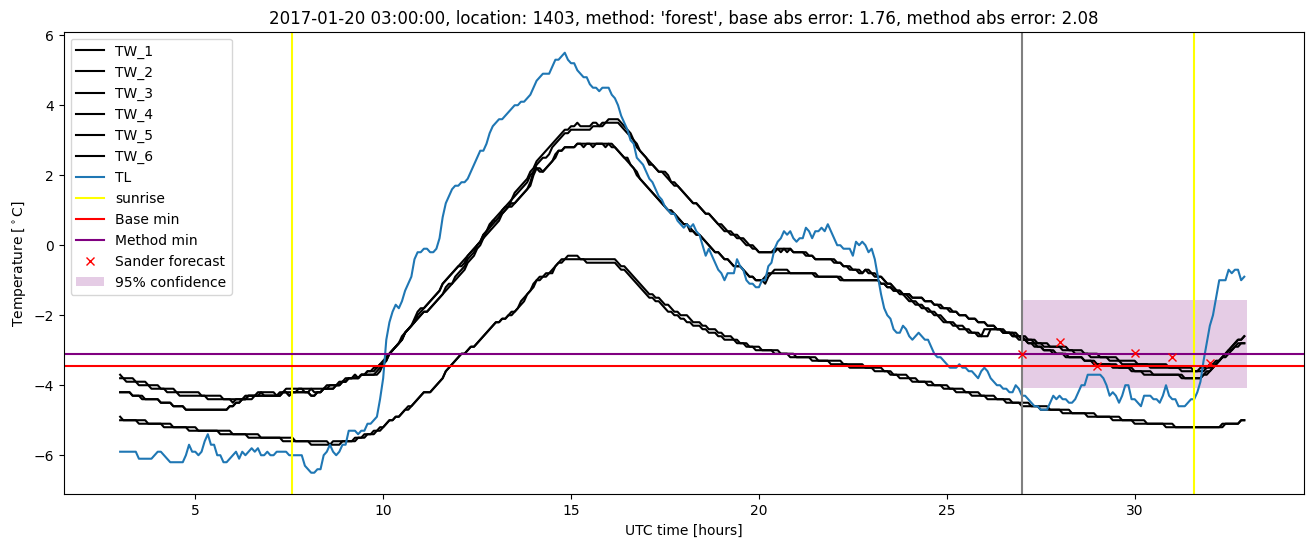
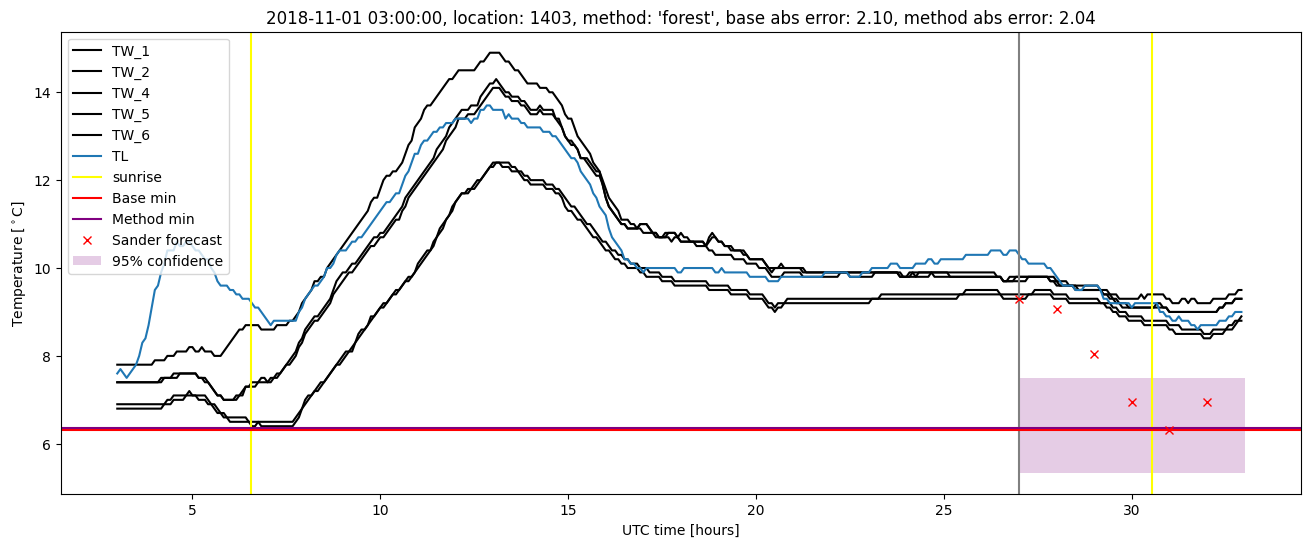
Random forest plots
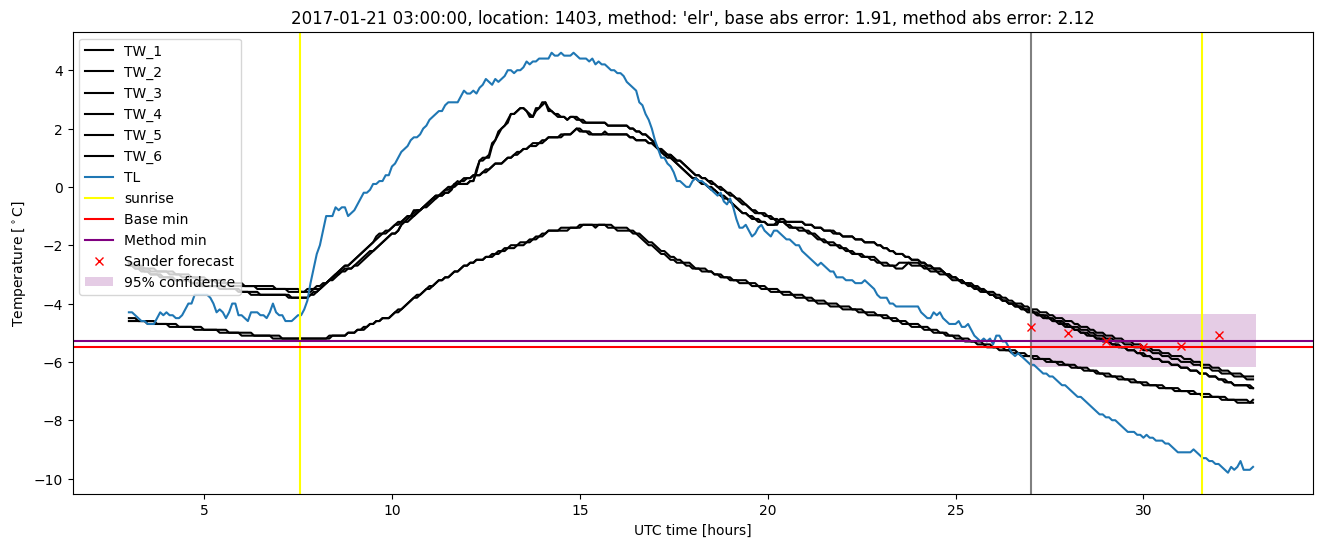
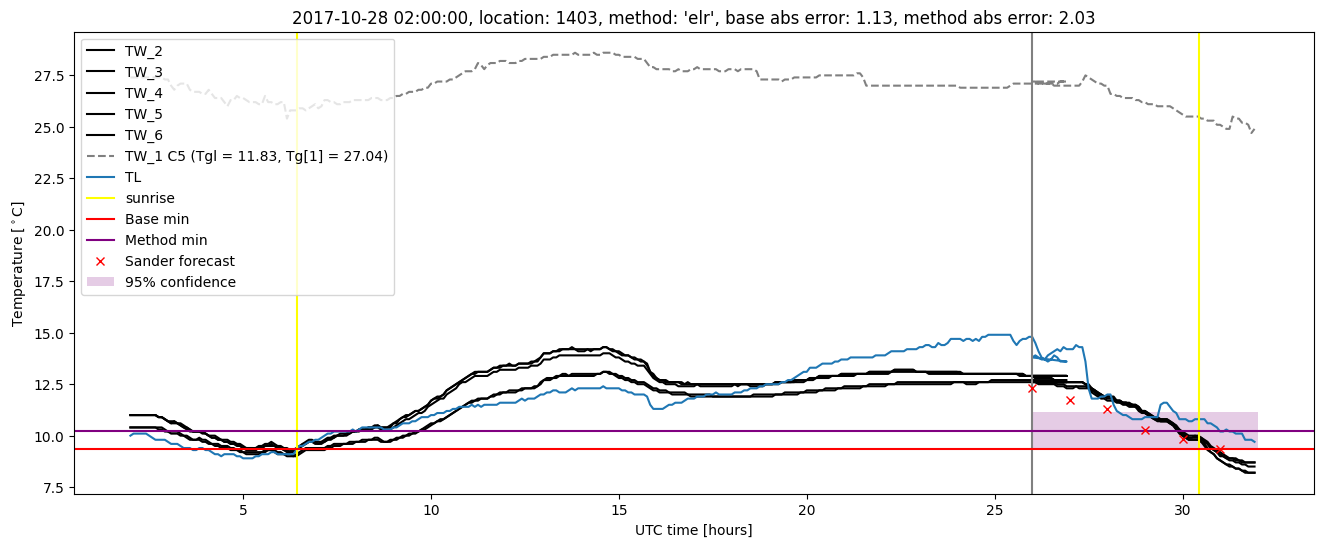
Extended logistic regression results
| names |
period |
power |
significance |
meanSquareError |
absError |
maxError |
CRPS |
IGN |
| baseline |
winter 2016 |
0.994 |
0.100 |
0.328 |
0.426 |
1.938 |
NaN |
NaN |
| elr |
winter 2016 |
0.983 |
0.033 |
0.327 |
0.436 |
1.973 |
0.538 |
2.994 |
| baseline |
winter 2017 |
0.991 |
0.021 |
0.522 |
0.518 |
2.550 |
NaN |
NaN |
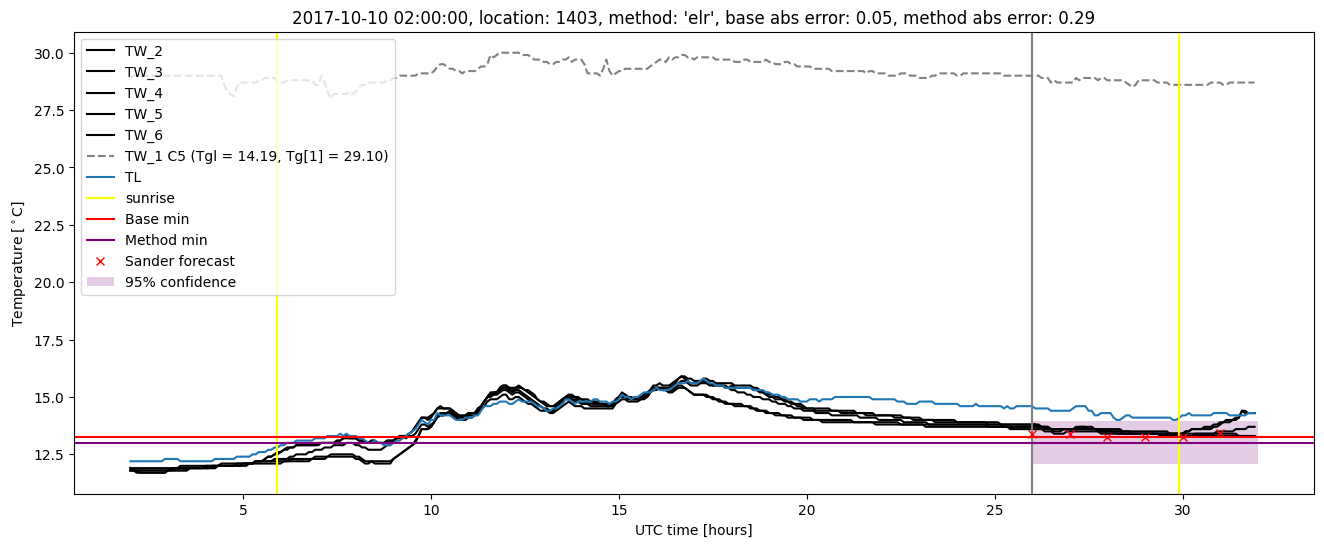
| elr |
winter 2017 |
0.991 |
0.000e+00 |
0.473 |
0.494 |
2.120 |
0.520 |
3.643 |
| baseline |
winter 2018 |
0.977 |
0.139 |
0.402 |
0.449 |
2.445 |
NaN |
NaN |
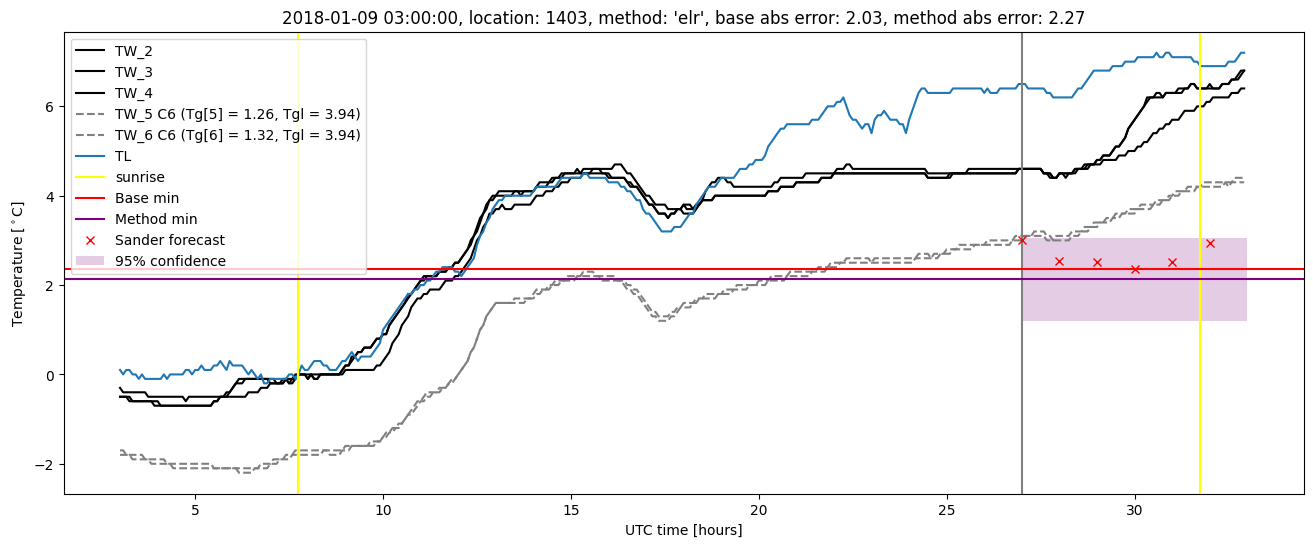
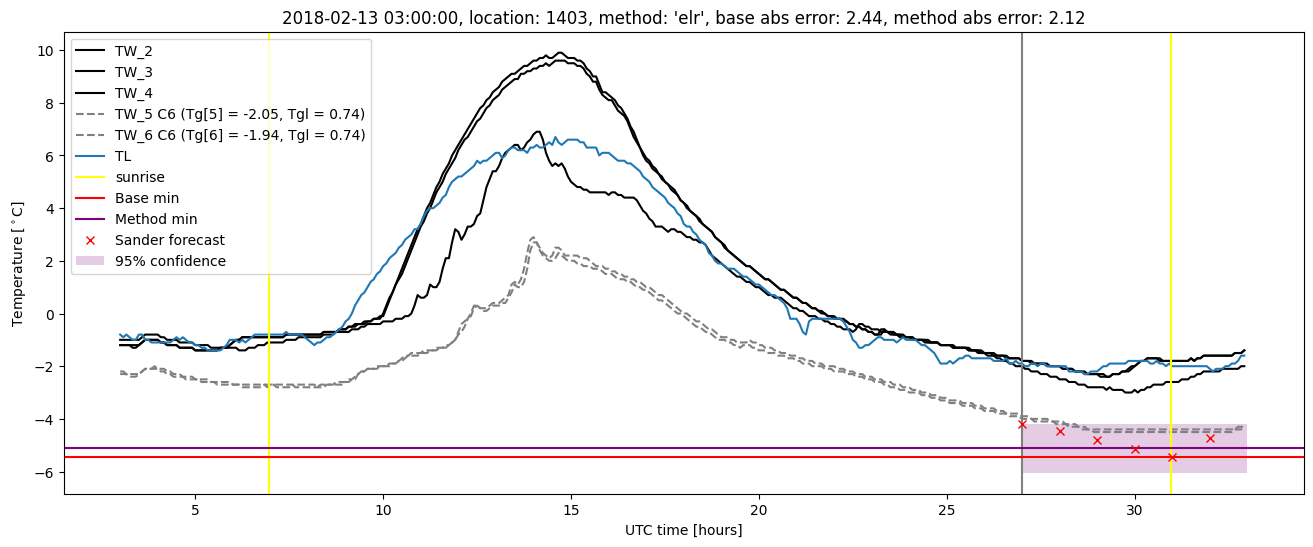
| elr |
winter 2018 |
0.977 |
0.056 |
0.396 |
0.458 |
2.275 |
0.547 |
3.714 |
| baseline |
winter 2019 |
0.982 |
0.045 |
0.365 |
0.406 |
2.441 |
NaN |
NaN |
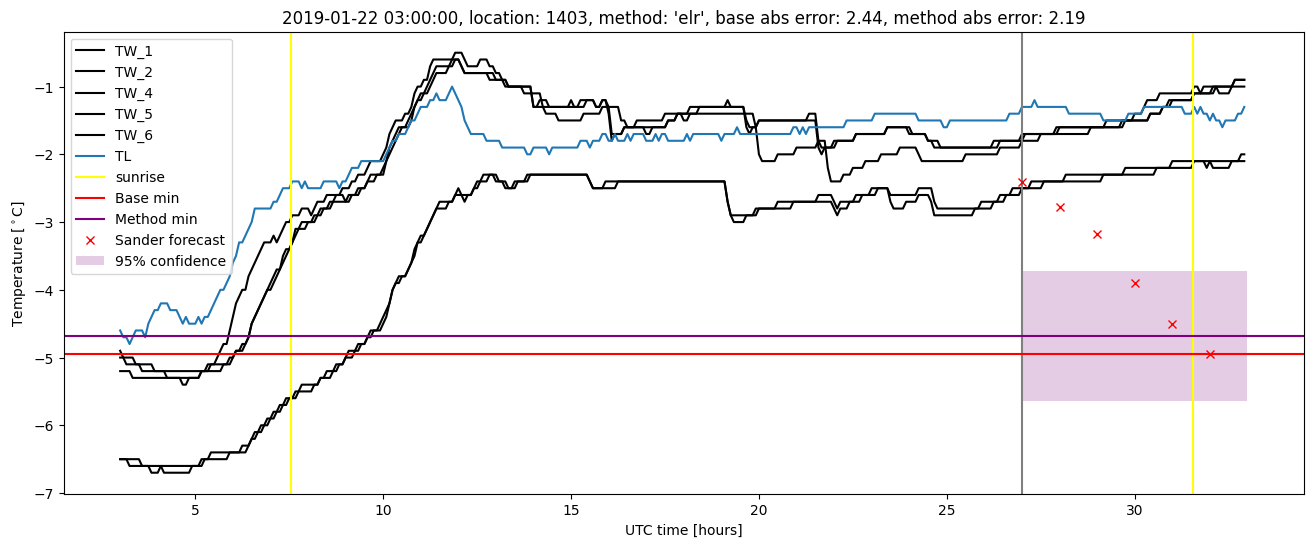
| elr |
winter 2019 |
1.000 |
0.091 |
0.301 |
0.396 |
2.188 |
0.511 |
2.889 |
| baseline |
all |
0.987 |
0.074 |
0.399 |
0.449 |
2.550 |
NaN |
NaN |
| elr |
all |
0.987 |
0.037 |
0.373 |
0.447 |
2.275 |
0.530 |
3.304 |
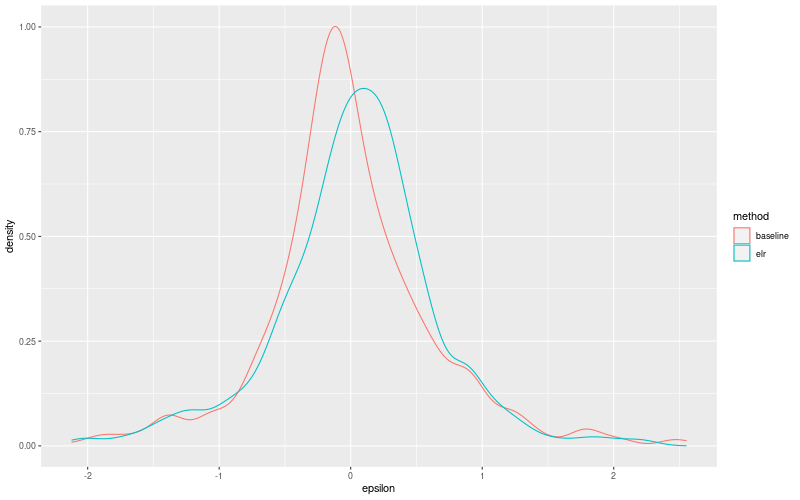
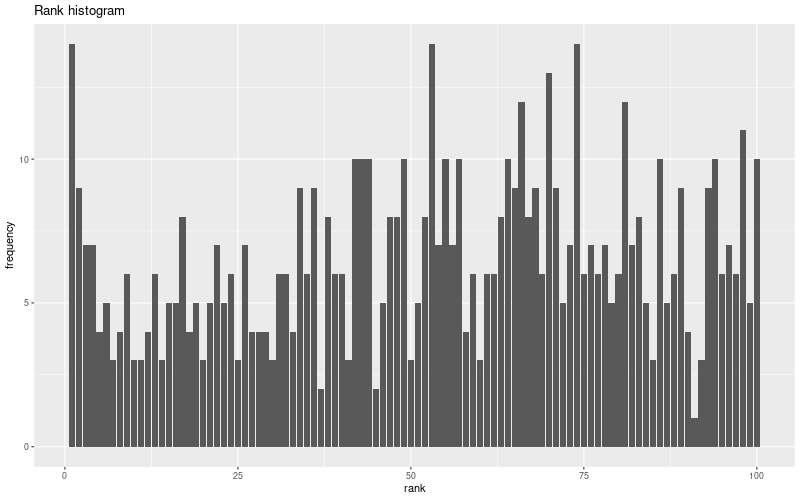
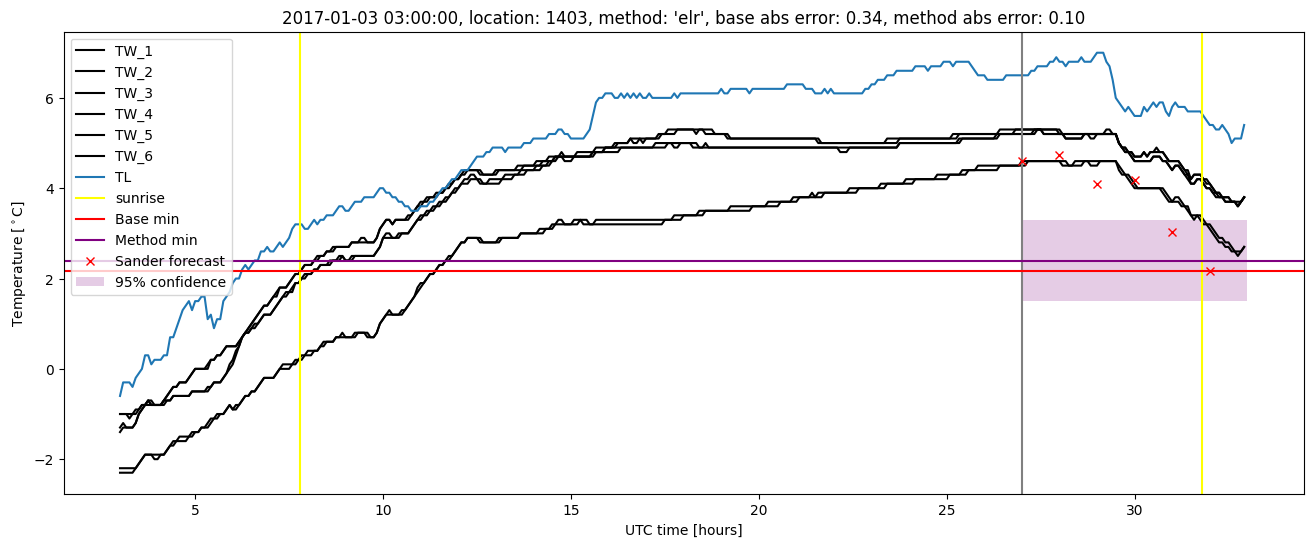
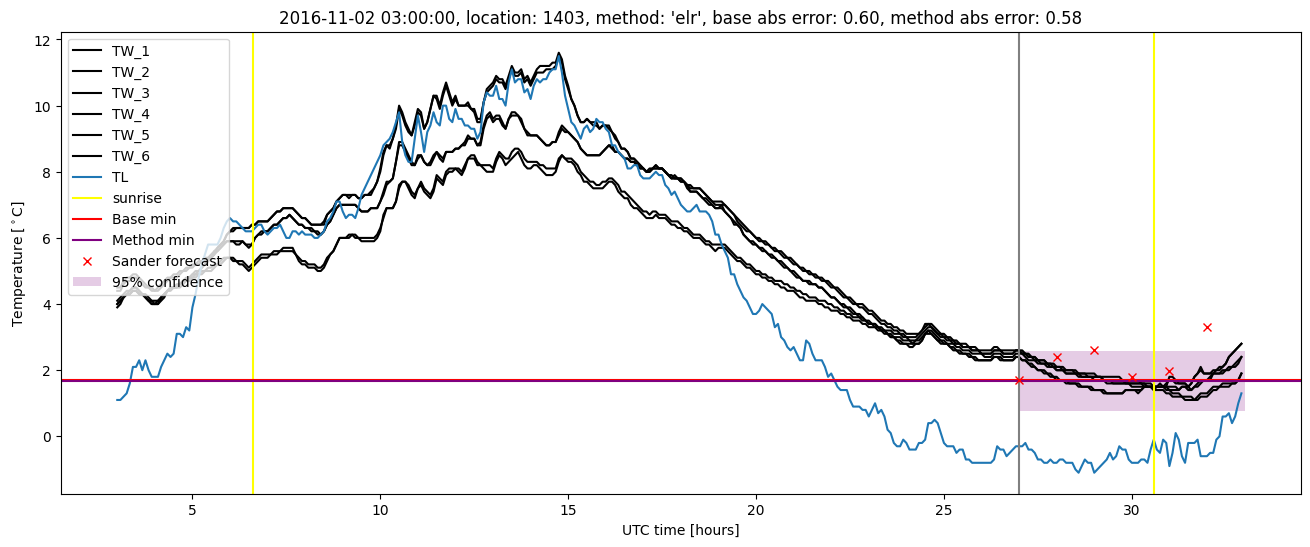
Extended logistic regression plots