GMS location: 1402
Random forest results
| names |
period |
power |
significance |
meanSquareError |
absError |
maxError |
CRPS |
IGN |
| baseline |
winter 2016 |
1.000 |
0.057 |
0.319 |
0.428 |
3.000 |
NaN |
NaN |
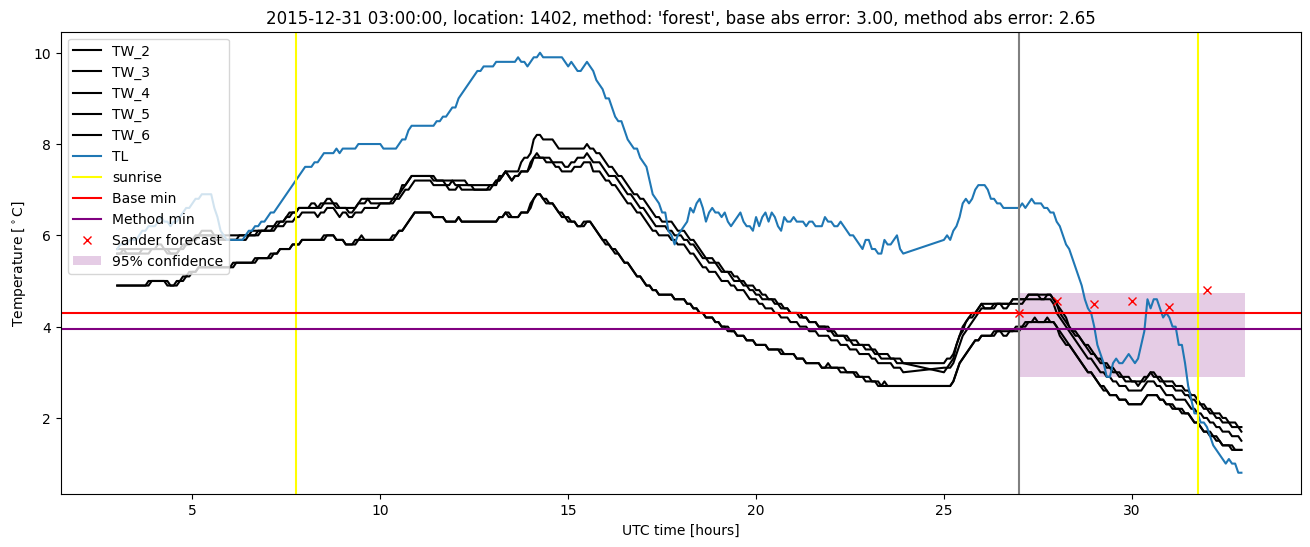
| forest |
winter 2016 |
0.974 |
0.000e+00 |
0.289 |
0.402 |
2.650 |
0.519 |
3.324 |
| baseline |
winter 2017 |
0.973 |
0.046 |
0.407 |
0.450 |
2.695 |
NaN |
NaN |
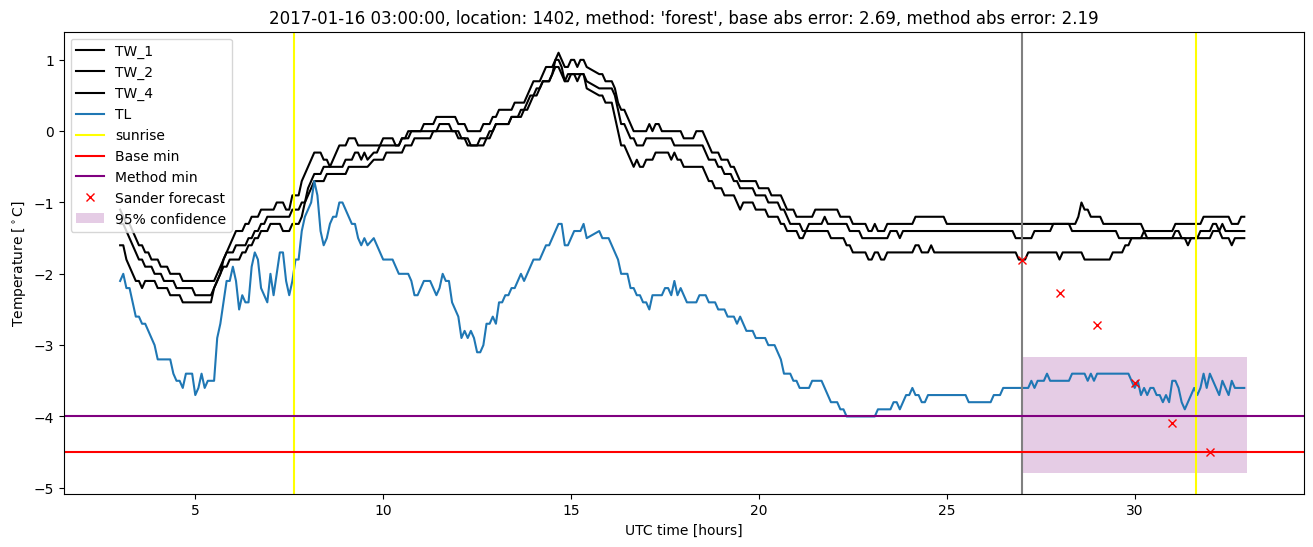
| forest |
winter 2017 |
0.954 |
0.070 |
0.359 |
0.442 |
2.192 |
0.502 |
2.937 |
| baseline |
winter 2018 |
0.992 |
0.118 |
0.427 |
0.490 |
1.701 |
NaN |
NaN |
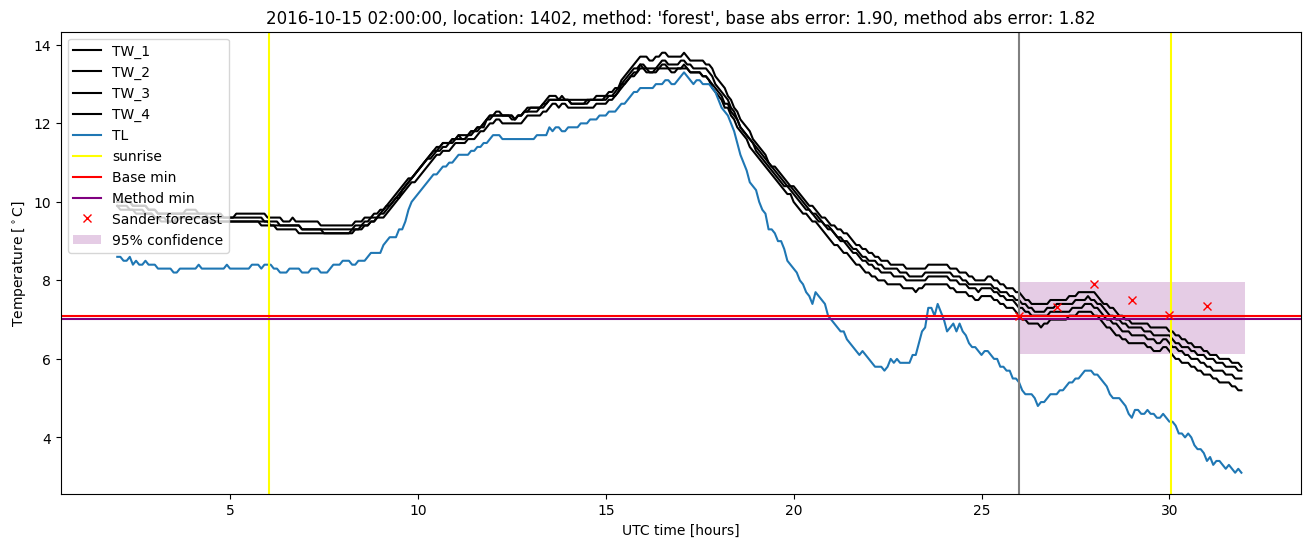
| forest |
winter 2018 |
0.985 |
0.118 |
0.364 |
0.474 |
1.791 |
0.528 |
3.209 |
| baseline |
winter 2019 |
0.985 |
0.000e+00 |
0.421 |
0.468 |
3.302 |
NaN |
NaN |
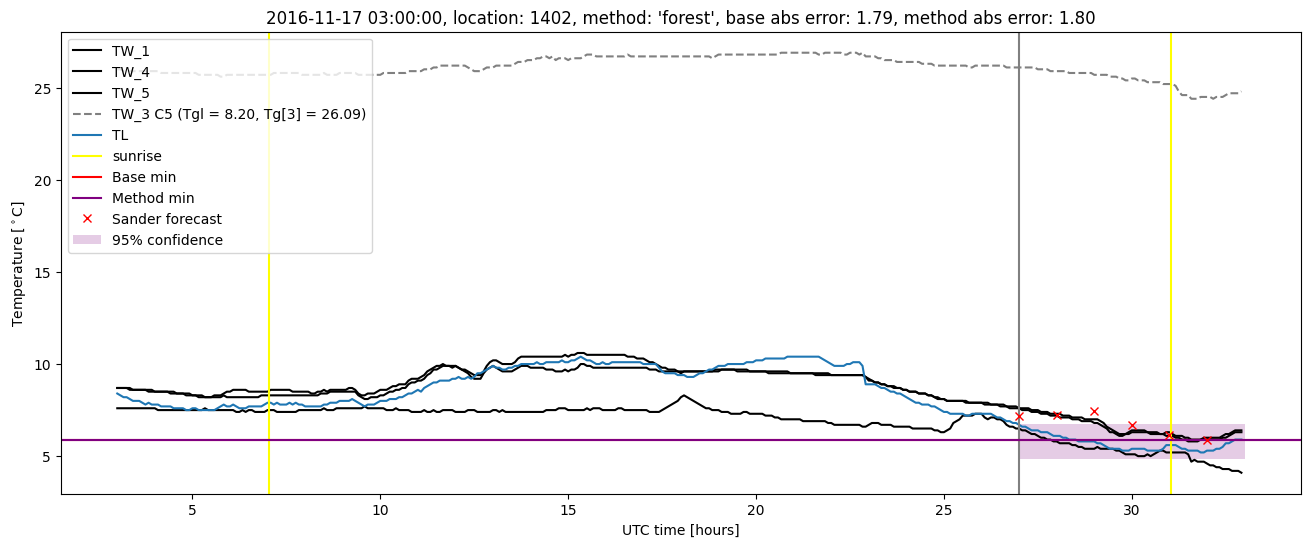
| forest |
winter 2019 |
0.985 |
0.115 |
0.347 |
0.436 |
3.039 |
0.491 |
3.148 |
| baseline |
all |
0.989 |
0.058 |
0.390 |
0.458 |
3.302 |
NaN |
NaN |
| forest |
all |
0.976 |
0.072 |
0.338 |
0.437 |
3.039 |
0.510 |
3.165 |
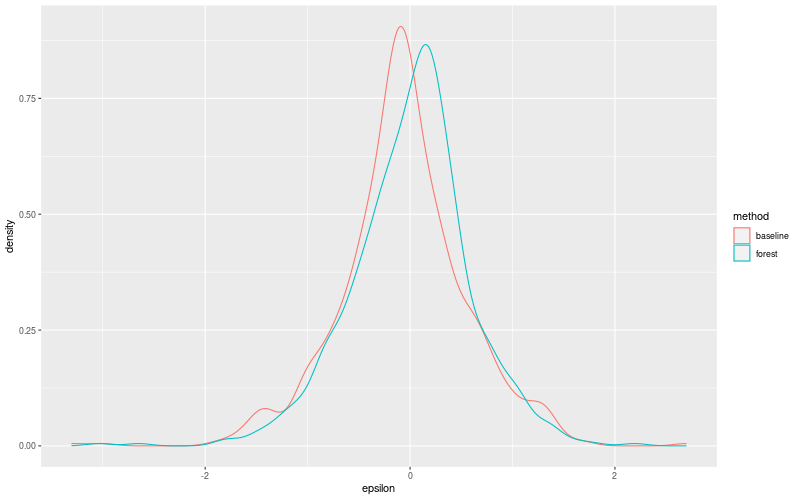
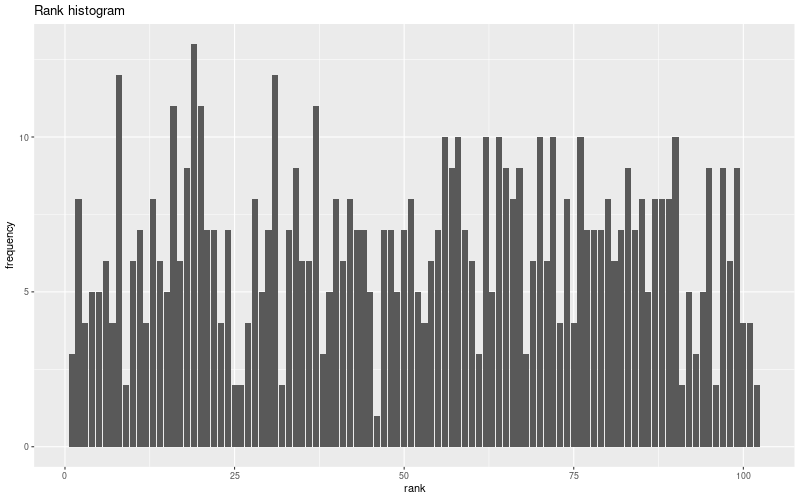
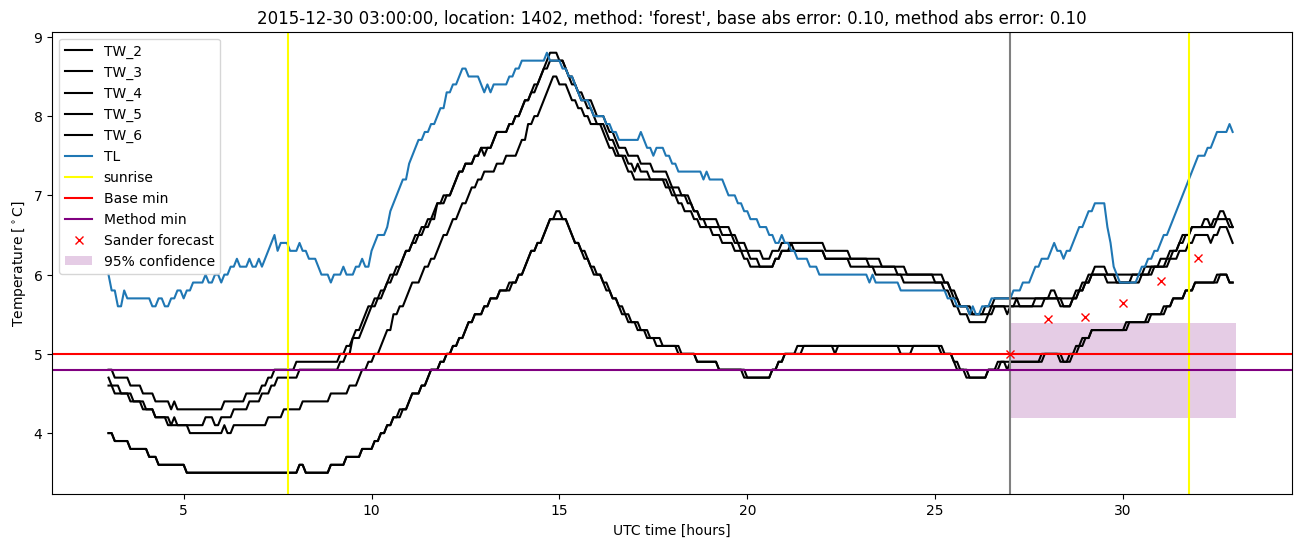
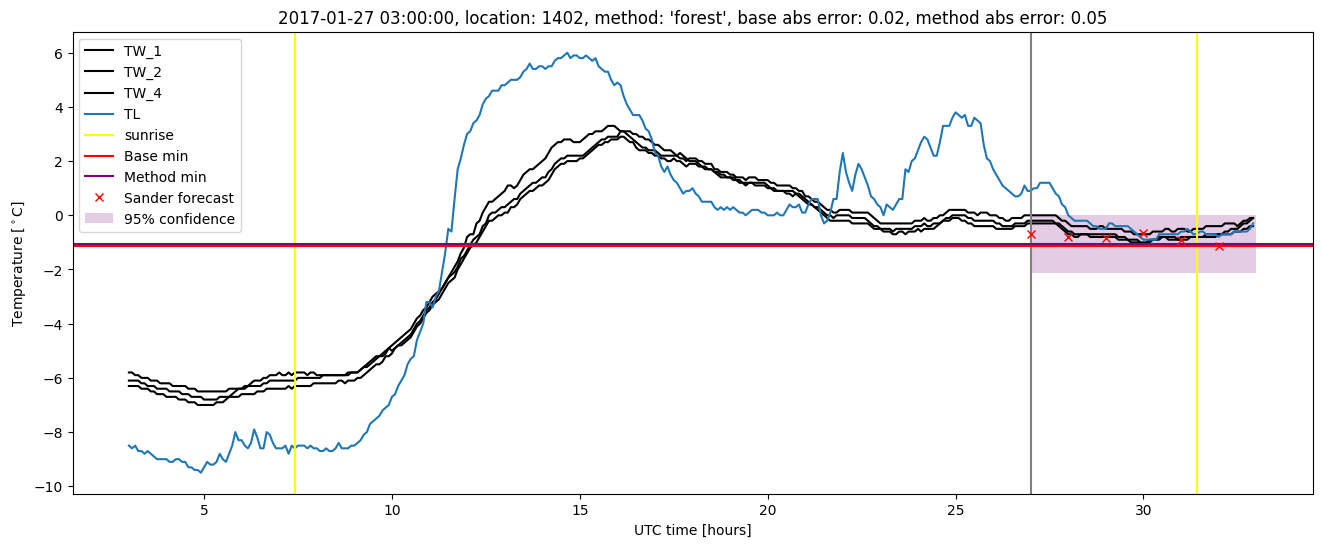
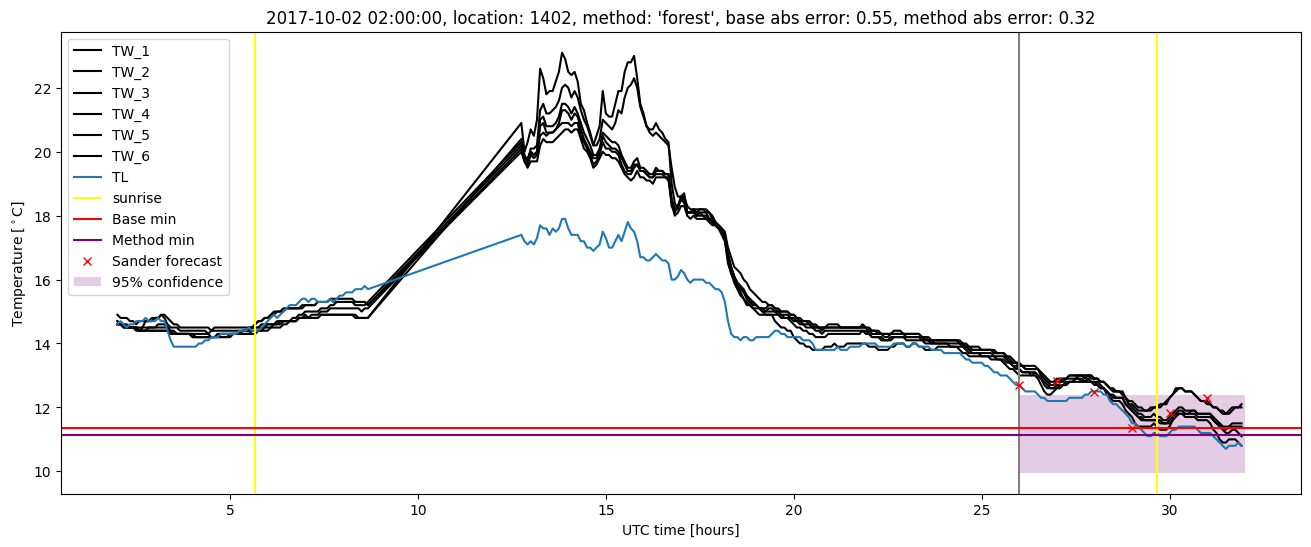
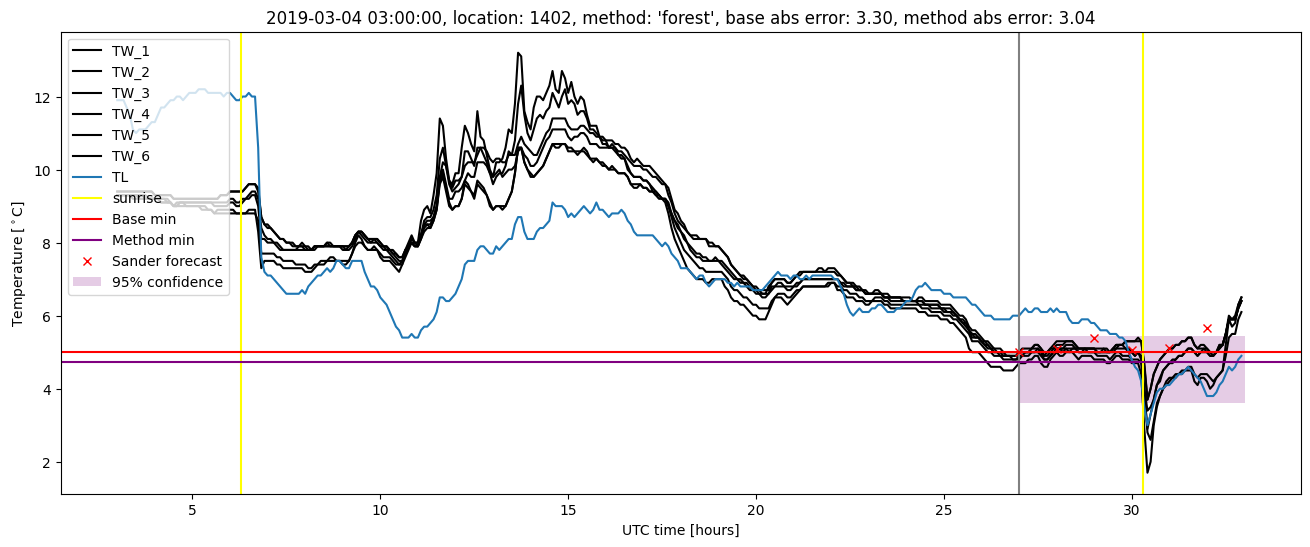
Random forest plots
Extended logistic regression results
| names |
period |
power |
significance |
meanSquareError |
absError |
maxError |
CRPS |
IGN |
| baseline |
winter 2016 |
1.000 |
0.057 |
0.319 |
0.428 |
3.000 |
NaN |
NaN |
| elr |
winter 2016 |
0.981 |
0.000e+00 |
0.324 |
0.418 |
2.807 |
0.534 |
3.138 |
| baseline |
winter 2017 |
0.973 |
0.046 |
0.407 |
0.450 |
2.695 |
NaN |
NaN |
| elr |
winter 2017 |
0.973 |
0.046 |
0.378 |
0.447 |
2.444 |
0.539 |
3.564 |
| baseline |
winter 2018 |
0.992 |
0.118 |
0.427 |
0.490 |
1.701 |
NaN |
NaN |
| elr |
winter 2018 |
0.992 |
0.088 |
0.356 |
0.442 |
1.655 |
0.593 |
4.295 |
| baseline |
winter 2019 |
0.985 |
0.000e+00 |
0.421 |
0.468 |
3.302 |
NaN |
NaN |
| elr |
winter 2019 |
0.971 |
0.115 |
0.326 |
0.424 |
2.855 |
0.542 |
3.341 |
| baseline |
all |
0.989 |
0.058 |
0.390 |
0.458 |
3.302 |
NaN |
NaN |
| elr |
all |
0.979 |
0.058 |
0.344 |
0.432 |
2.855 |
0.552 |
3.568 |
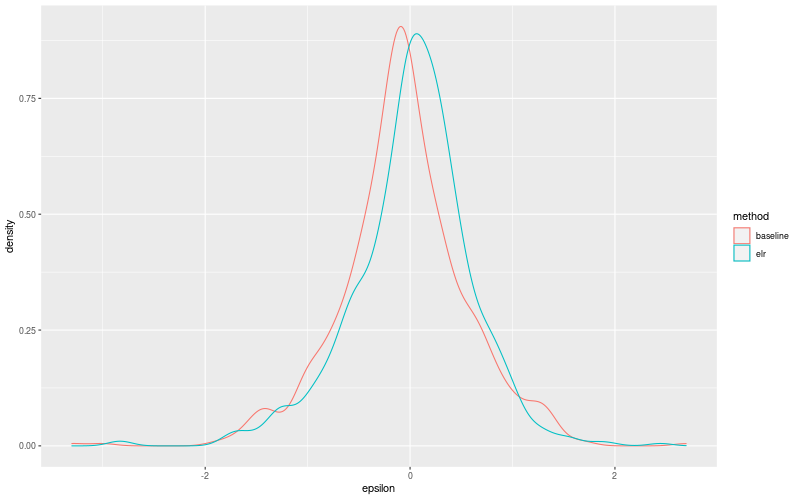
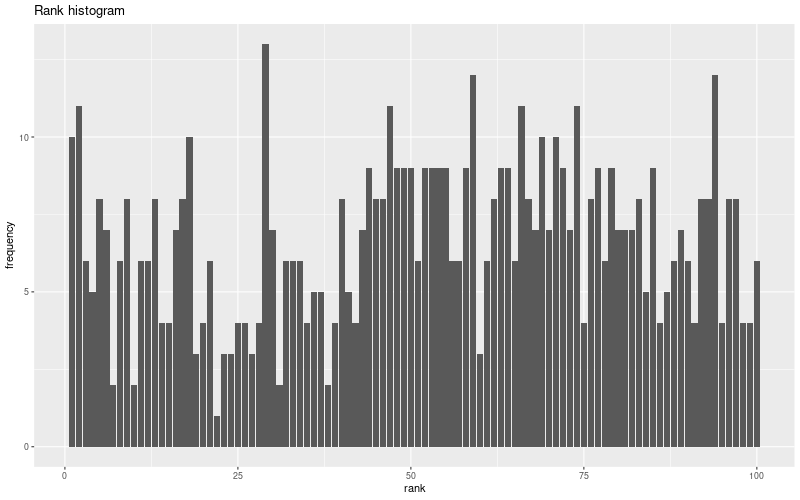
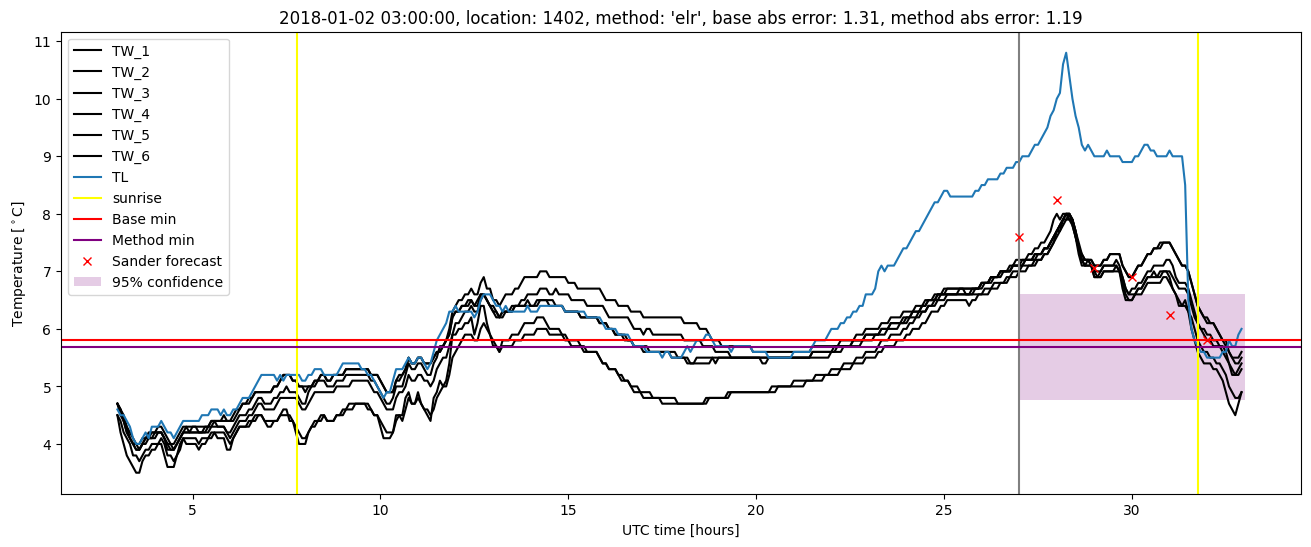
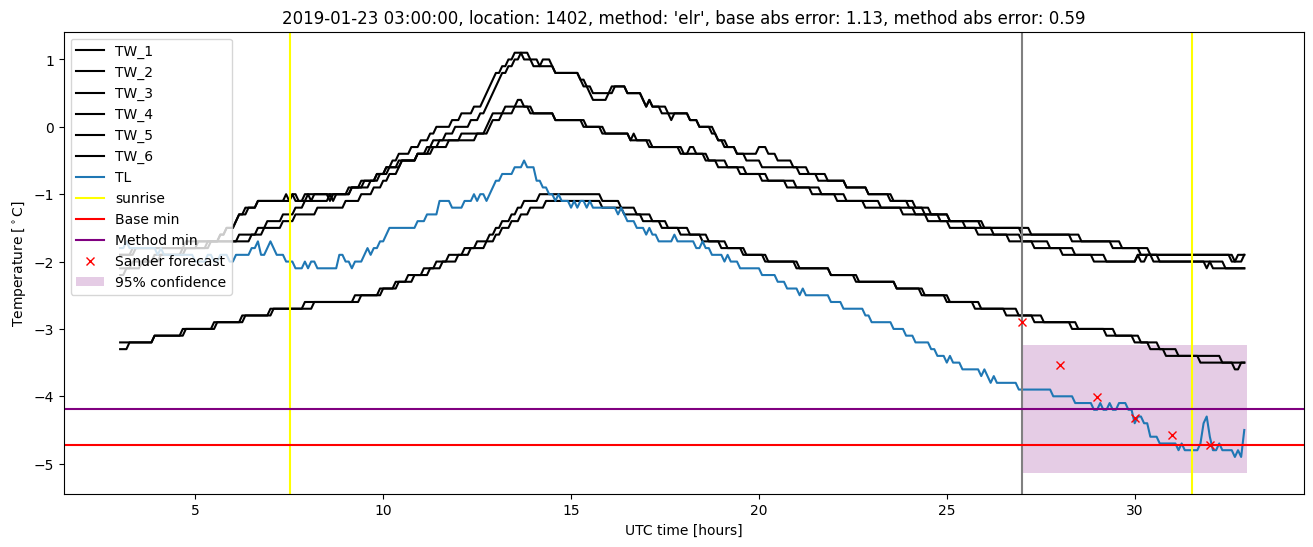
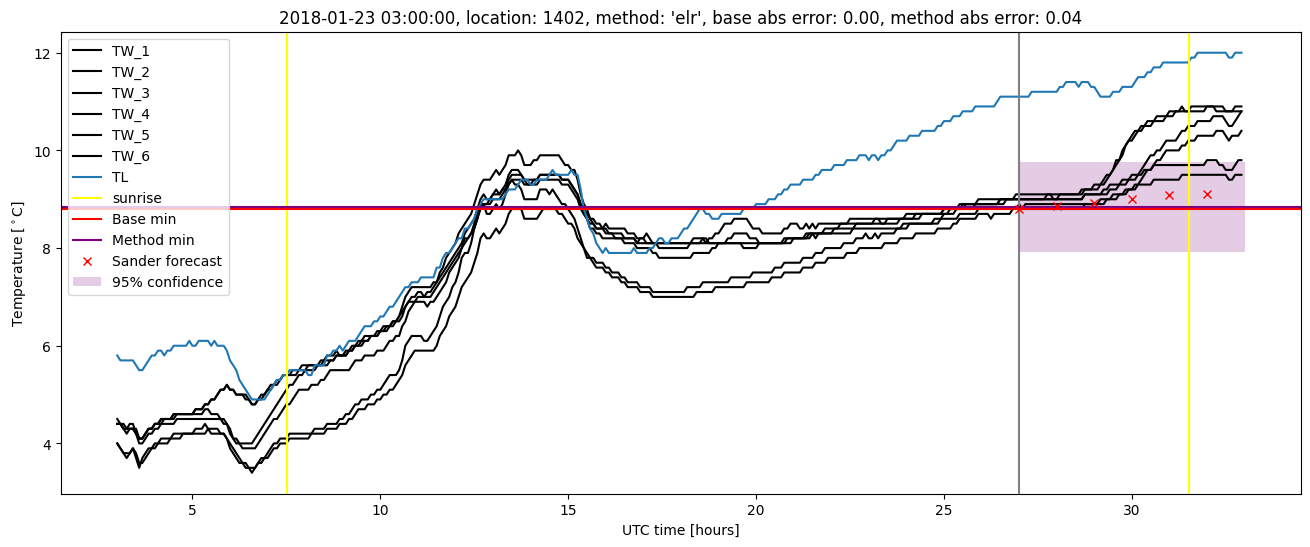
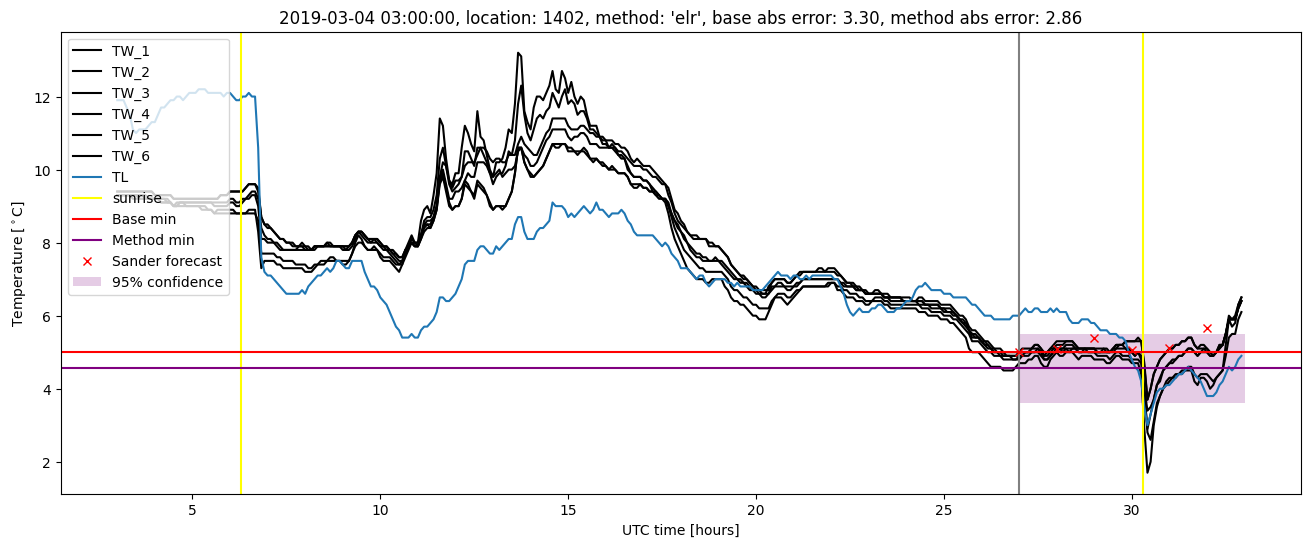
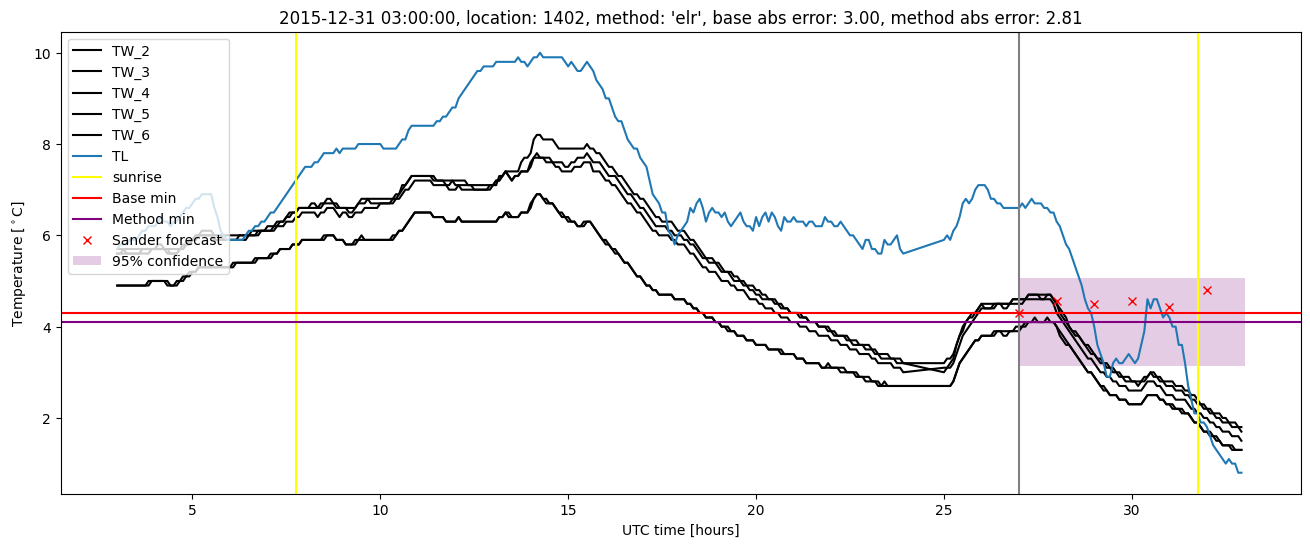
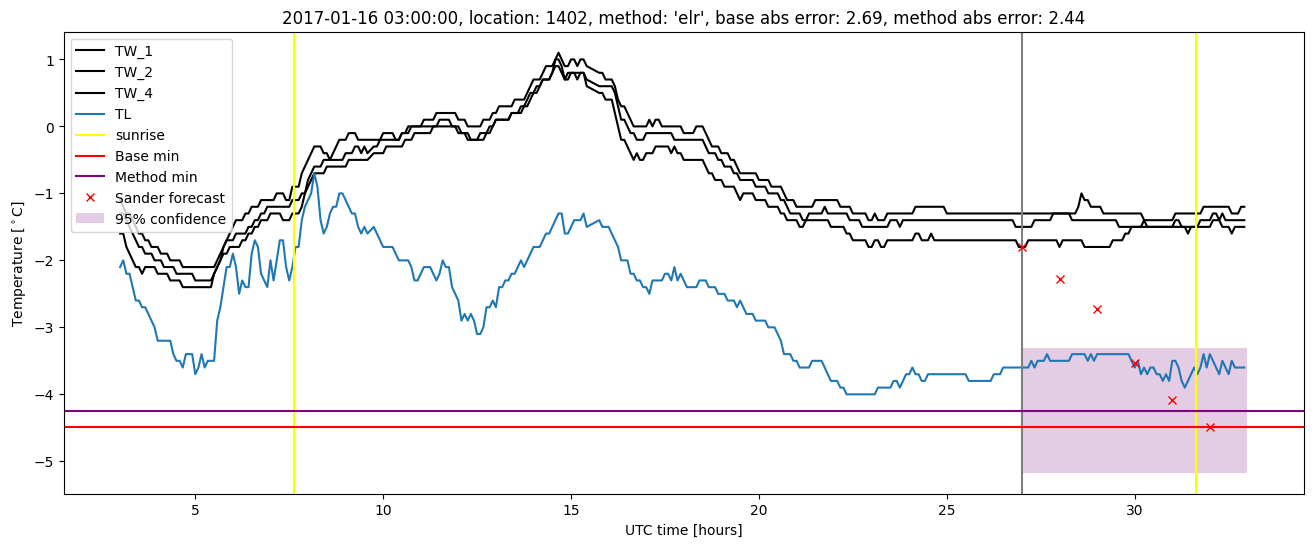
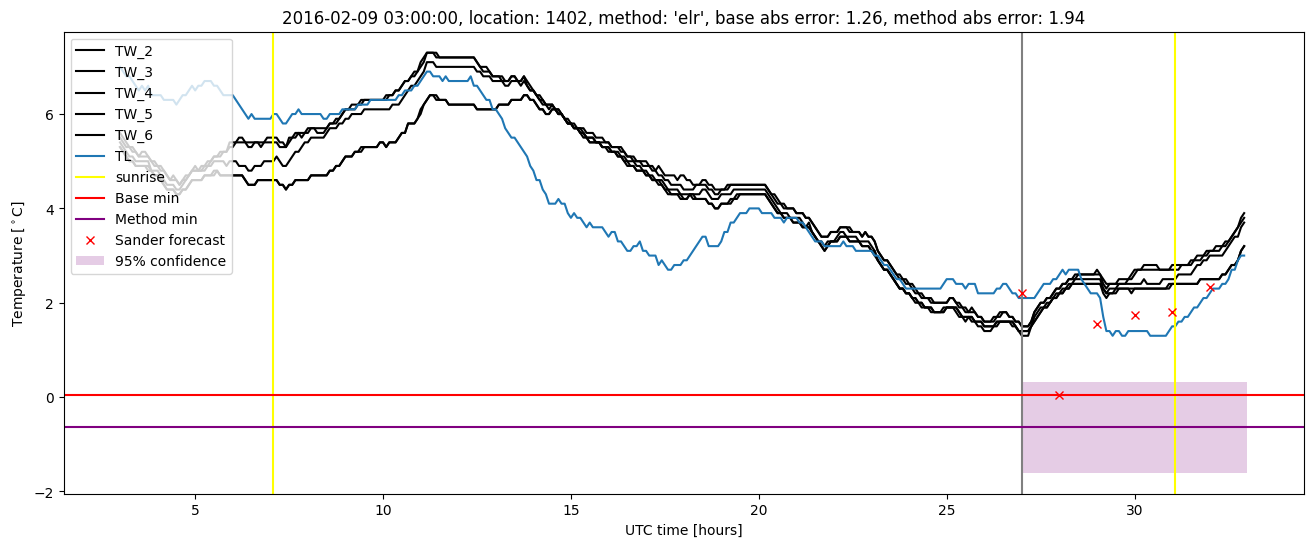
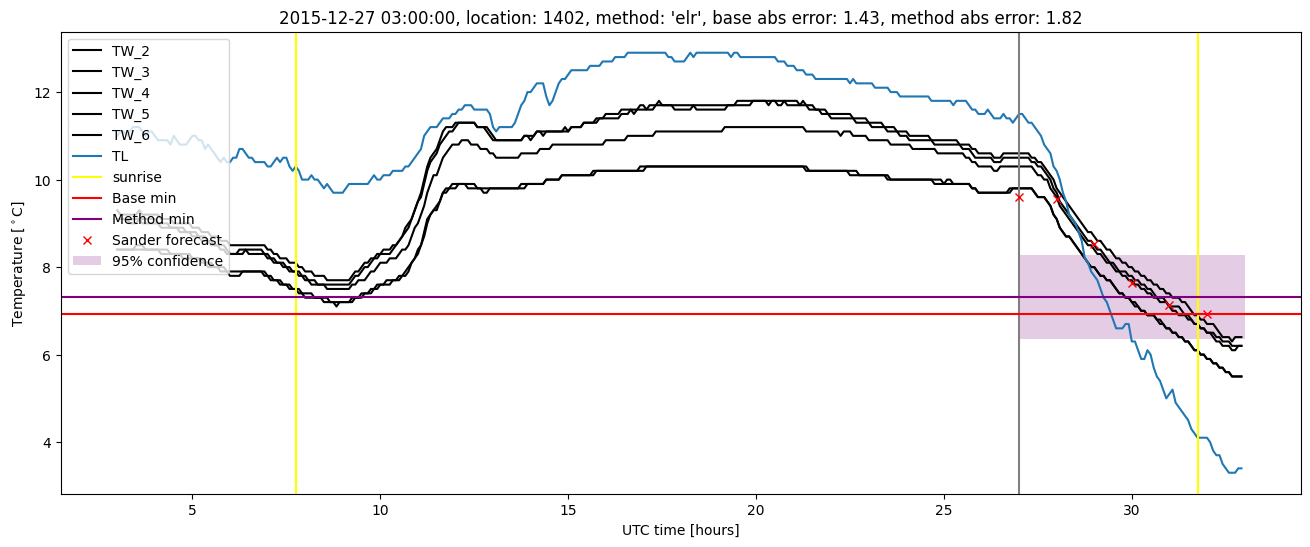
Extended logistic regression plots