GMS location: 1401
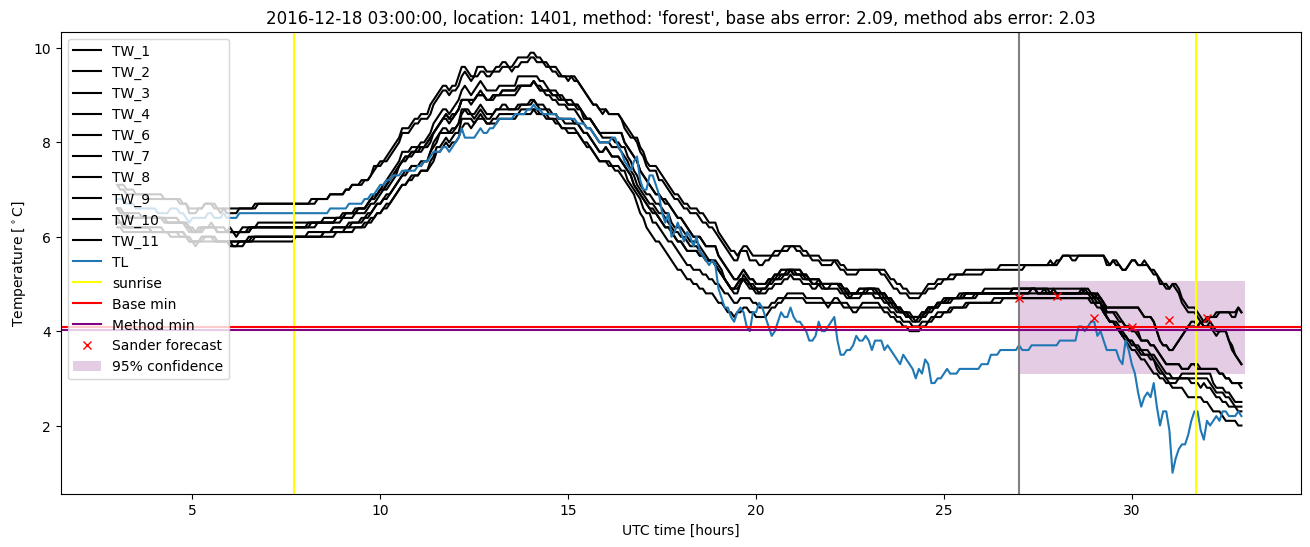
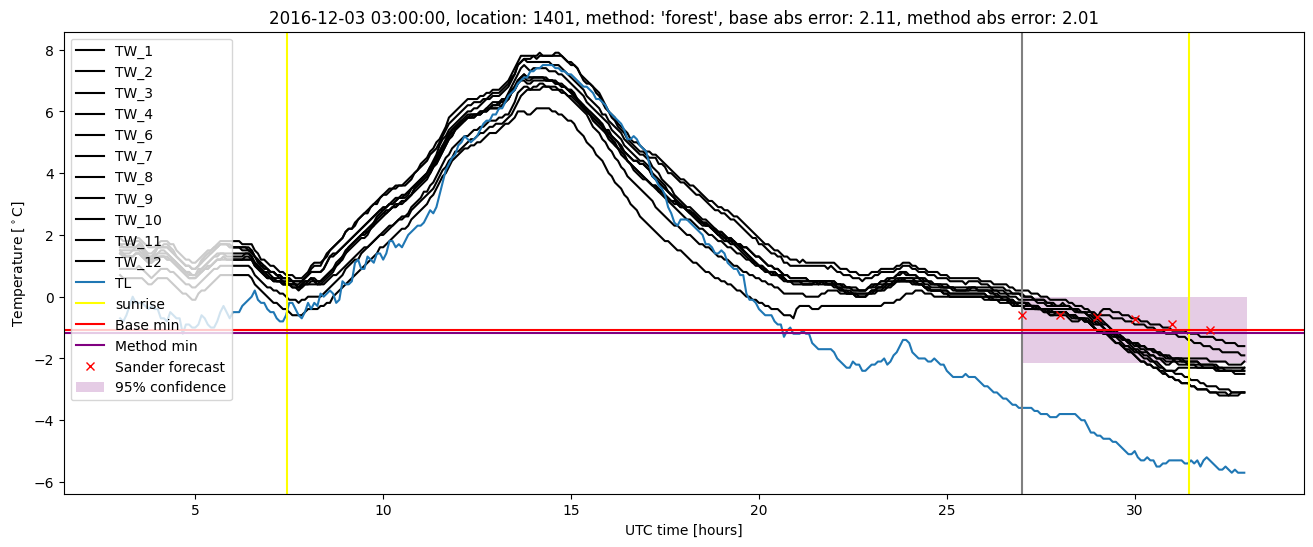
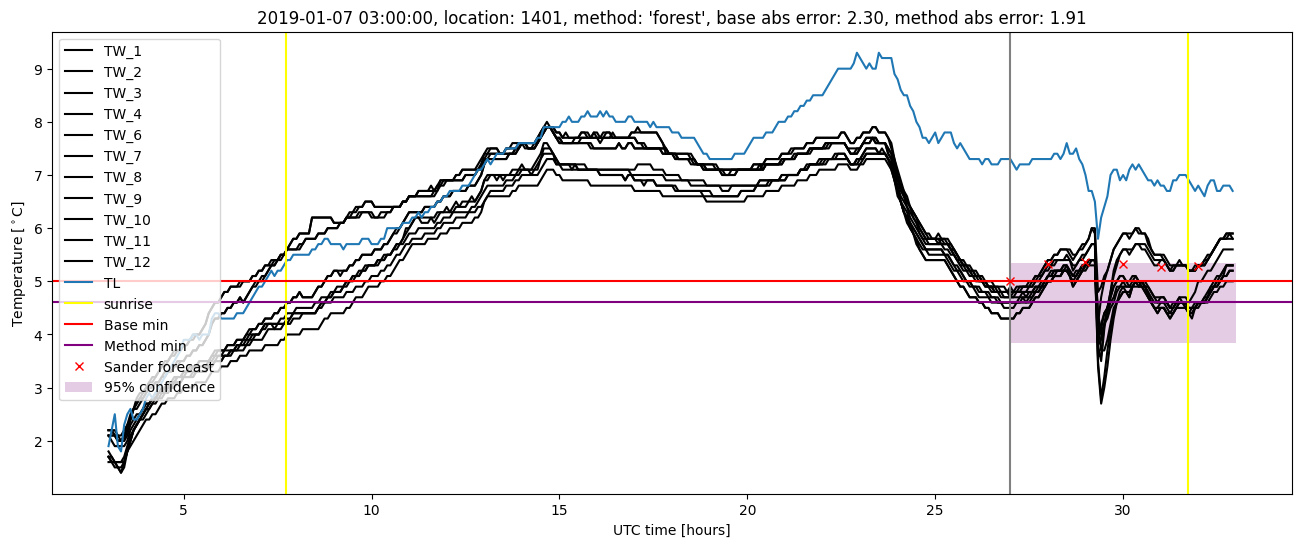
Random forest results
| names |
period |
power |
significance |
meanSquareError |
absError |
maxError |
CRPS |
IGN |
| baseline |
winter 2016 |
0.988 |
0.033 |
0.352 |
0.447 |
2.719 |
NaN |
NaN |
| forest |
winter 2016 |
0.988 |
0.000e+00 |
0.322 |
0.429 |
2.362 |
0.542 |
3.516 |
| baseline |
winter 2017 |
0.973 |
0.025 |
0.458 |
0.478 |
2.207 |
NaN |
NaN |
| forest |
winter 2017 |
0.955 |
0.025 |
0.392 |
0.455 |
2.031 |
0.531 |
2.990 |
| baseline |
winter 2018 |
1.000 |
0.146 |
0.386 |
0.463 |
1.849 |
NaN |
NaN |
| forest |
winter 2018 |
0.991 |
0.098 |
0.300 |
0.415 |
1.513 |
0.522 |
2.881 |
| baseline |
winter 2019 |
0.993 |
0.059 |
0.376 |
0.450 |
2.301 |
NaN |
NaN |
| forest |
winter 2019 |
0.993 |
0.000e+00 |
0.315 |
0.431 |
1.905 |
0.516 |
3.131 |
| baseline |
all |
0.988 |
0.070 |
0.390 |
0.459 |
2.719 |
NaN |
NaN |
| forest |
all |
0.983 |
0.039 |
0.332 |
0.432 |
2.362 |
0.529 |
3.155 |
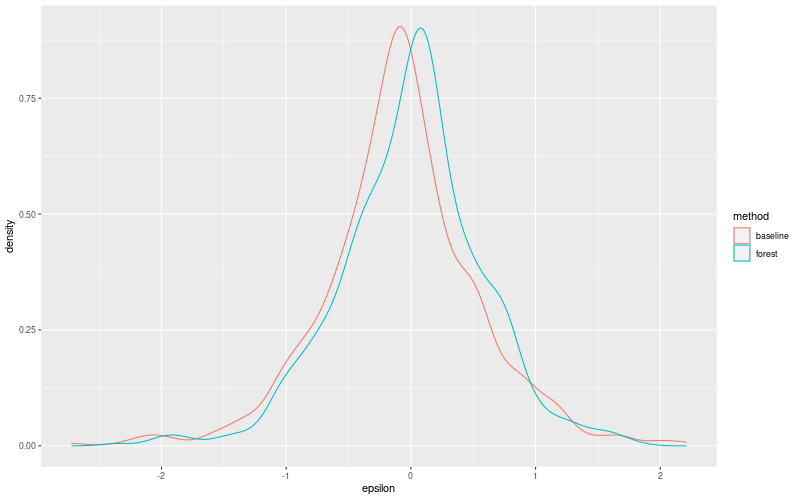
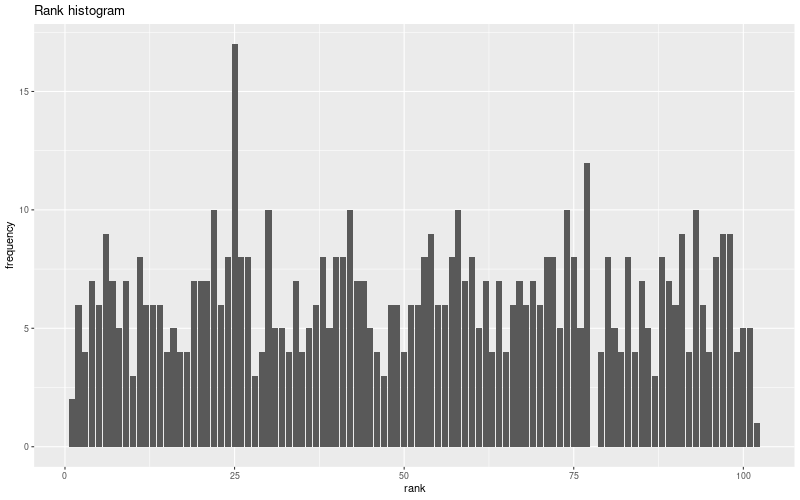
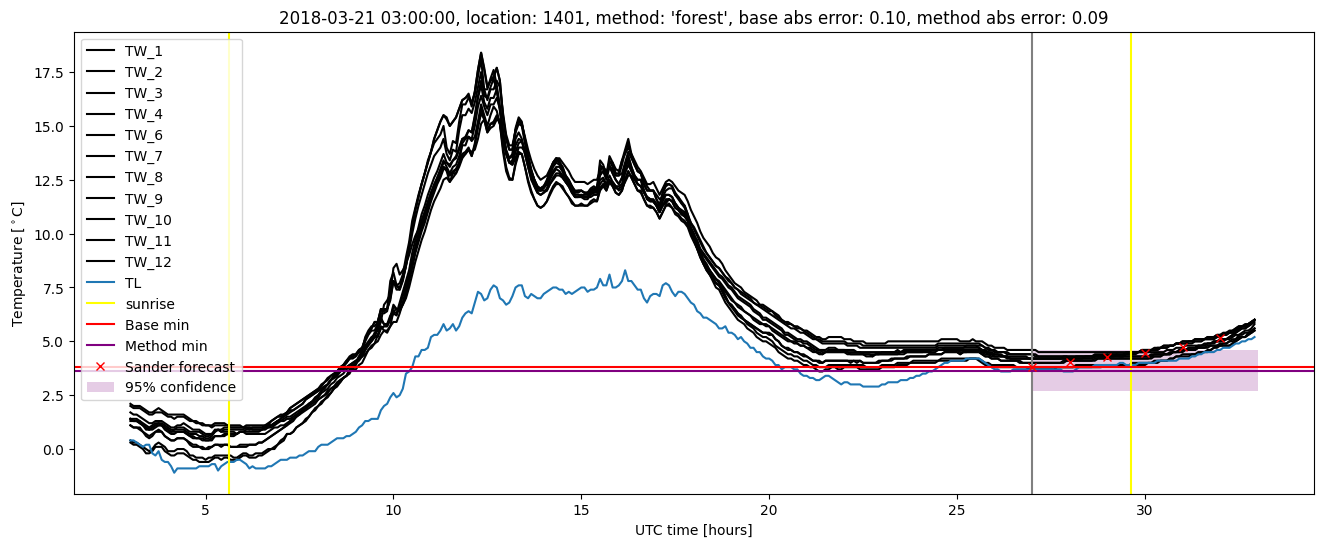
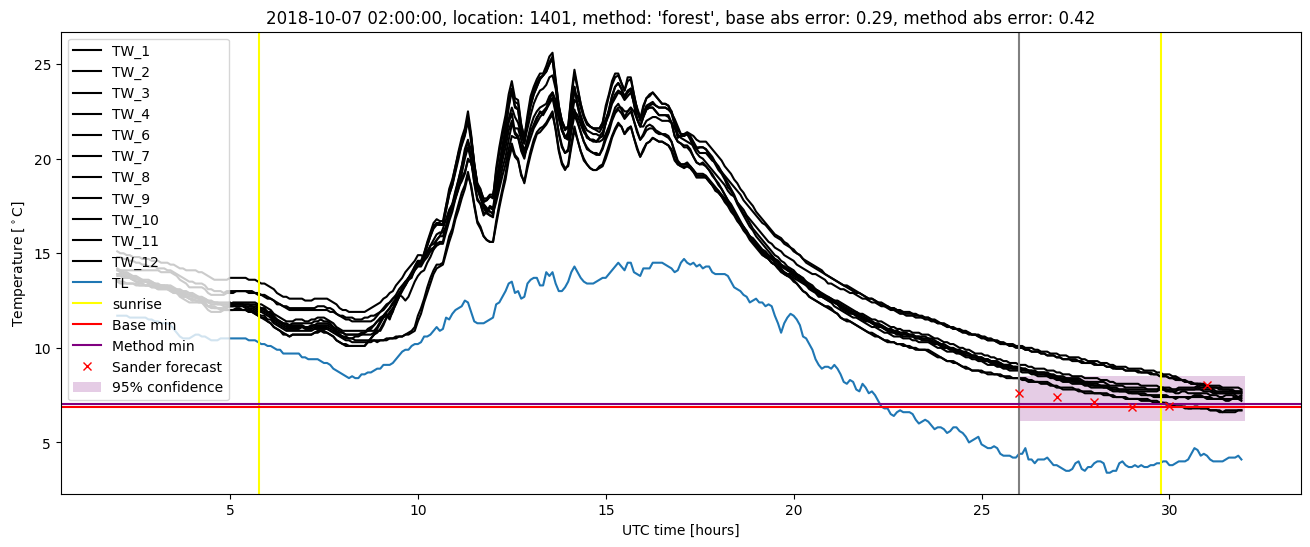
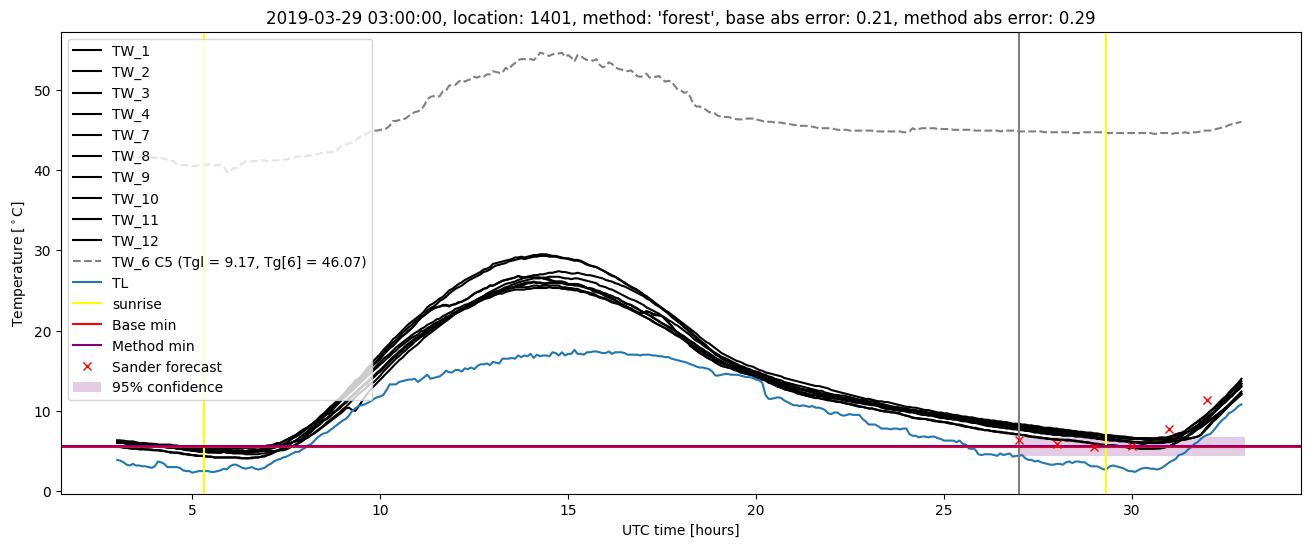
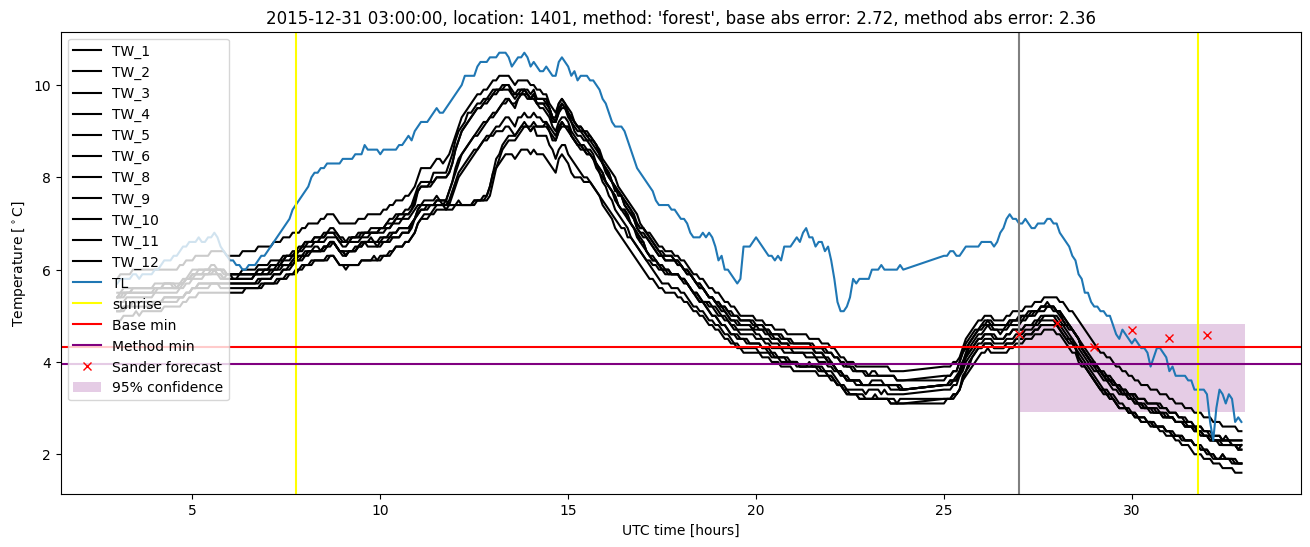
Random forest plots

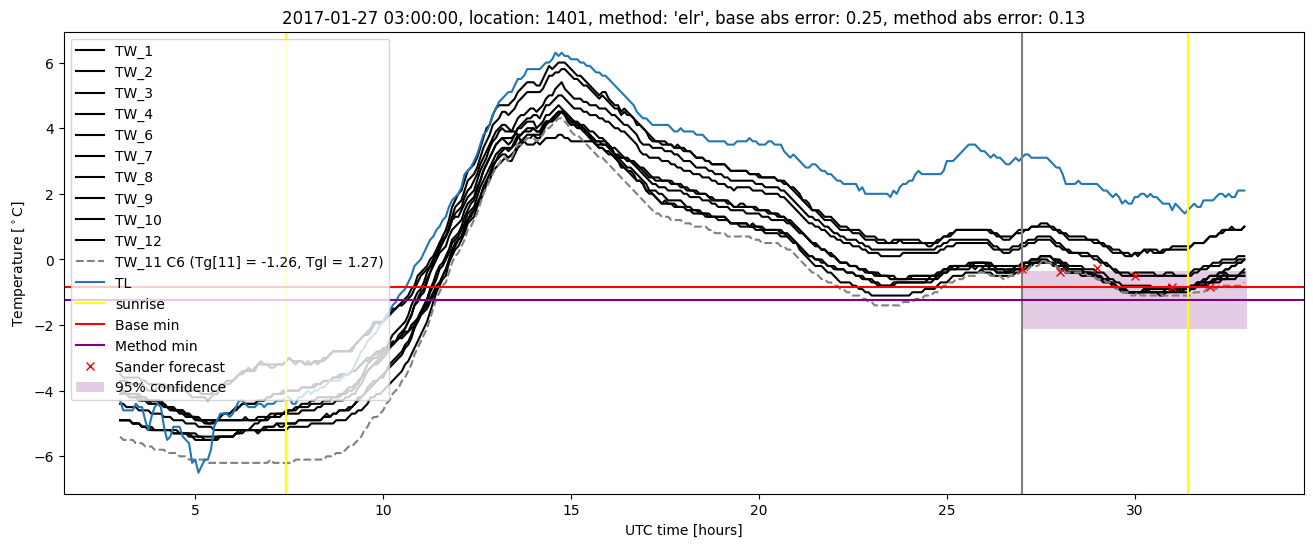
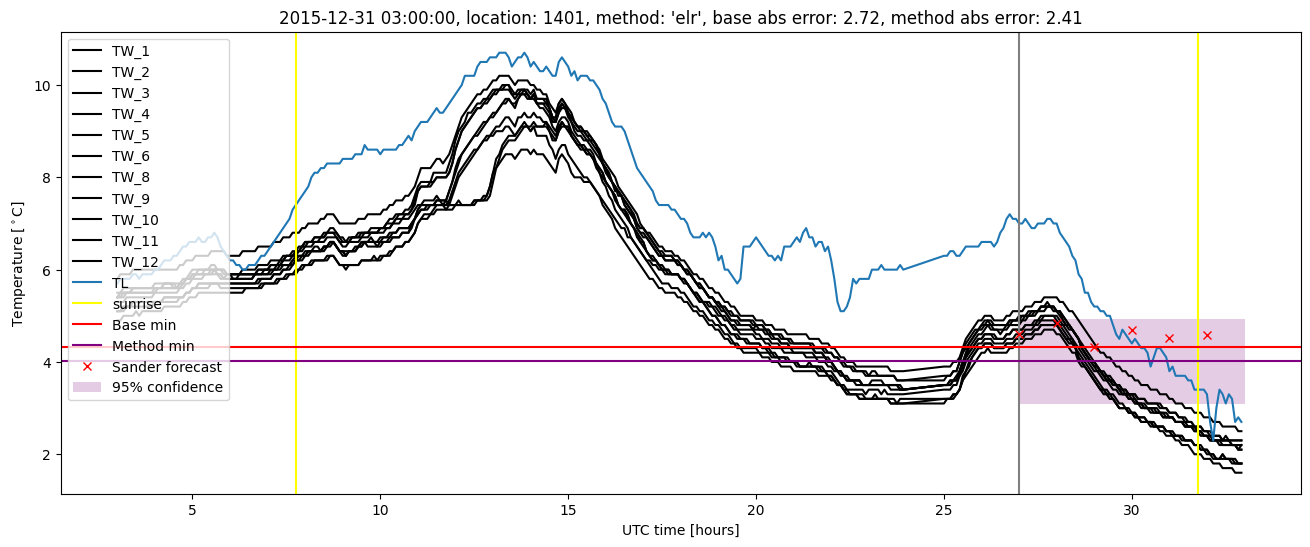
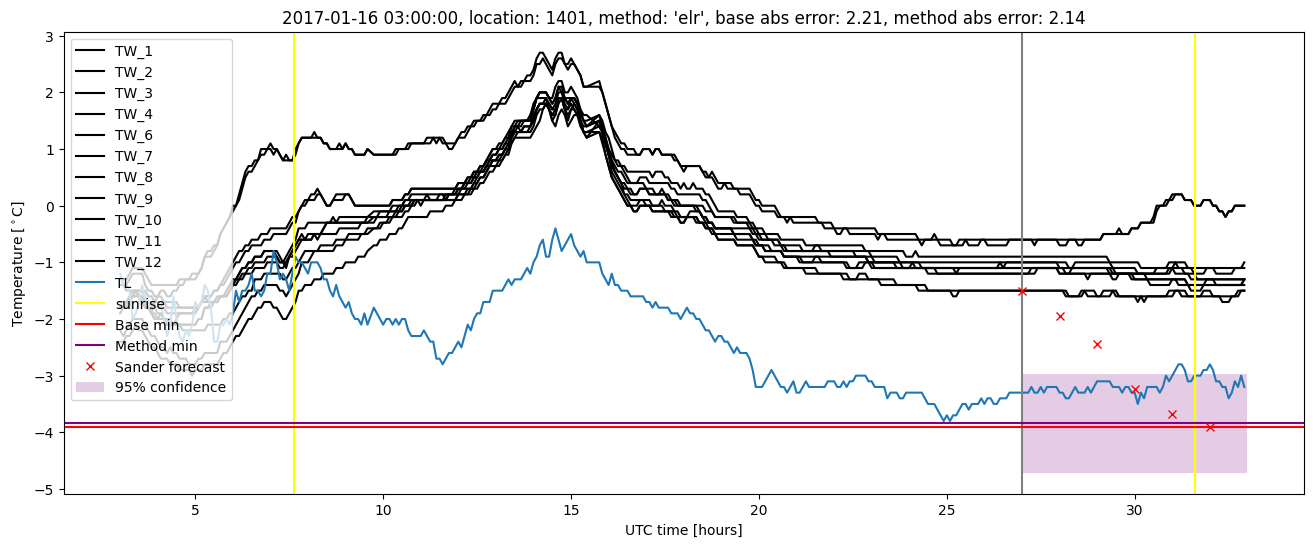
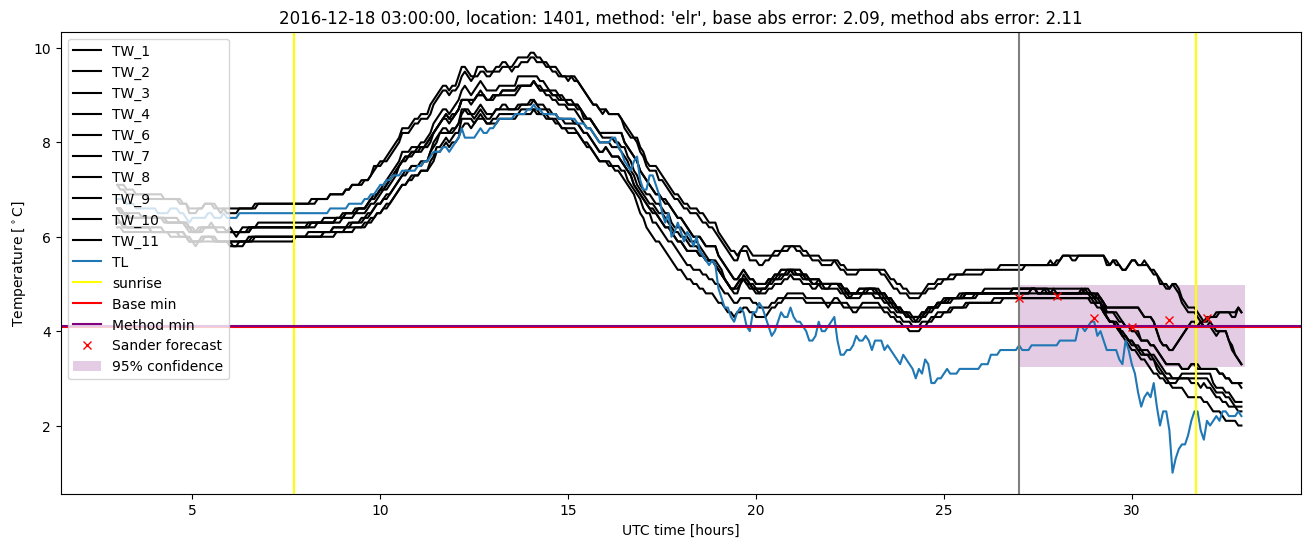
Extended logistic regression results
| names |
period |
power |
significance |
meanSquareError |
absError |
maxError |
CRPS |
IGN |
| baseline |
winter 2016 |
0.988 |
0.033 |
0.352 |
0.447 |
2.719 |
NaN |
NaN |
| elr |
winter 2016 |
0.982 |
0.000e+00 |
0.355 |
0.458 |
2.414 |
0.599 |
4.268 |
| baseline |
winter 2017 |
0.973 |
0.025 |
0.458 |
0.478 |
2.207 |
NaN |
NaN |
| elr |
winter 2017 |
0.964 |
0.025 |
0.446 |
0.489 |
2.139 |
0.612 |
5.445 |
| baseline |
winter 2018 |
1.000 |
0.146 |
0.386 |
0.463 |
1.849 |
NaN |
NaN |
| elr |
winter 2018 |
1.000 |
0.073 |
0.328 |
0.450 |
1.453 |
0.593 |
4.376 |
| baseline |
winter 2019 |
0.993 |
0.059 |
0.376 |
0.450 |
2.301 |
NaN |
NaN |
| elr |
winter 2019 |
0.993 |
0.059 |
0.370 |
0.479 |
1.812 |
0.571 |
4.348 |
| baseline |
all |
0.988 |
0.070 |
0.390 |
0.459 |
2.719 |
NaN |
NaN |
| elr |
all |
0.985 |
0.039 |
0.374 |
0.468 |
2.414 |
0.594 |
4.590 |
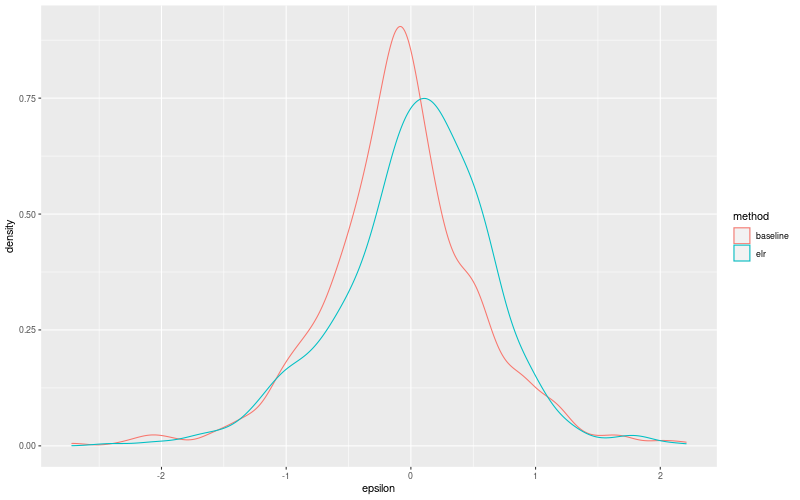
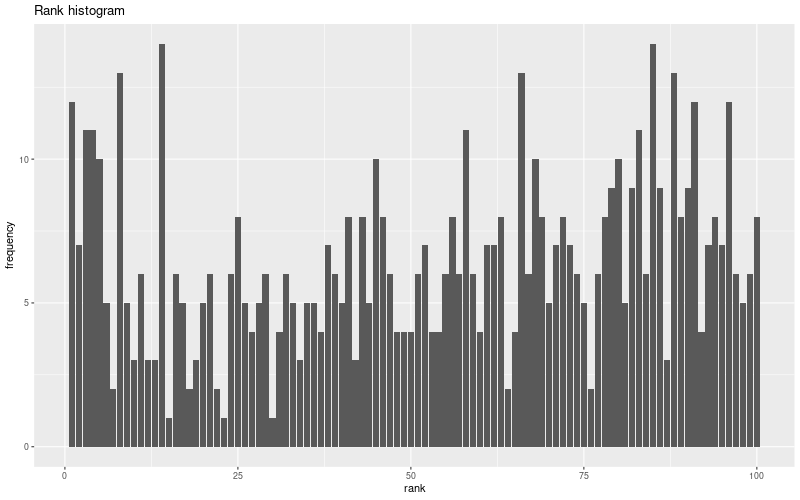
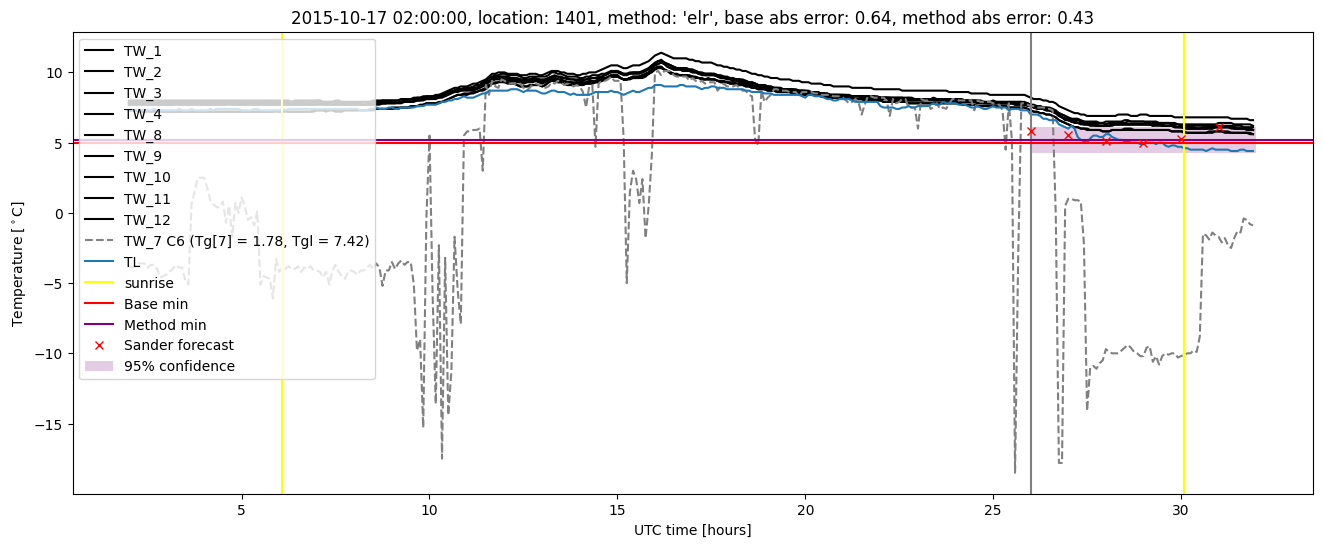
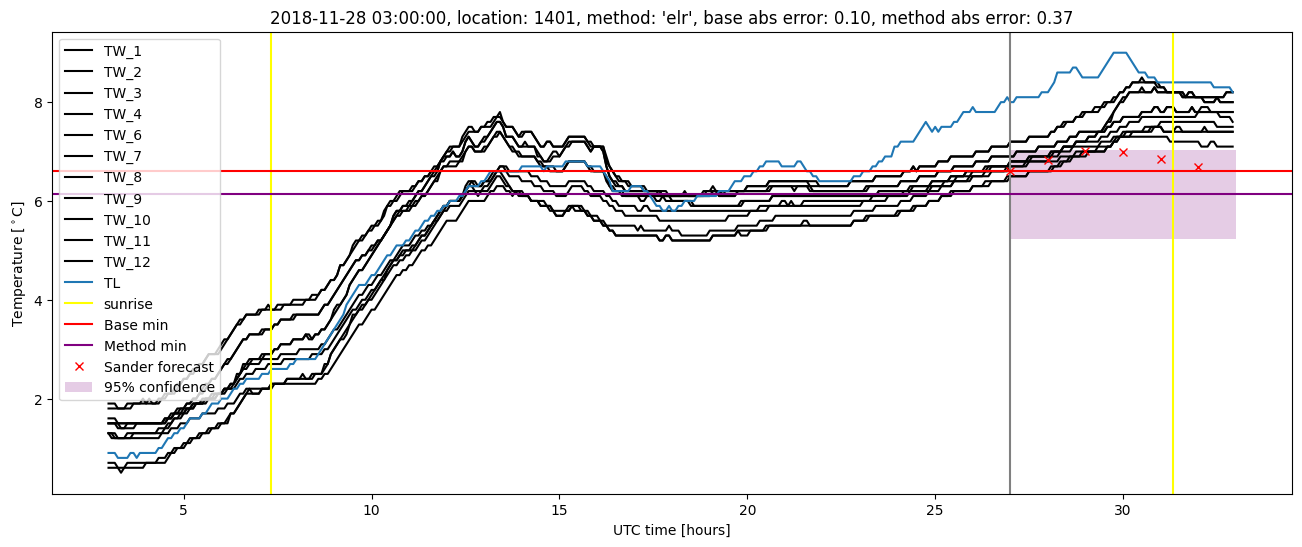
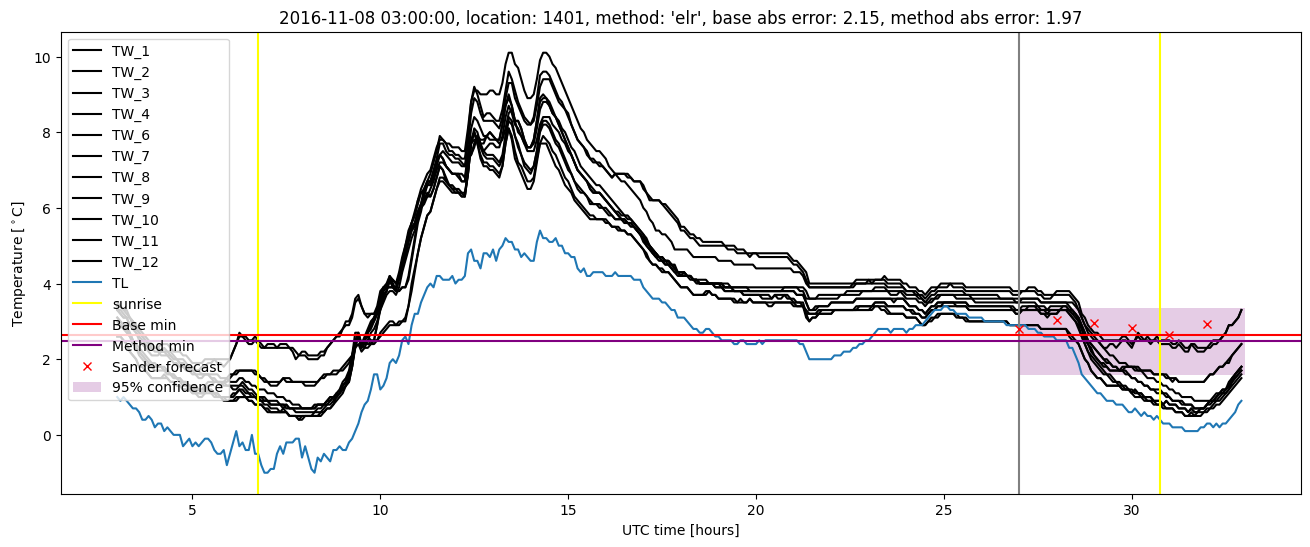
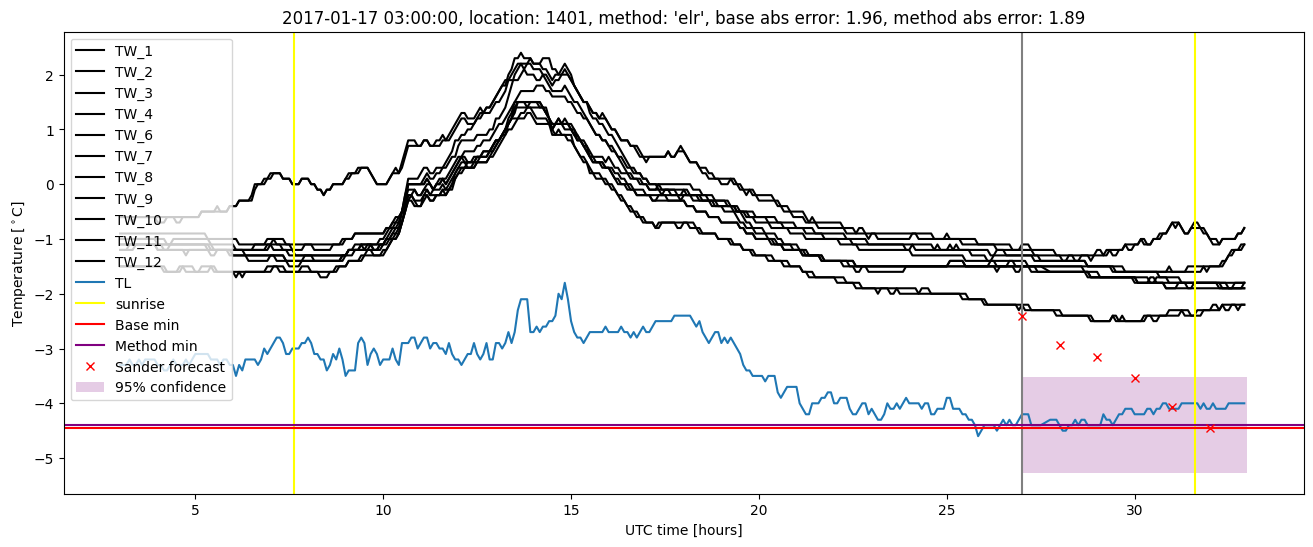
Extended logistic regression plots