GMS location: 1237
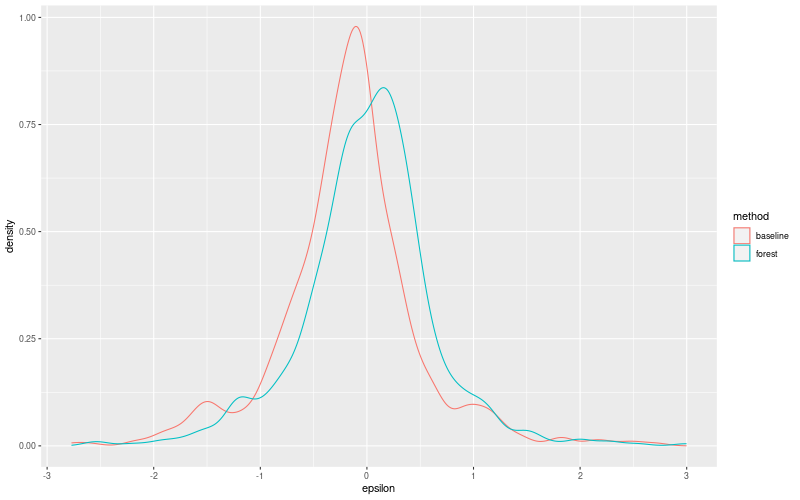
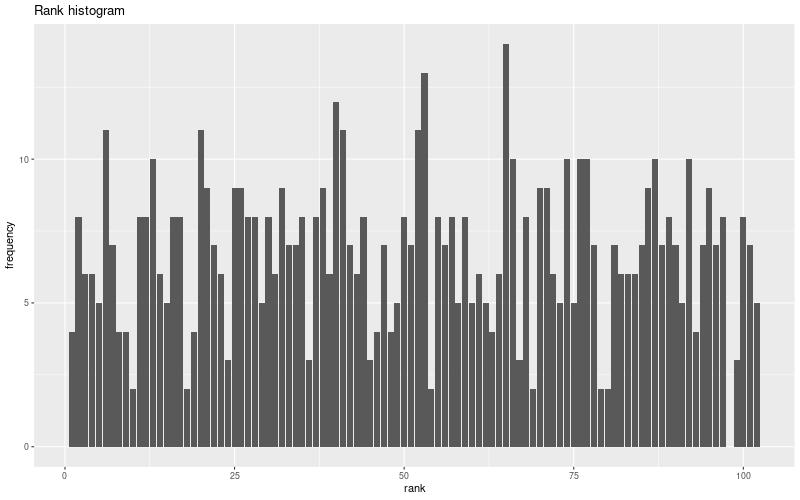
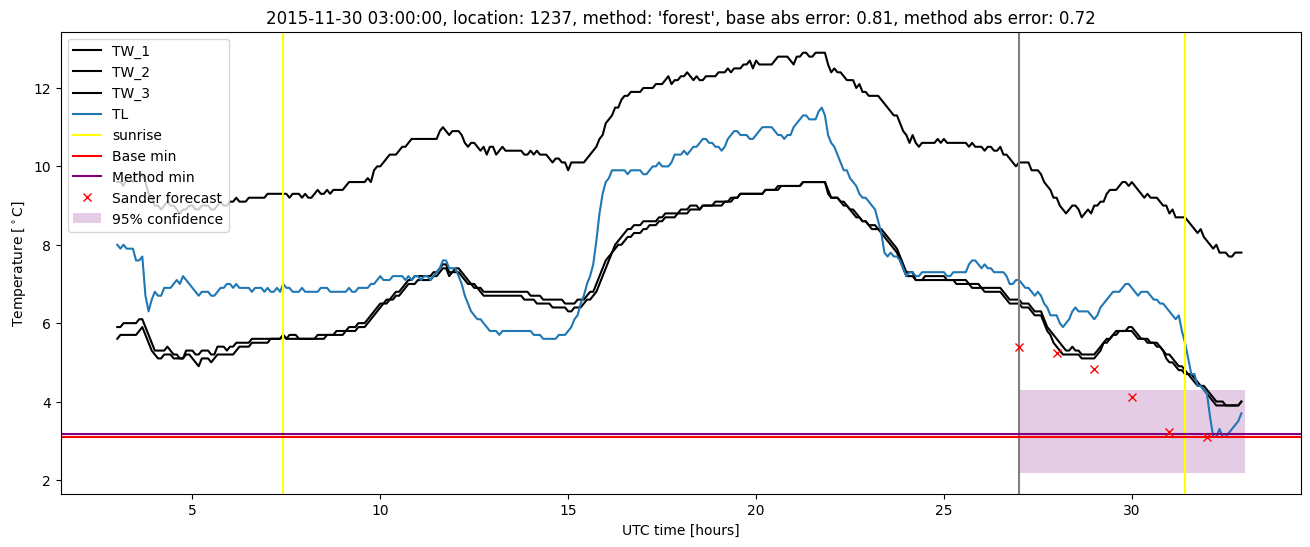
Random forest results
| names |
period |
power |
significance |
meanSquareError |
absError |
maxError |
CRPS |
IGN |
| baseline |
winter 2016 |
0.994 |
0.062 |
0.429 |
0.459 |
2.768 |
NaN |
NaN |
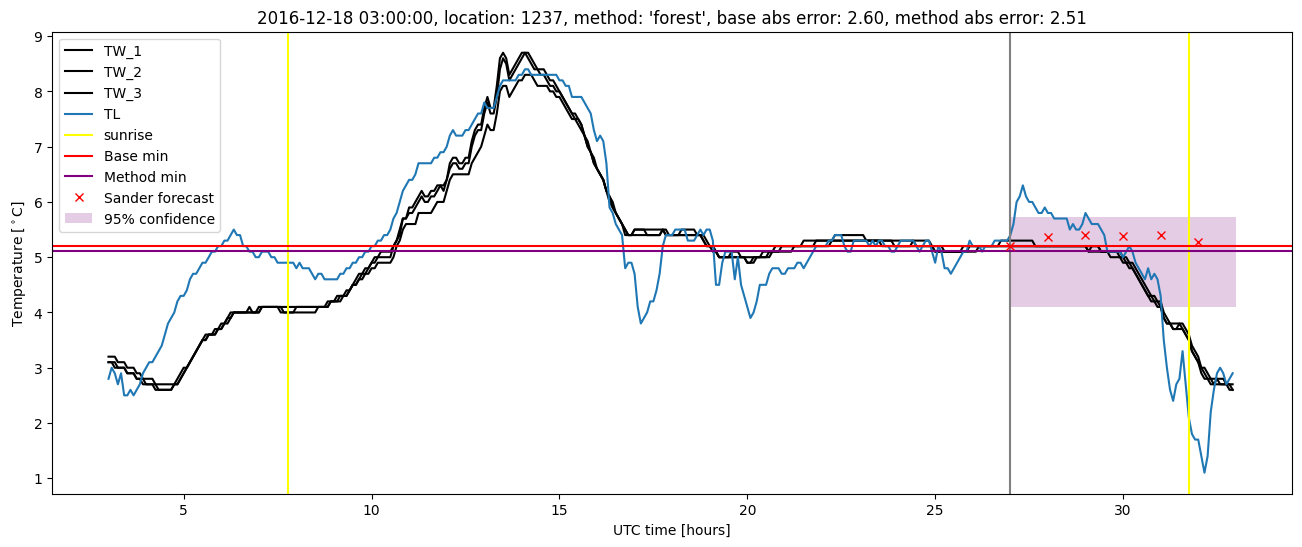
| forest |
winter 2016 |
0.994 |
0.062 |
0.331 |
0.410 |
2.564 |
0.551 |
2.438 |
| baseline |
winter 2017 |
0.991 |
0.054 |
0.592 |
0.548 |
2.600 |
NaN |
NaN |
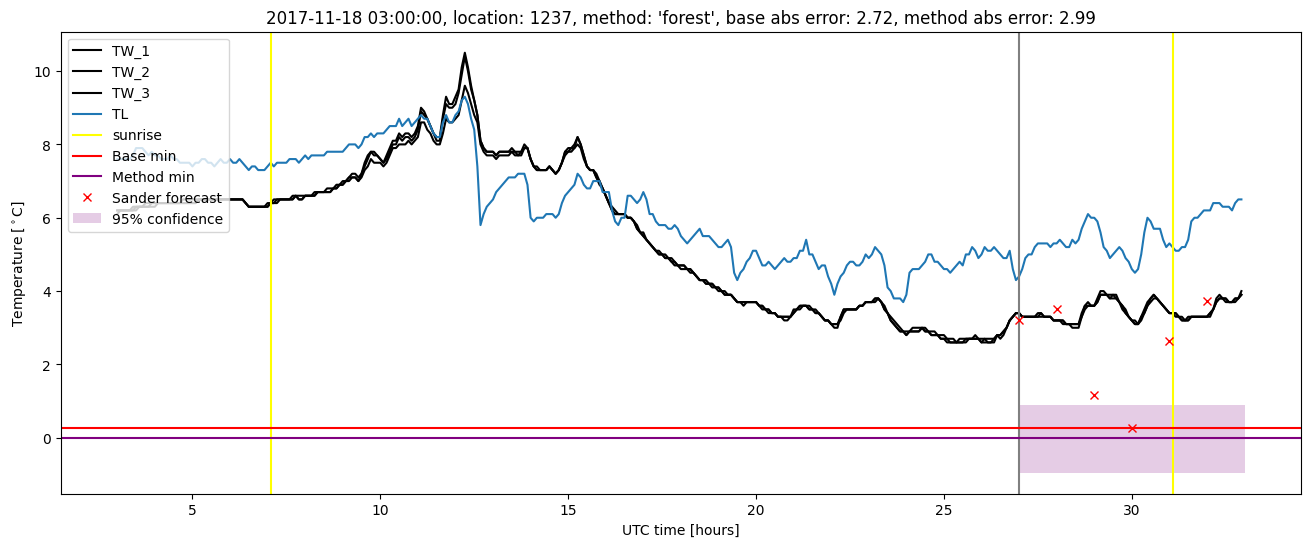
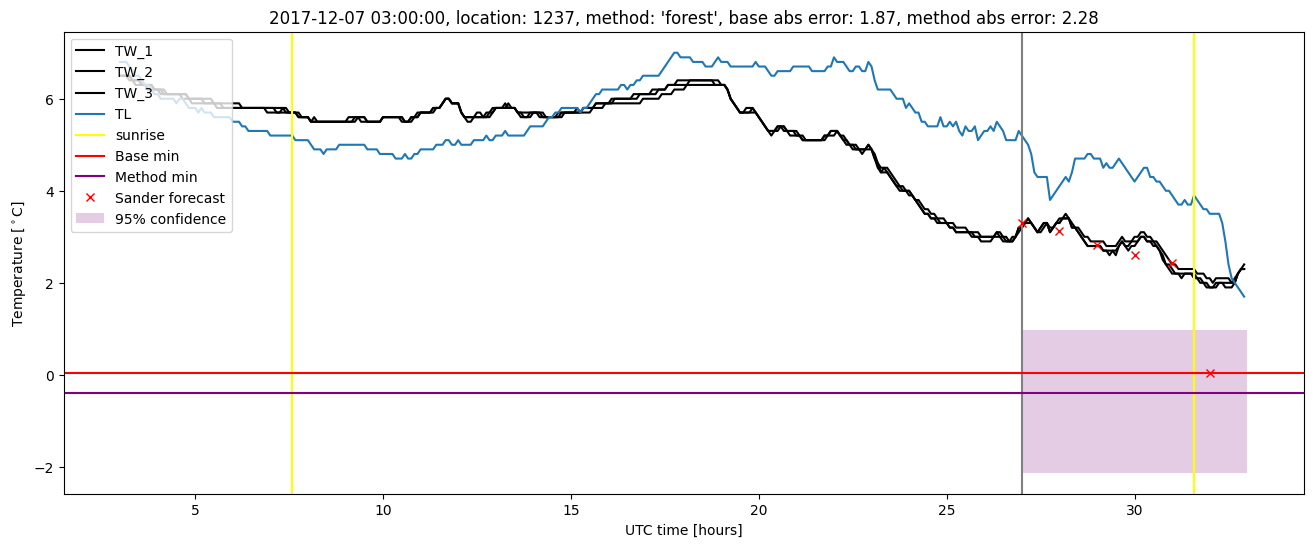
| forest |
winter 2017 |
0.983 |
0.027 |
0.499 |
0.516 |
2.514 |
0.550 |
3.220 |
| baseline |
winter 2018 |
0.987 |
0.029 |
0.482 |
0.490 |
2.723 |
NaN |
NaN |
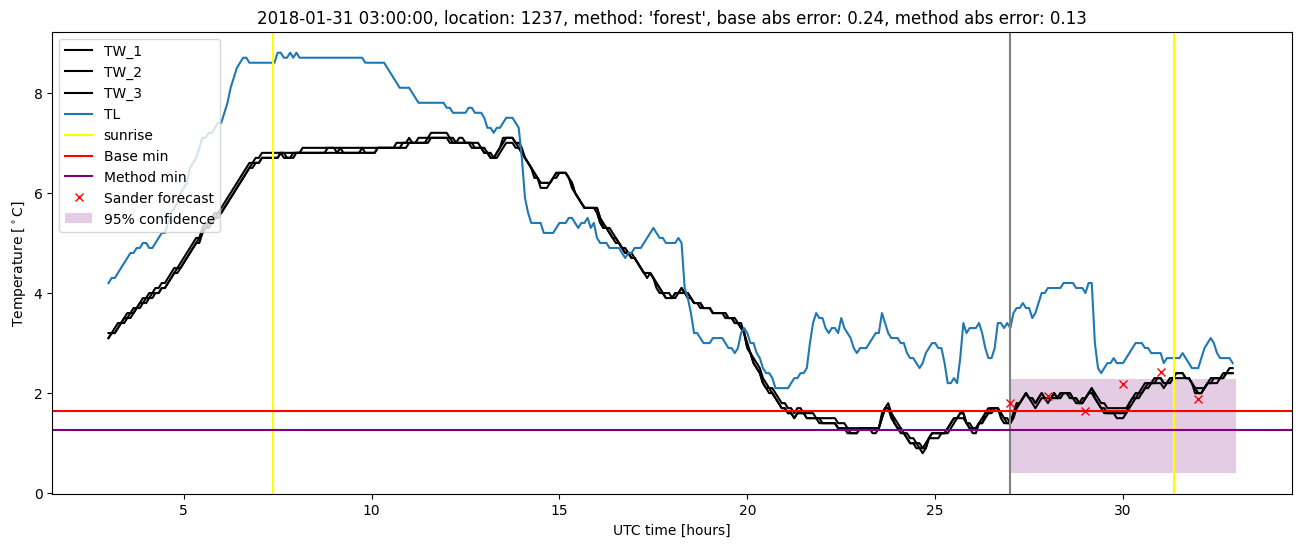
| forest |
winter 2018 |
0.953 |
0.029 |
0.468 |
0.488 |
2.995 |
0.585 |
2.850 |
| baseline |
winter 2019 |
0.993 |
0.000e+00 |
0.337 |
0.412 |
2.124 |
NaN |
NaN |
| forest |
winter 2019 |
0.993 |
0.000e+00 |
0.264 |
0.390 |
1.552 |
0.573 |
2.441 |
| baseline |
all |
0.991 |
0.044 |
0.460 |
0.477 |
2.768 |
NaN |
NaN |
| forest |
all |
0.981 |
0.035 |
0.391 |
0.450 |
2.995 |
0.565 |
2.722 |
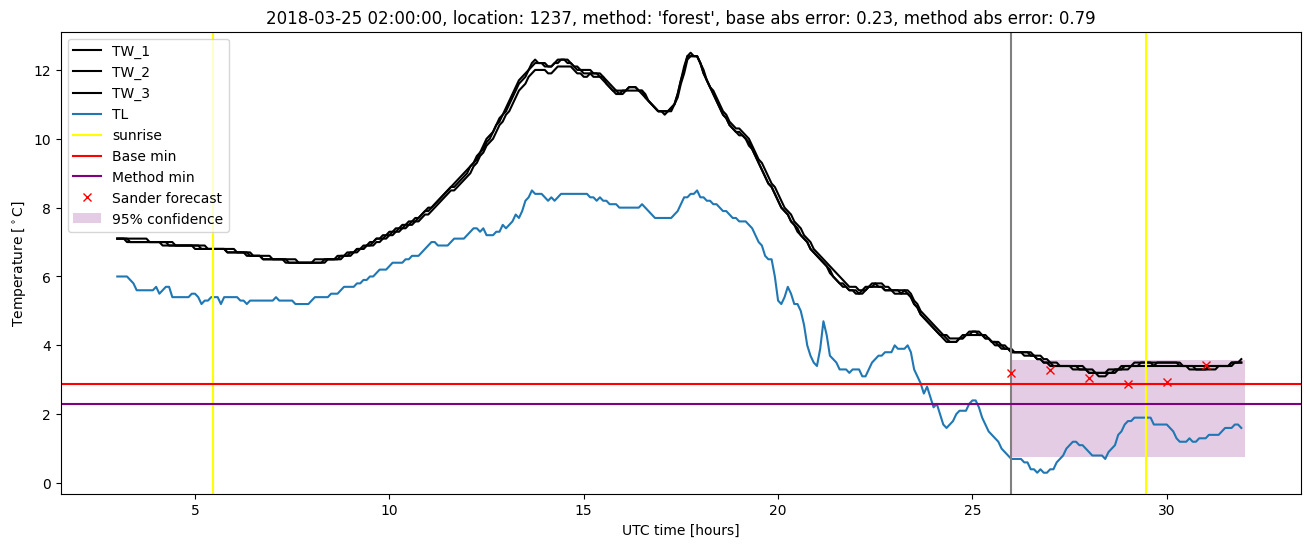
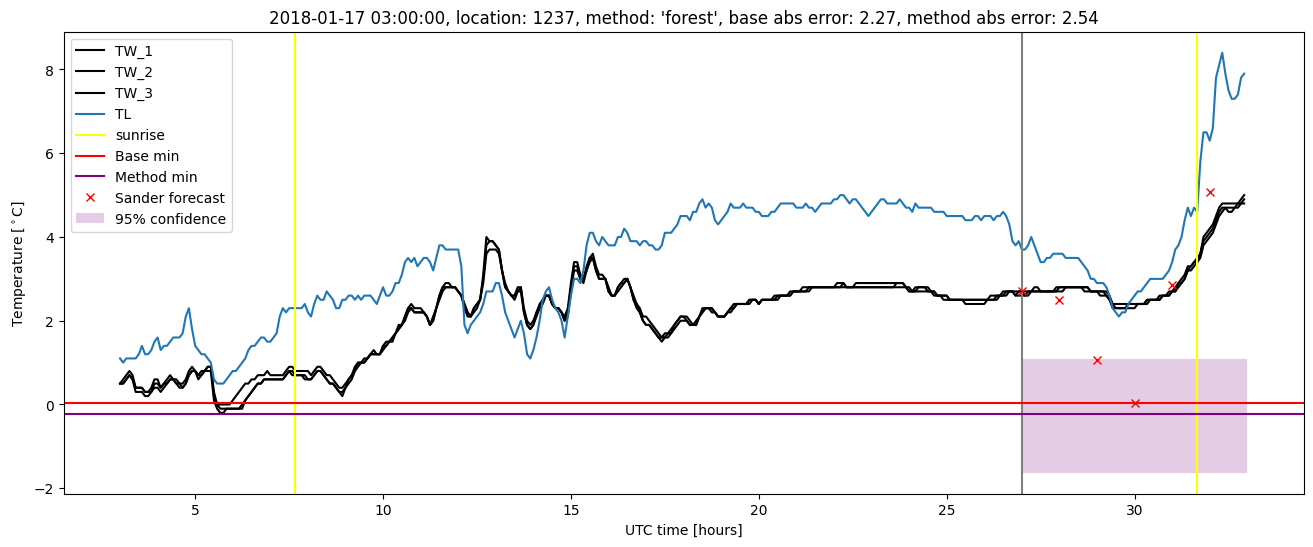
Random forest plots

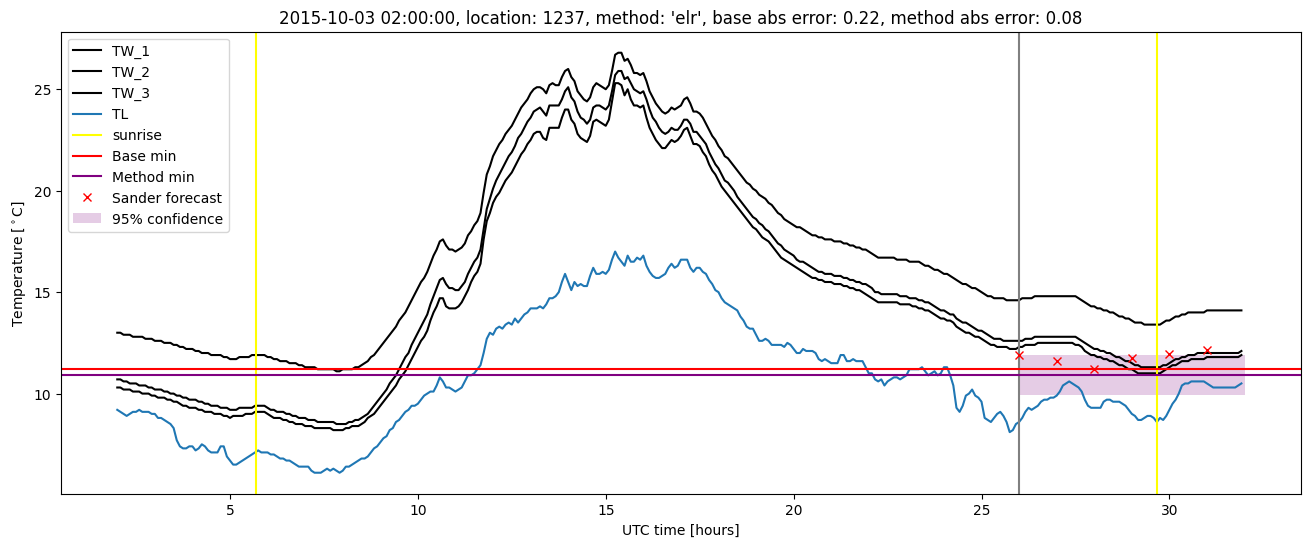
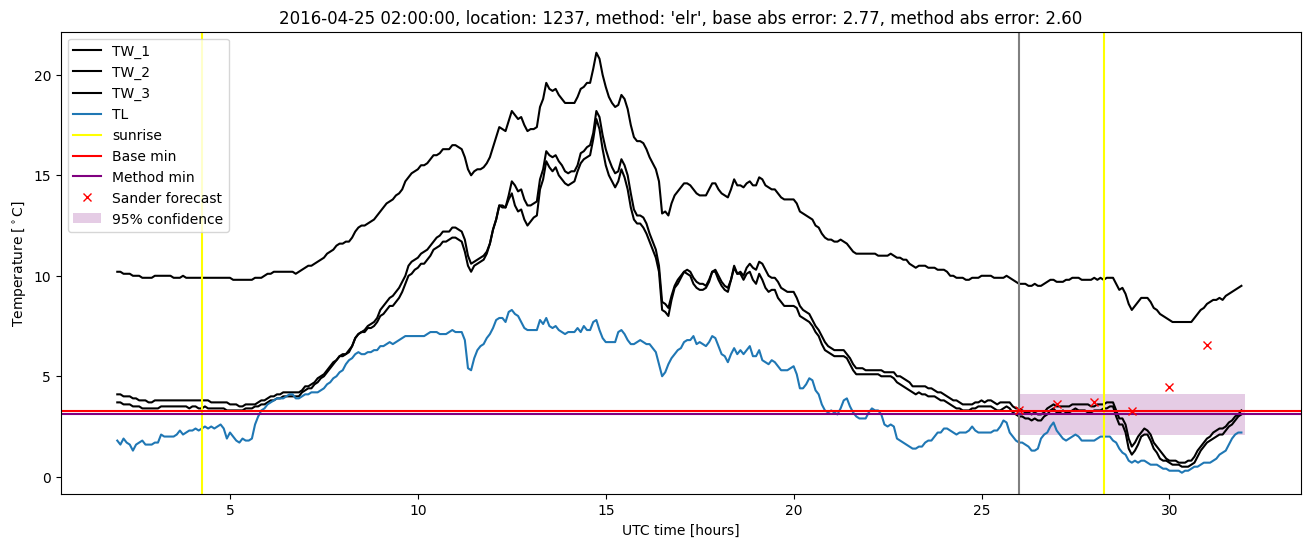
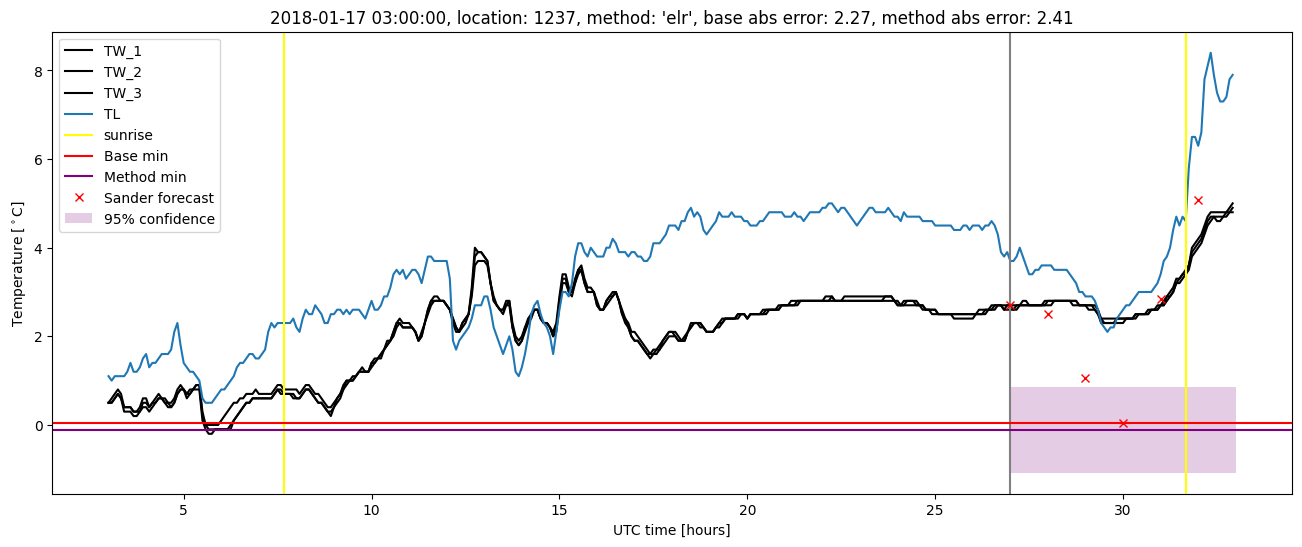
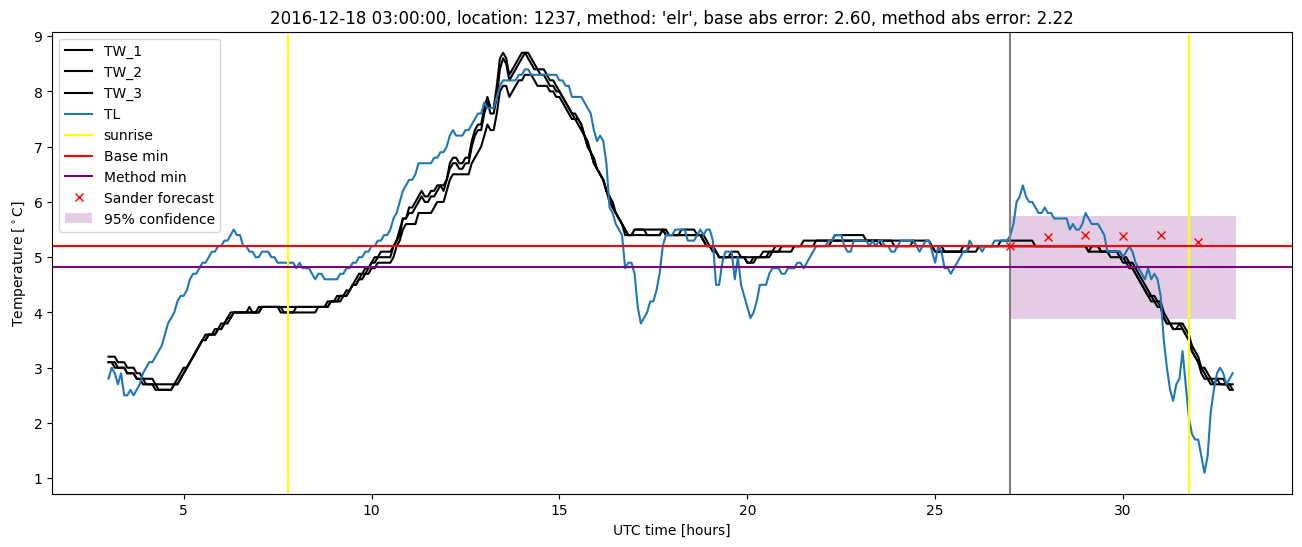
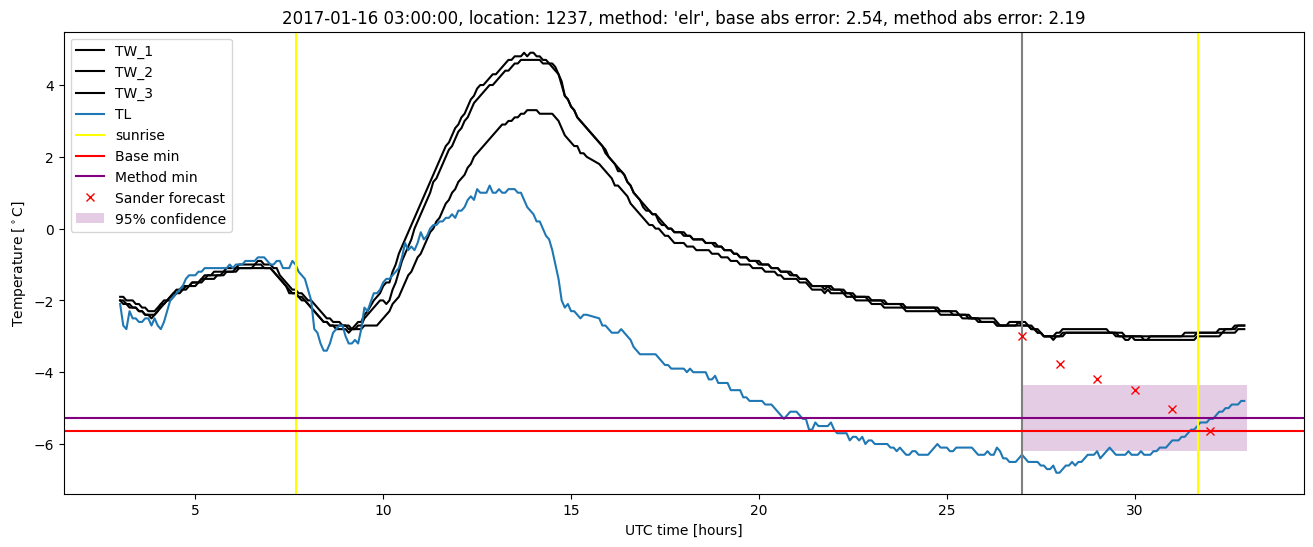
Extended logistic regression results
| names |
period |
power |
significance |
meanSquareError |
absError |
maxError |
CRPS |
IGN |
| baseline |
winter 2016 |
0.994 |
0.062 |
0.429 |
0.459 |
2.768 |
NaN |
NaN |
| elr |
winter 2016 |
0.989 |
0.062 |
0.349 |
0.437 |
2.599 |
0.617 |
3.429 |
| baseline |
winter 2017 |
0.991 |
0.054 |
0.592 |
0.548 |
2.600 |
NaN |
NaN |
| elr |
winter 2017 |
0.983 |
0.000e+00 |
0.515 |
0.533 |
2.217 |
0.615 |
4.519 |
| baseline |
winter 2018 |
0.987 |
0.029 |
0.482 |
0.490 |
2.723 |
NaN |
NaN |
| elr |
winter 2018 |
0.953 |
0.029 |
0.463 |
0.497 |
2.884 |
0.643 |
4.102 |
| baseline |
winter 2019 |
0.993 |
0.000e+00 |
0.337 |
0.412 |
2.124 |
NaN |
NaN |
| elr |
winter 2019 |
0.993 |
0.000e+00 |
0.353 |
0.480 |
1.829 |
0.584 |
3.096 |
| baseline |
all |
0.991 |
0.044 |
0.460 |
0.477 |
2.768 |
NaN |
NaN |
| elr |
all |
0.979 |
0.026 |
0.417 |
0.483 |
2.884 |
0.616 |
3.779 |
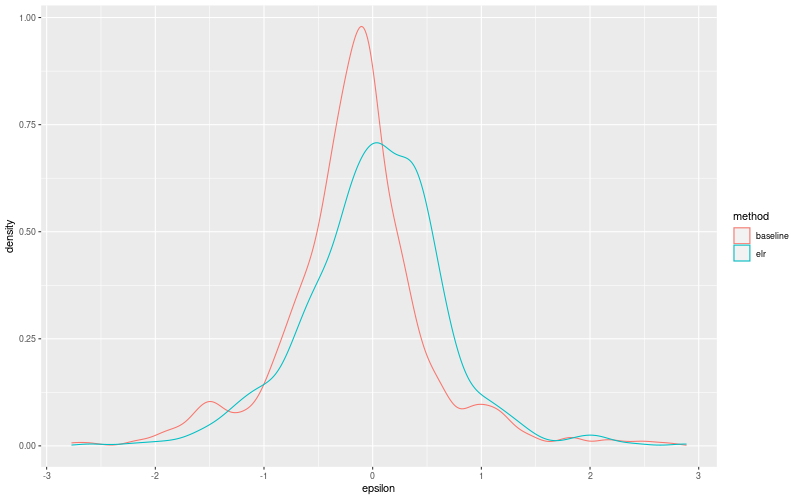
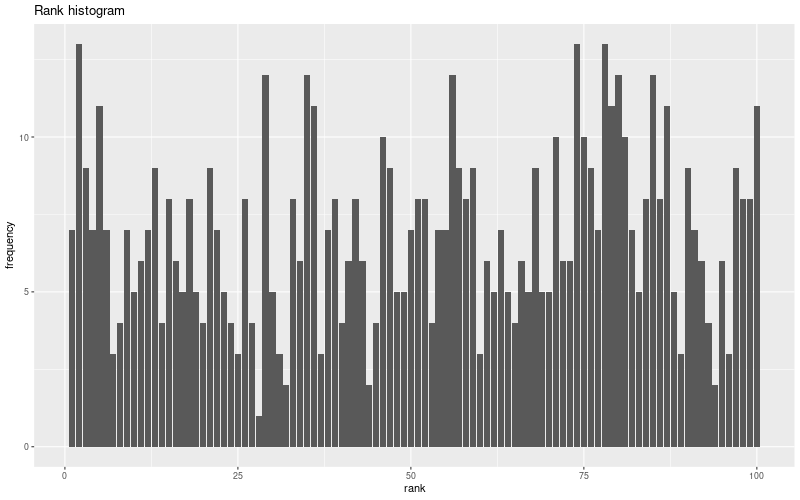
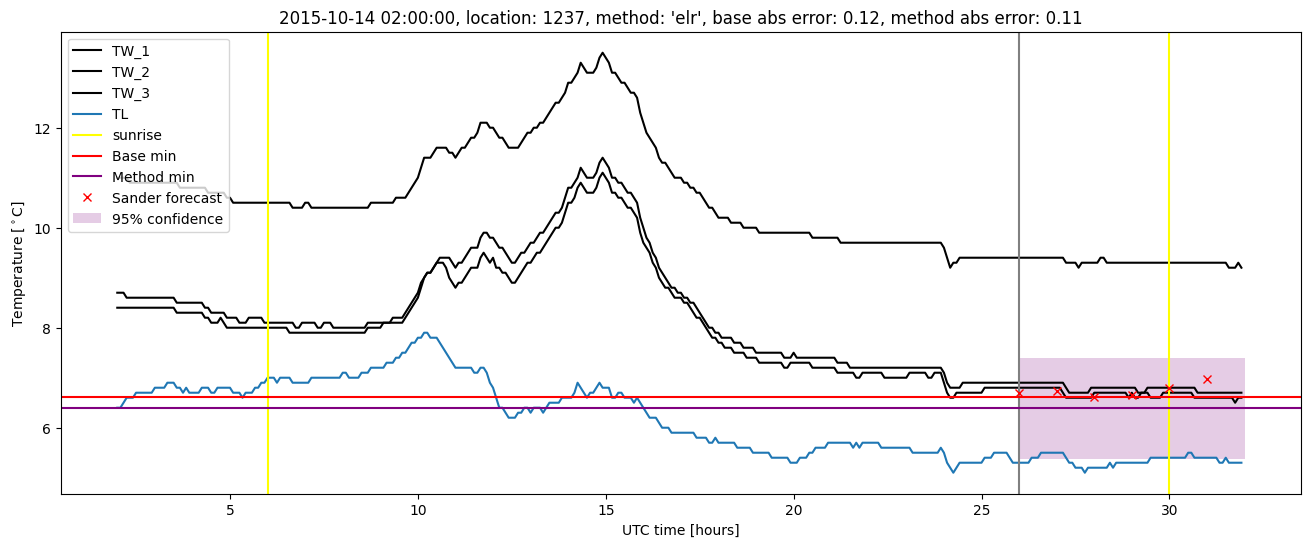
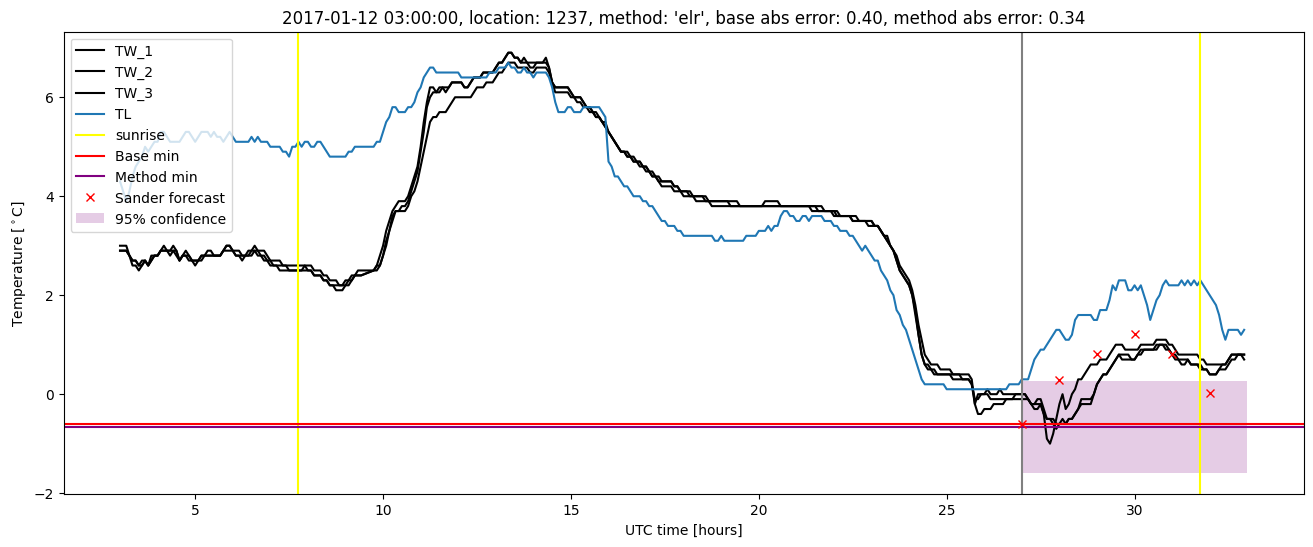
Extended logistic regression plots