GMS location: 1233
Random forest results
| names |
period |
power |
significance |
meanSquareError |
absError |
maxError |
CRPS |
IGN |
| baseline |
winter 2016 |
0.988 |
0.069 |
0.378 |
0.448 |
2.000 |
NaN |
NaN |
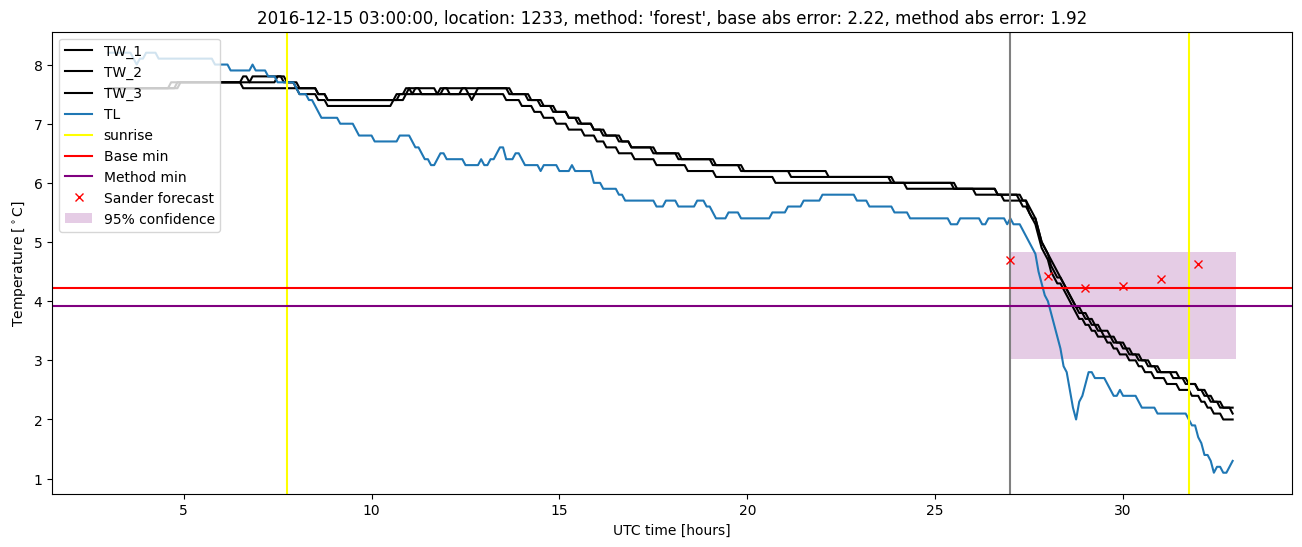
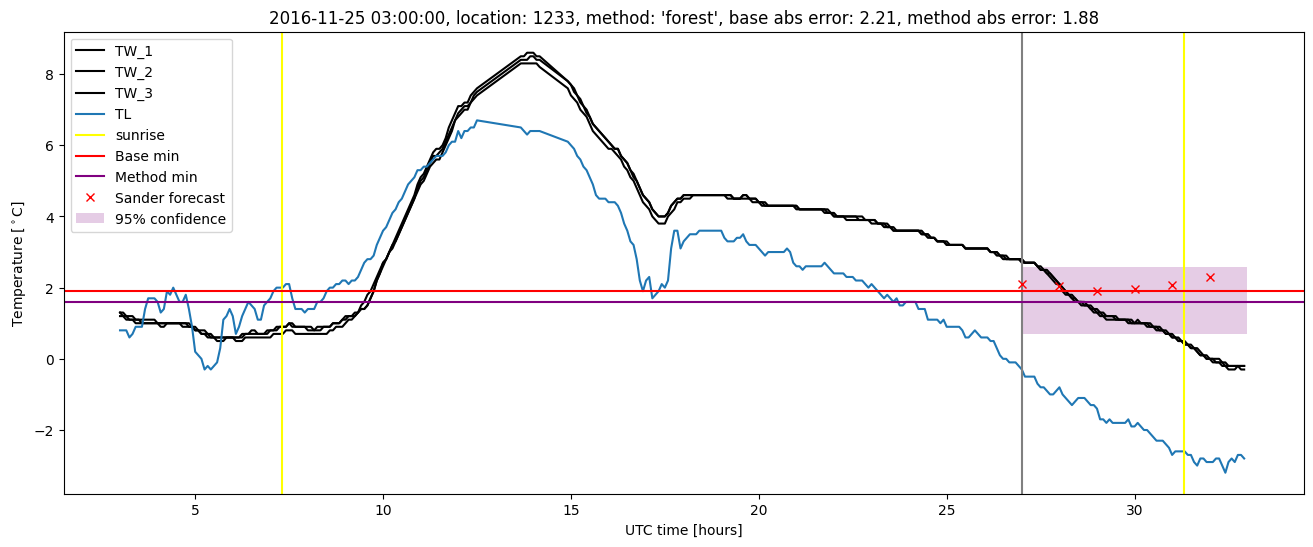
| forest |
winter 2016 |
0.988 |
0.069 |
0.309 |
0.408 |
1.873 |
0.523 |
2.571 |
| baseline |
winter 2017 |
0.983 |
0.030 |
0.553 |
0.549 |
2.224 |
NaN |
NaN |
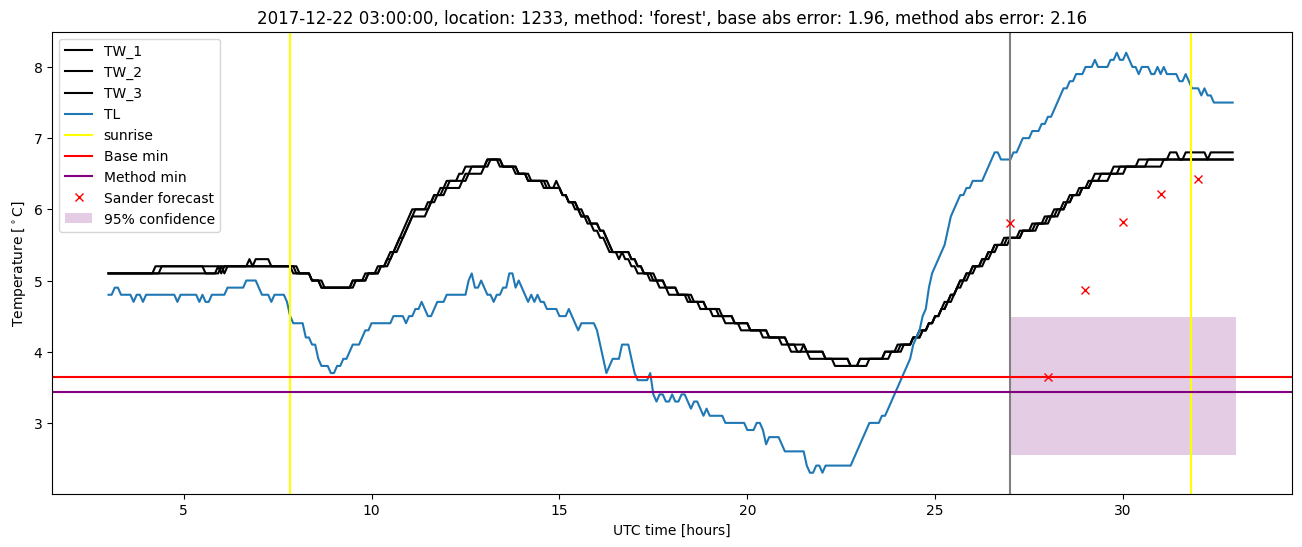
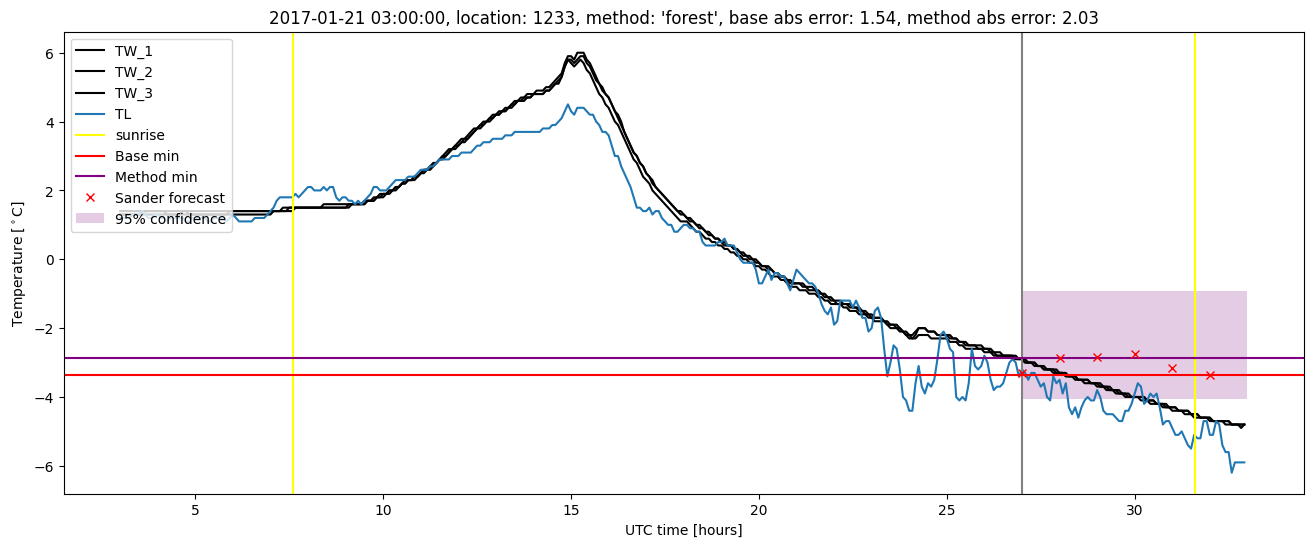
| forest |
winter 2017 |
0.983 |
0.030 |
0.423 |
0.476 |
2.034 |
0.529 |
3.077 |
| baseline |
winter 2018 |
0.985 |
0.154 |
0.426 |
0.472 |
2.563 |
NaN |
NaN |
| forest |
winter 2018 |
0.955 |
0.051 |
0.383 |
0.430 |
2.806 |
0.549 |
2.795 |
| baseline |
winter 2019 |
0.992 |
0.000e+00 |
0.436 |
0.482 |
2.448 |
NaN |
NaN |
| forest |
winter 2019 |
0.992 |
0.000e+00 |
0.302 |
0.400 |
1.827 |
0.546 |
2.821 |
| baseline |
all |
0.987 |
0.079 |
0.444 |
0.485 |
2.563 |
NaN |
NaN |
| forest |
all |
0.980 |
0.044 |
0.354 |
0.428 |
2.806 |
0.536 |
2.800 |
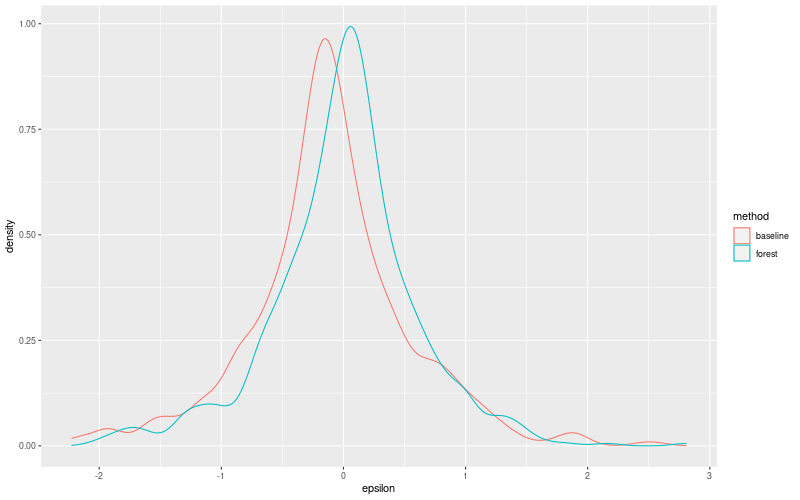
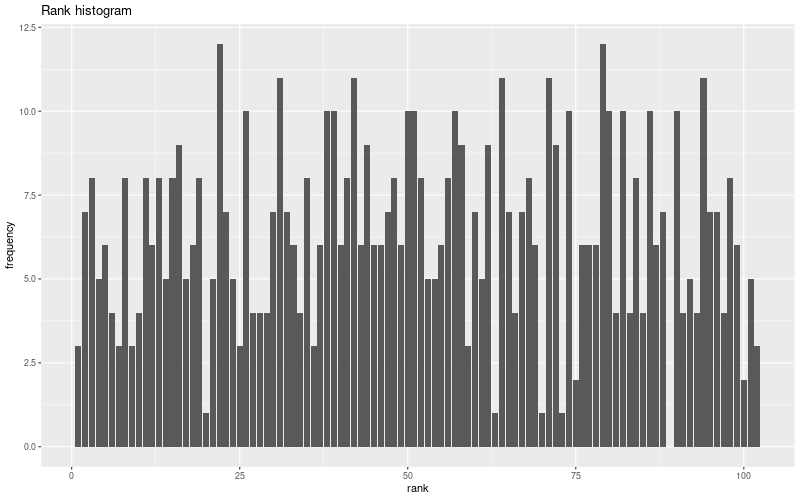
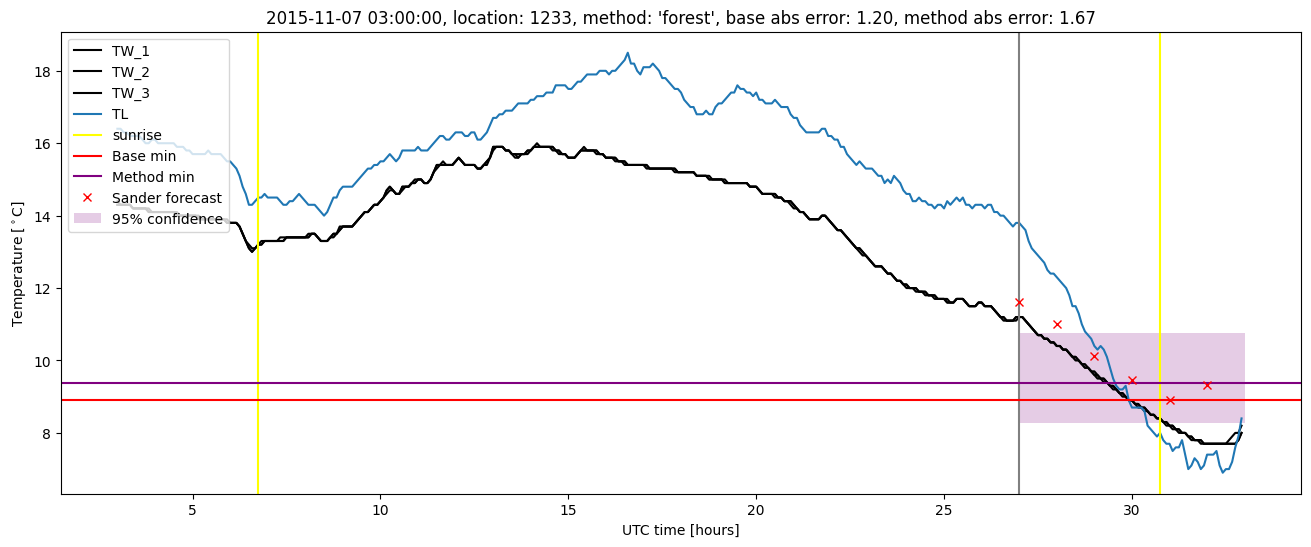
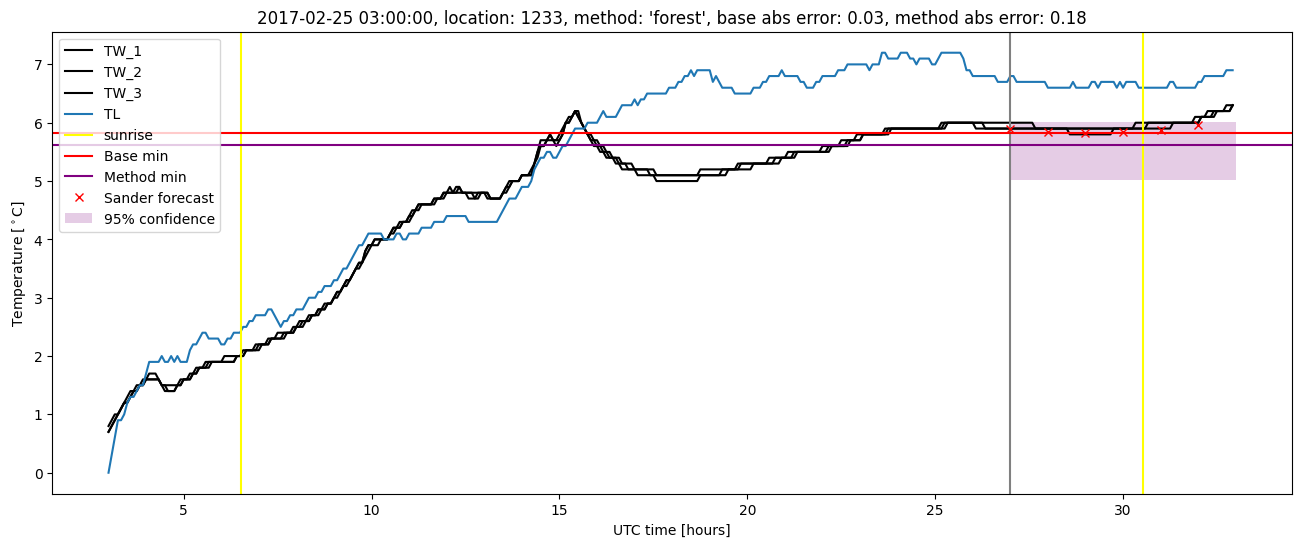
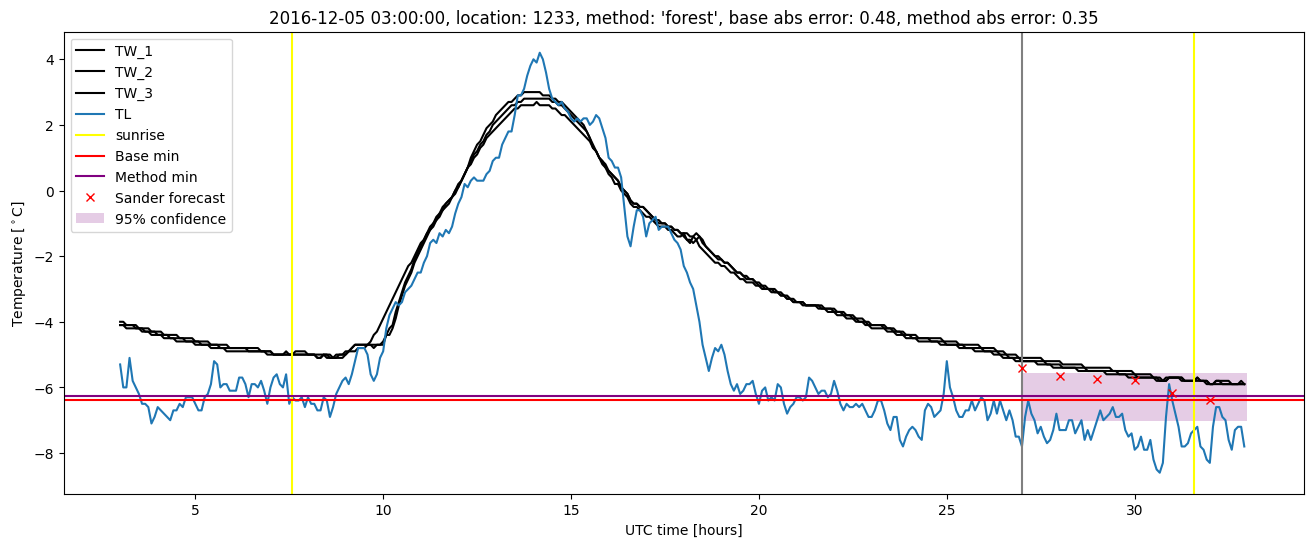
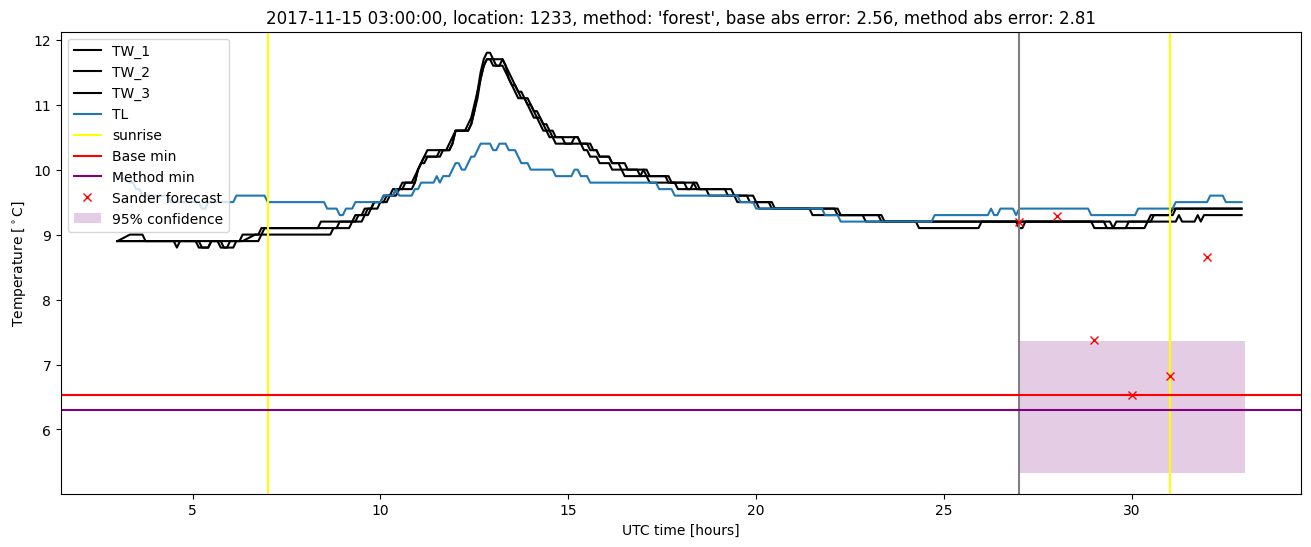
Random forest plots
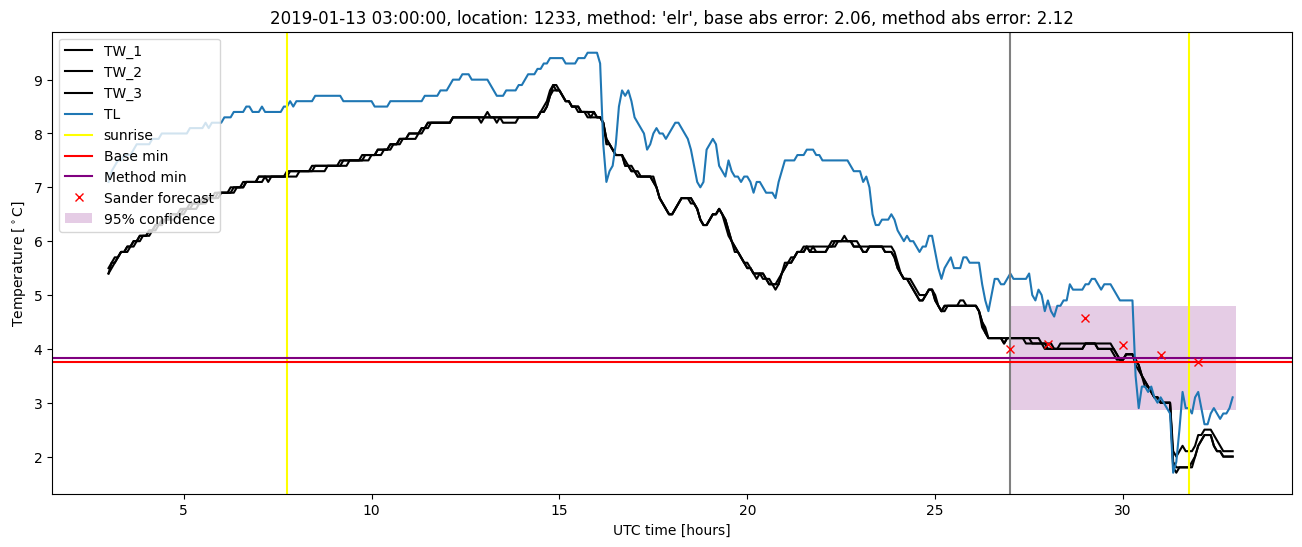
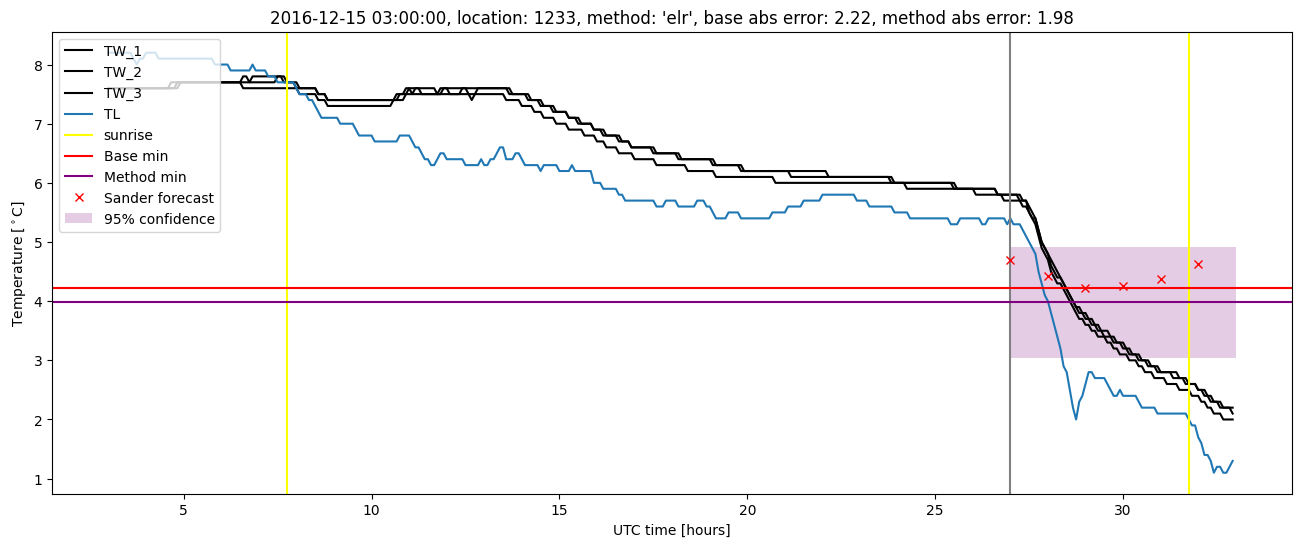
Extended logistic regression results
| names |
period |
power |
significance |
meanSquareError |
absError |
maxError |
CRPS |
IGN |
| baseline |
winter 2016 |
0.988 |
0.069 |
0.378 |
0.448 |
2.000 |
NaN |
NaN |
| elr |
winter 2016 |
0.988 |
0.035 |
0.372 |
0.465 |
1.916 |
0.615 |
3.815 |
| baseline |
winter 2017 |
0.983 |
0.030 |
0.553 |
0.549 |
2.224 |
NaN |
NaN |
| elr |
winter 2017 |
0.958 |
0.030 |
0.493 |
0.530 |
1.982 |
0.607 |
4.161 |
| baseline |
winter 2018 |
0.985 |
0.154 |
0.426 |
0.472 |
2.563 |
NaN |
NaN |
| elr |
winter 2018 |
0.963 |
0.103 |
0.401 |
0.466 |
2.829 |
0.609 |
3.808 |
| baseline |
winter 2019 |
0.992 |
0.000e+00 |
0.436 |
0.482 |
2.448 |
NaN |
NaN |
| elr |
winter 2019 |
1.000 |
0.000e+00 |
0.348 |
0.435 |
2.152 |
0.579 |
3.485 |
| baseline |
all |
0.987 |
0.079 |
0.444 |
0.485 |
2.563 |
NaN |
NaN |
| elr |
all |
0.978 |
0.053 |
0.403 |
0.474 |
2.829 |
0.604 |
3.825 |
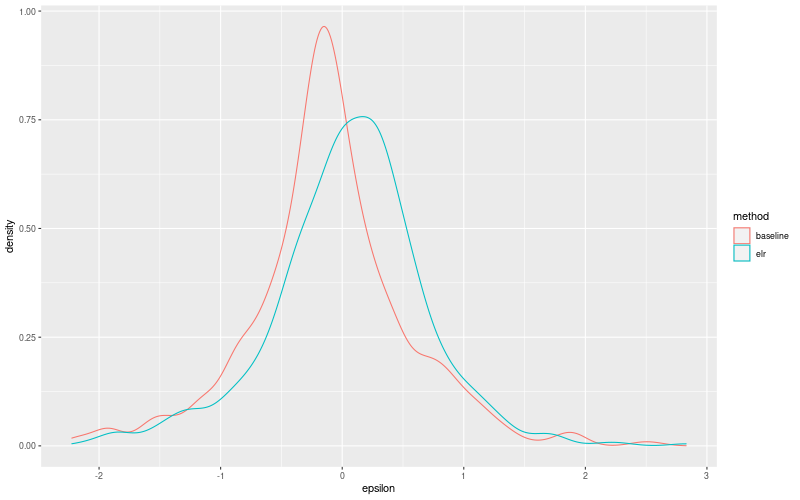
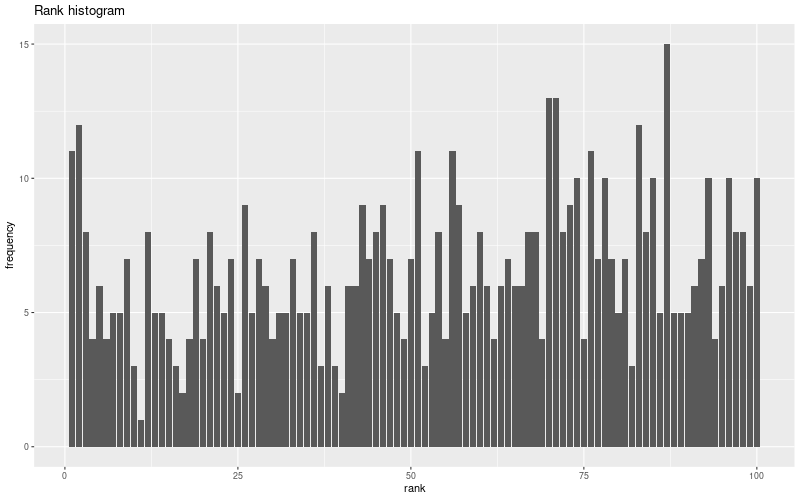
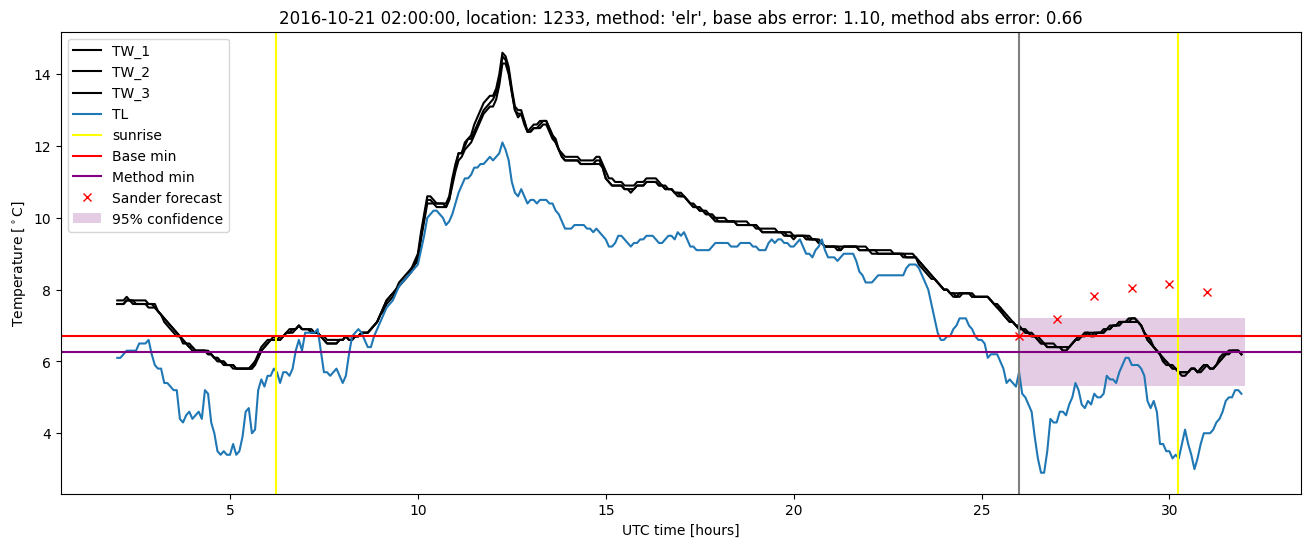
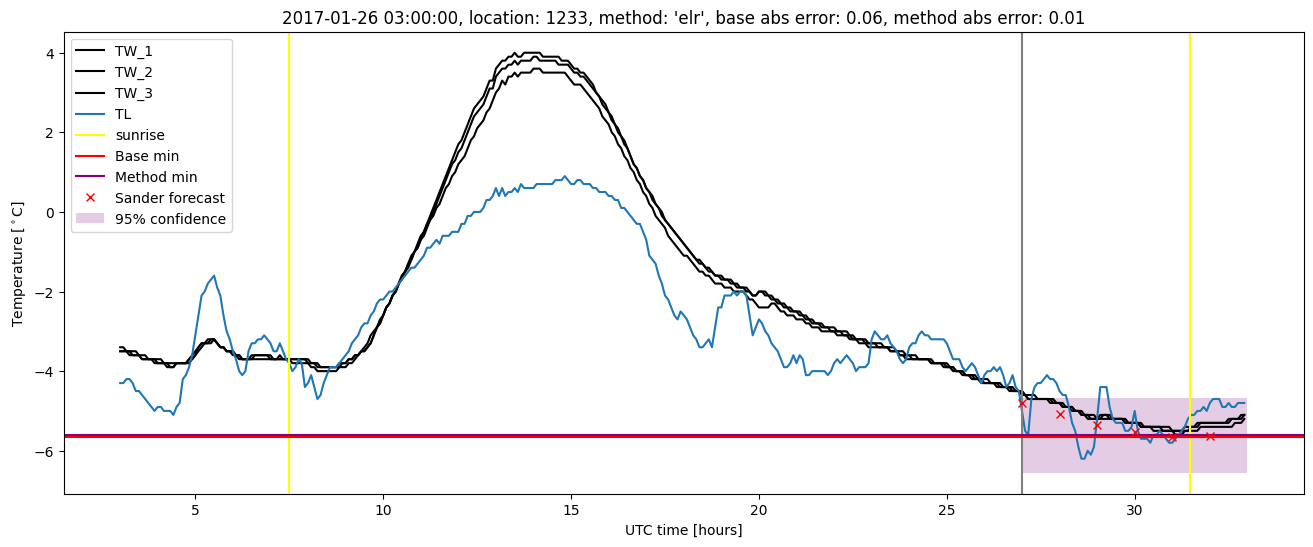
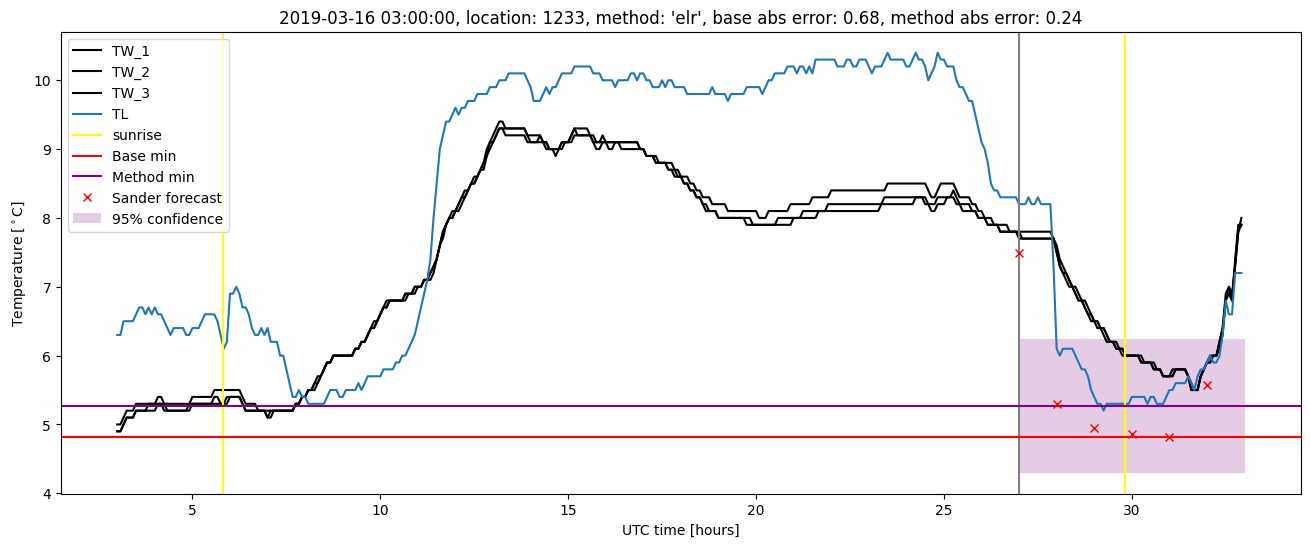
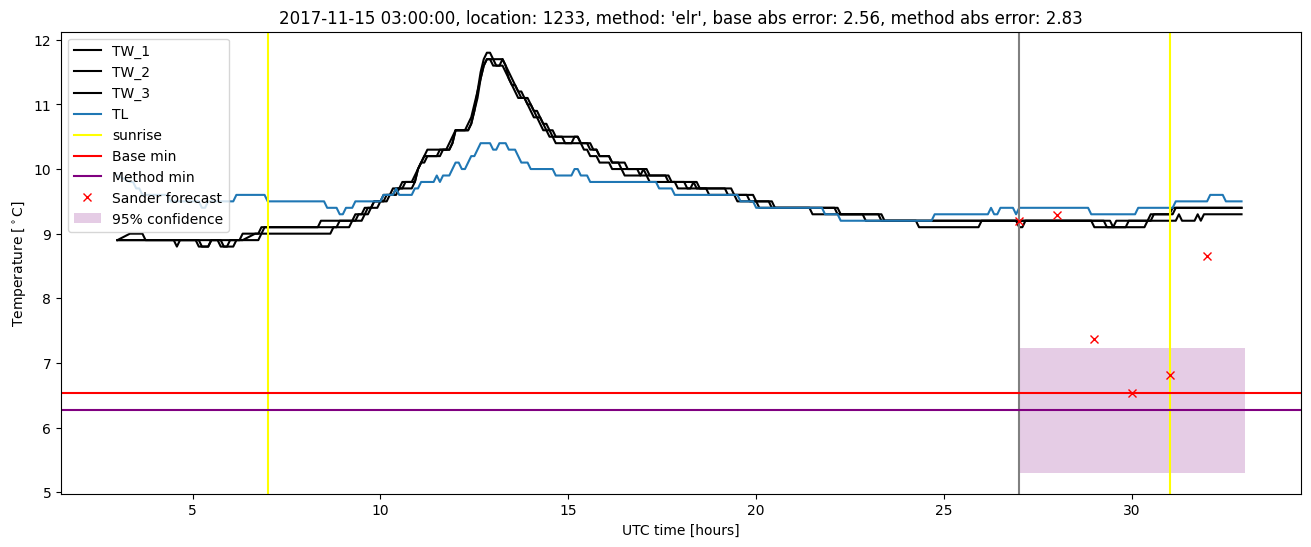
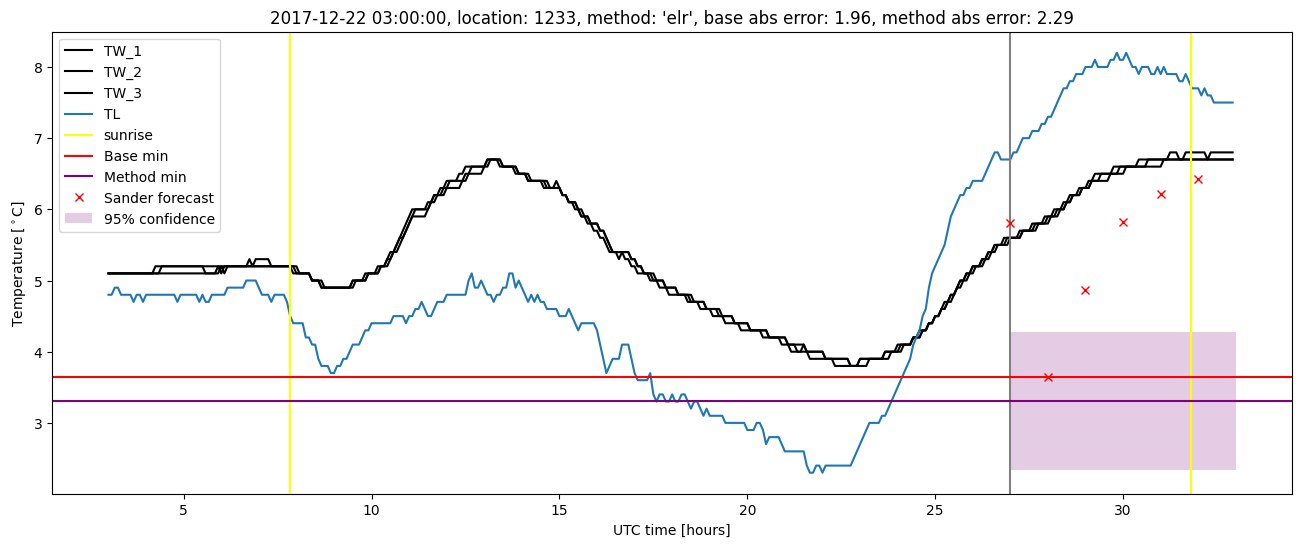
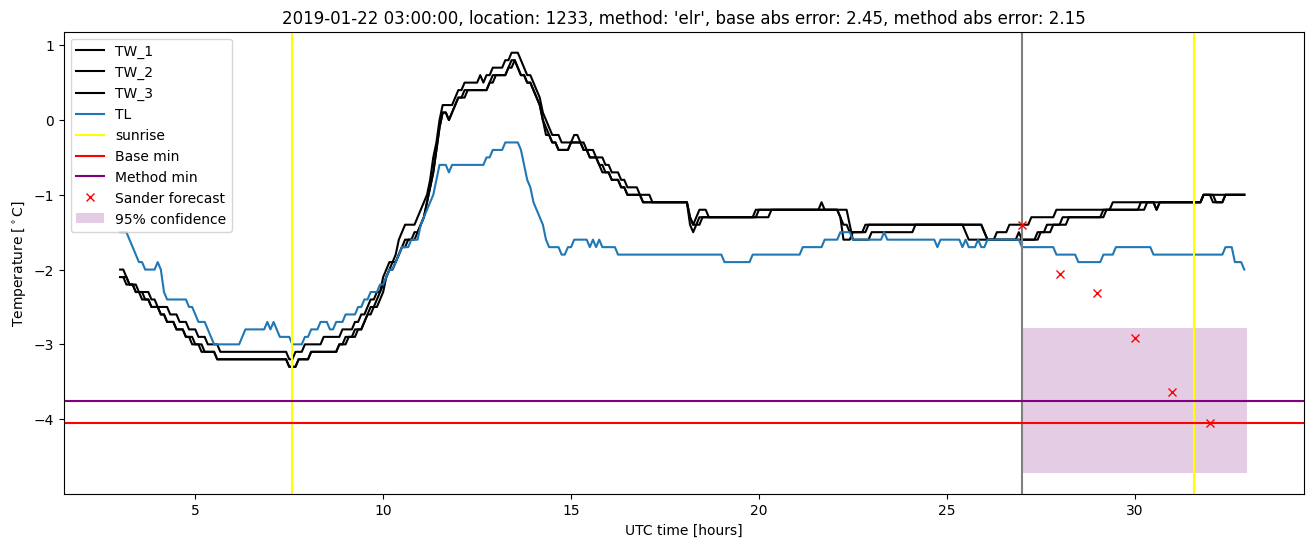
Extended logistic regression plots