GMS location: 1232
Random forest results
| names |
period |
power |
significance |
meanSquareError |
absError |
maxError |
CRPS |
IGN |
| baseline |
winter 2016 |
0.987 |
0.094 |
0.420 |
0.469 |
2.545 |
NaN |
NaN |
| forest |
winter 2016 |
0.987 |
0.062 |
0.344 |
0.430 |
2.436 |
0.558 |
2.922 |
| baseline |
winter 2017 |
0.975 |
0.059 |
0.535 |
0.538 |
2.063 |
NaN |
NaN |
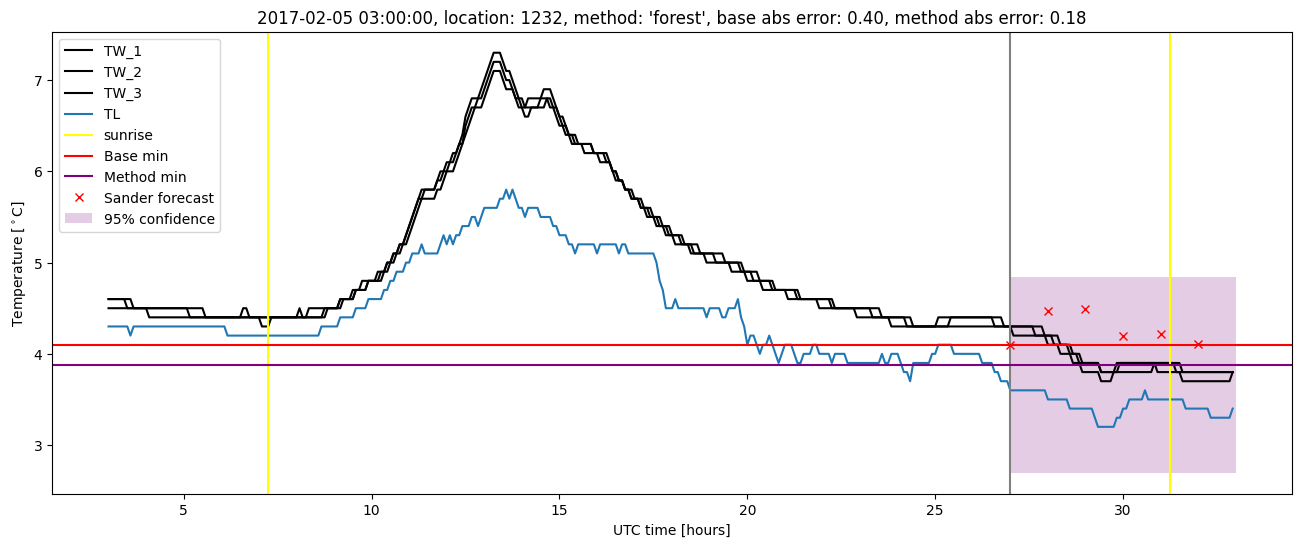
| forest |
winter 2017 |
0.966 |
0.059 |
0.443 |
0.494 |
2.060 |
0.542 |
3.603 |
| baseline |
winter 2018 |
0.986 |
0.171 |
0.421 |
0.480 |
2.611 |
NaN |
NaN |
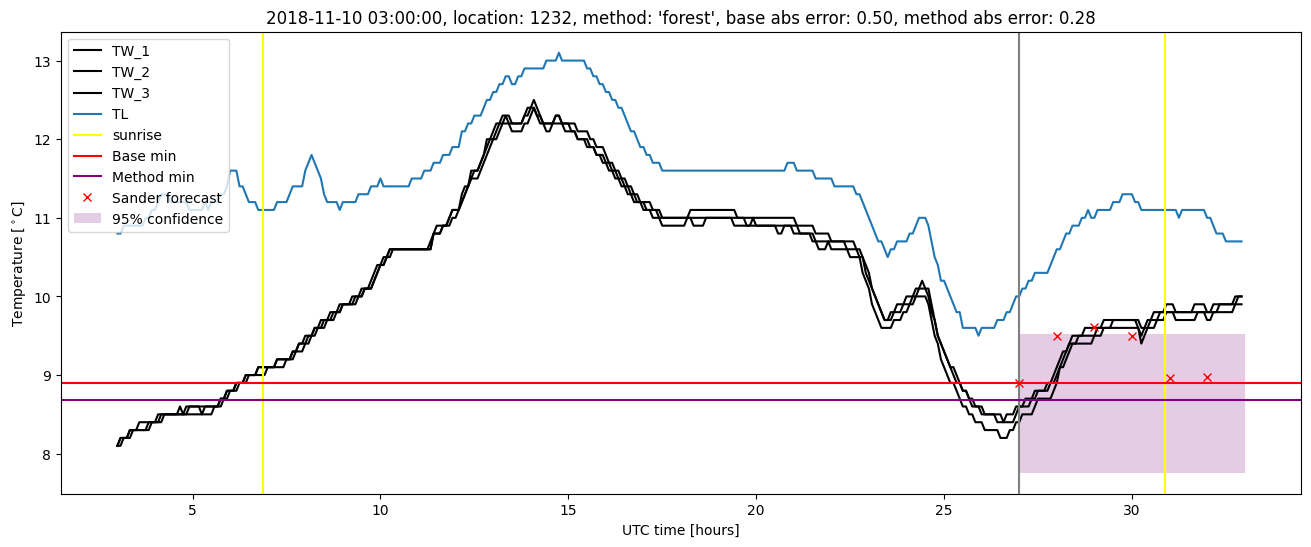
| forest |
winter 2018 |
0.978 |
0.171 |
0.359 |
0.436 |
2.598 |
0.556 |
2.485 |
| baseline |
winter 2019 |
0.987 |
0.000e+00 |
0.432 |
0.496 |
2.211 |
NaN |
NaN |
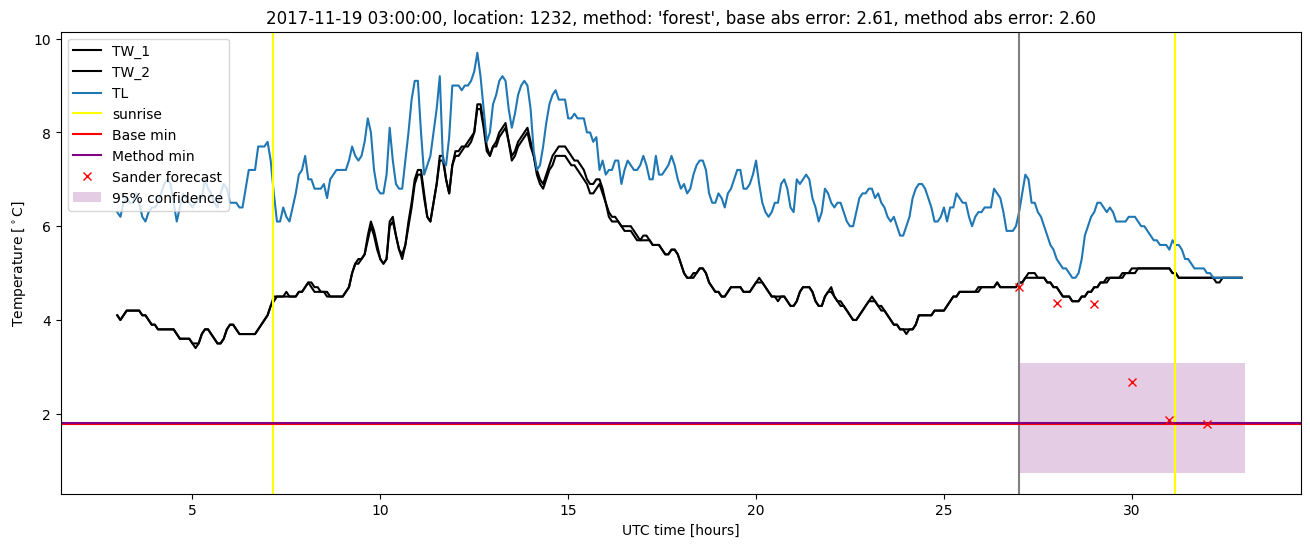
| forest |
winter 2019 |
0.987 |
0.000e+00 |
0.314 |
0.413 |
1.800 |
0.572 |
2.888 |
| baseline |
all |
0.984 |
0.097 |
0.449 |
0.494 |
2.611 |
NaN |
NaN |
| forest |
all |
0.981 |
0.088 |
0.363 |
0.442 |
2.598 |
0.557 |
2.955 |
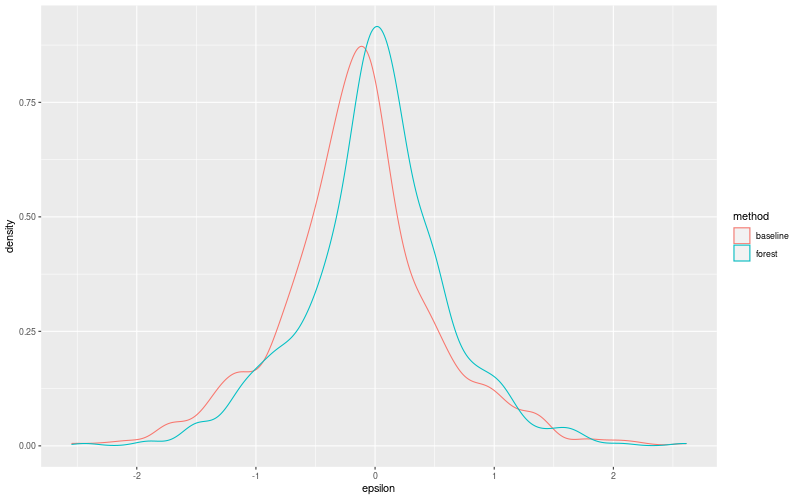
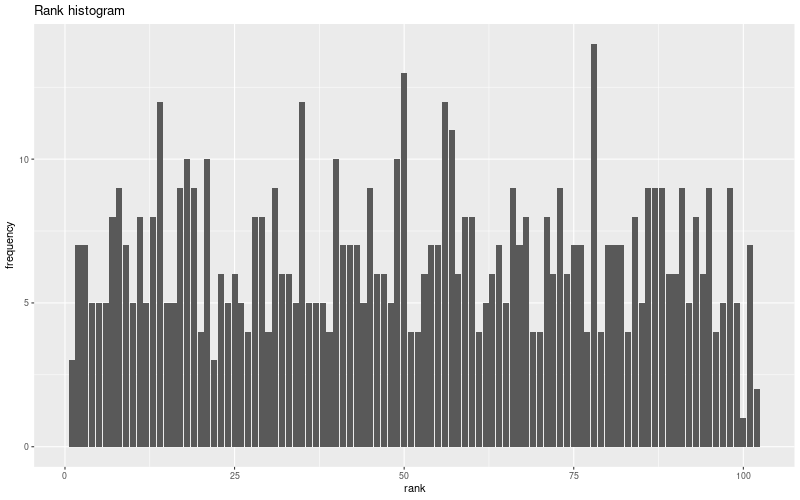
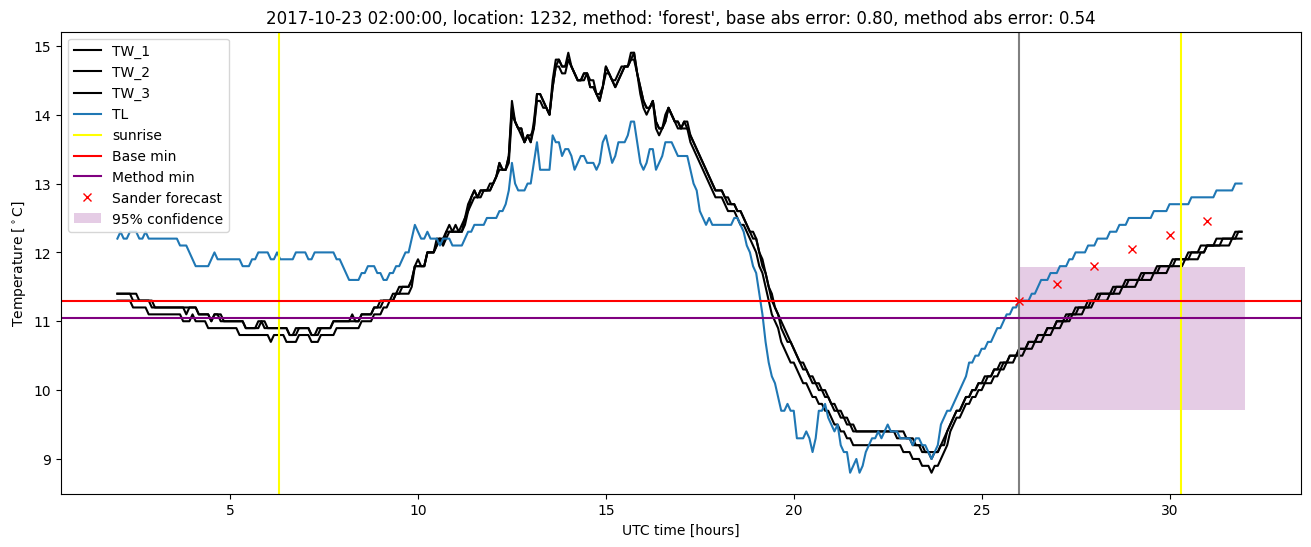
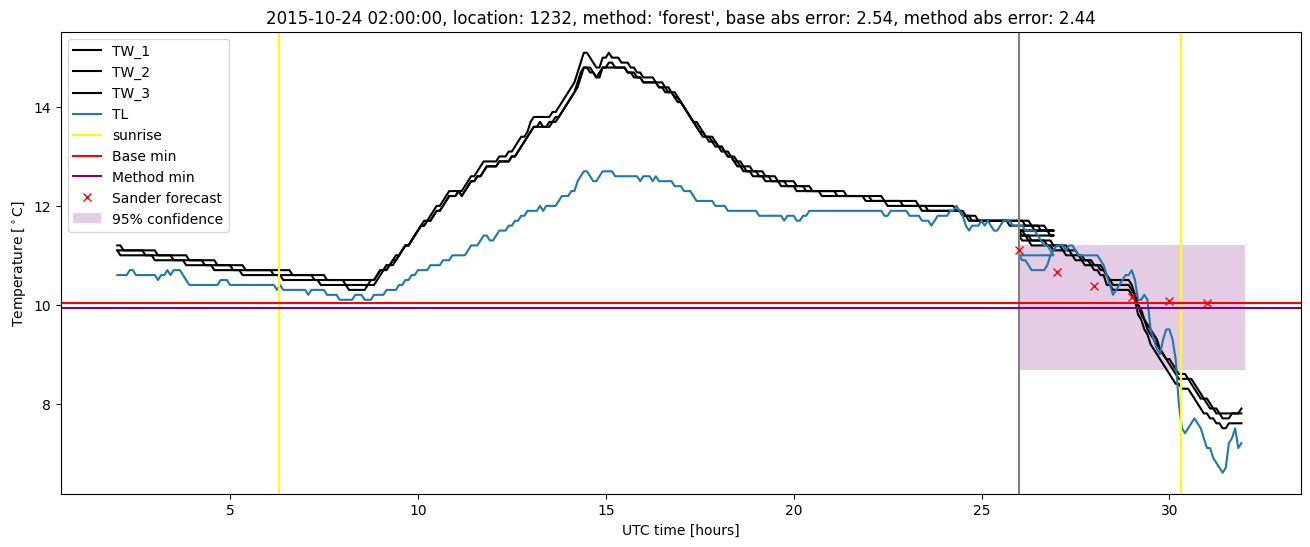
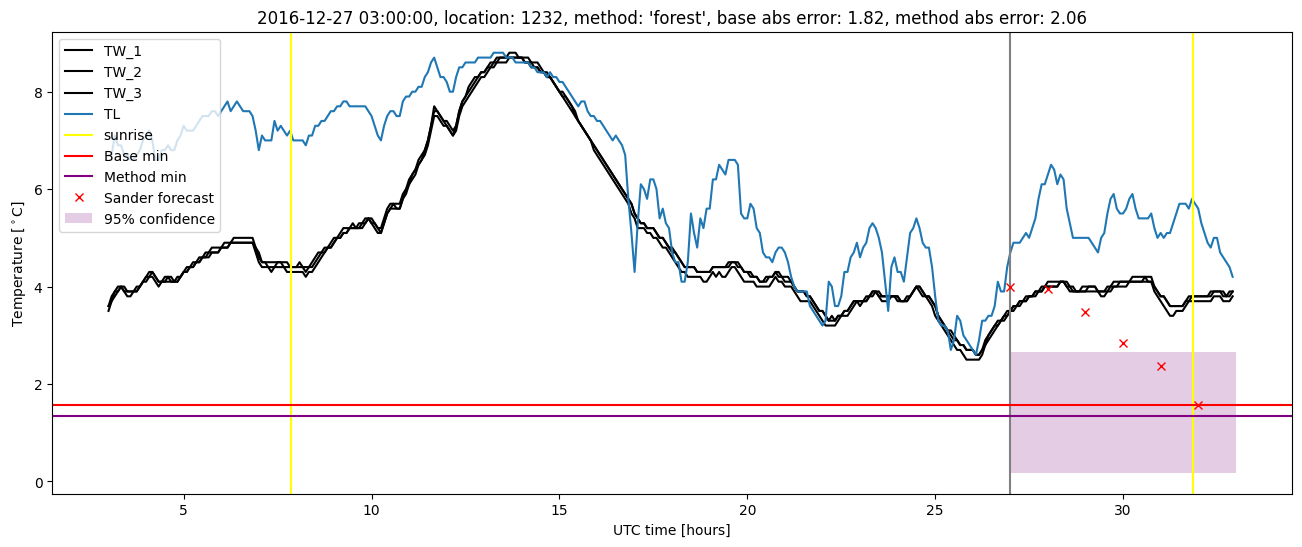
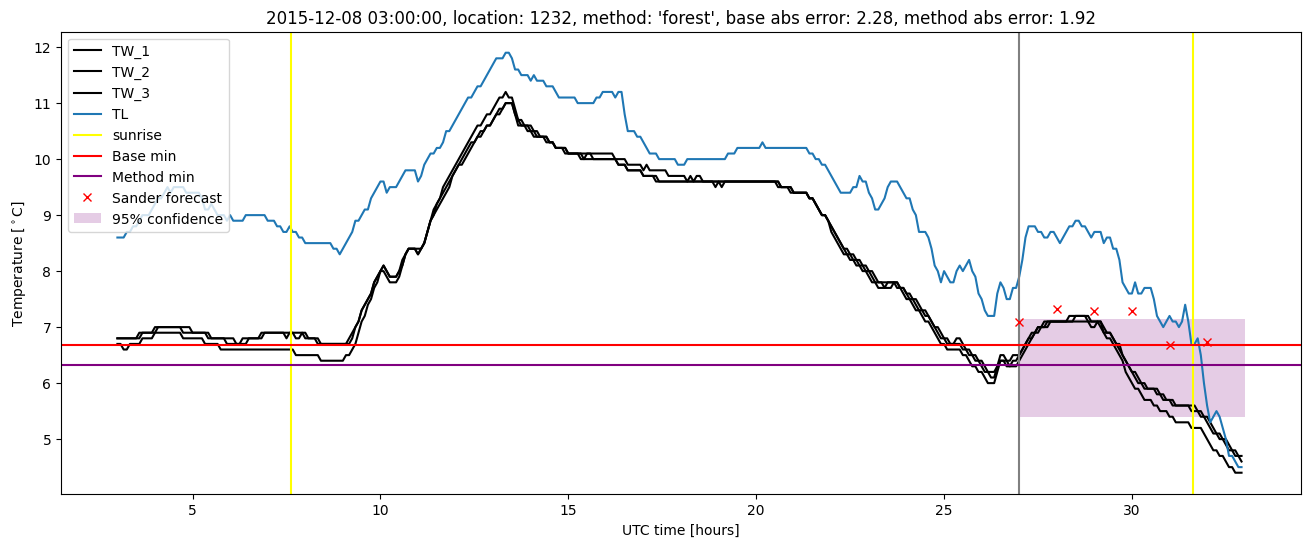
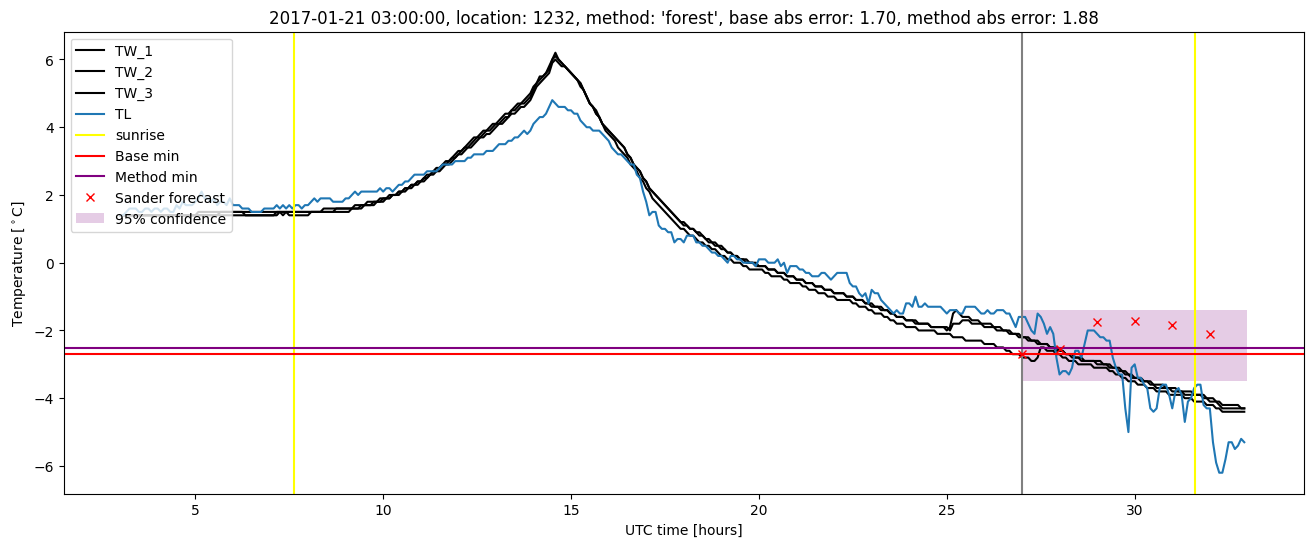
Random forest plots
Extended logistic regression results
| names |
period |
power |
significance |
meanSquareError |
absError |
maxError |
CRPS |
IGN |
| baseline |
winter 2016 |
0.987 |
0.094 |
0.420 |
0.469 |
2.545 |
NaN |
NaN |
| elr |
winter 2016 |
0.987 |
0.094 |
0.375 |
0.490 |
2.328 |
0.667 |
4.275 |
| baseline |
winter 2017 |
0.975 |
0.059 |
0.535 |
0.538 |
2.063 |
NaN |
NaN |
| elr |
winter 2017 |
0.950 |
0.029 |
0.496 |
0.546 |
2.015 |
0.629 |
3.697 |
| baseline |
winter 2018 |
0.986 |
0.171 |
0.421 |
0.480 |
2.611 |
NaN |
NaN |
| elr |
winter 2018 |
0.986 |
0.114 |
0.378 |
0.453 |
2.474 |
0.654 |
3.777 |
| baseline |
winter 2019 |
0.987 |
0.000e+00 |
0.432 |
0.496 |
2.211 |
NaN |
NaN |
| elr |
winter 2019 |
0.993 |
0.000e+00 |
0.385 |
0.462 |
1.833 |
0.596 |
3.227 |
| baseline |
all |
0.984 |
0.097 |
0.449 |
0.494 |
2.611 |
NaN |
NaN |
| elr |
all |
0.981 |
0.071 |
0.405 |
0.486 |
2.474 |
0.638 |
3.766 |
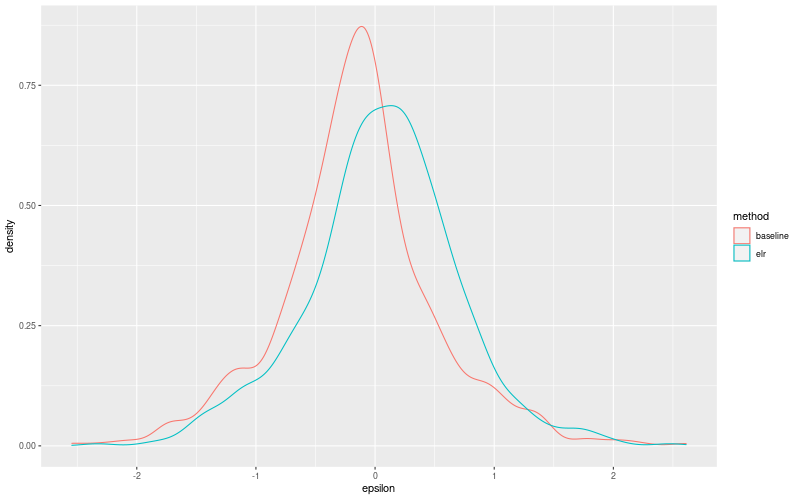
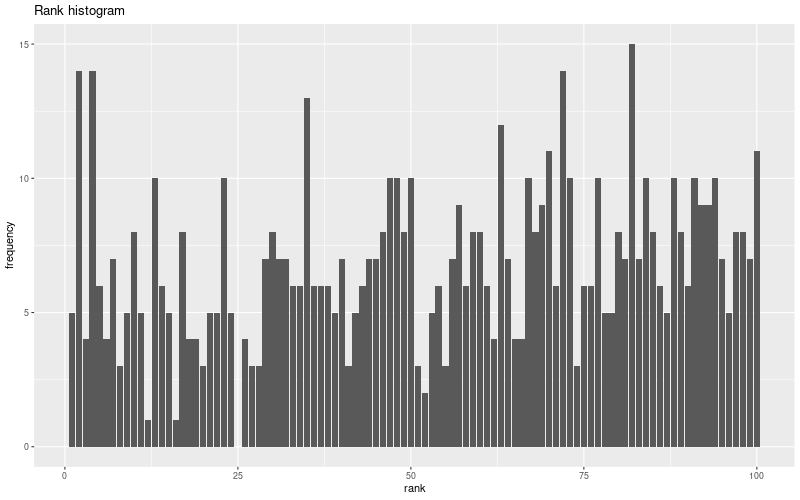
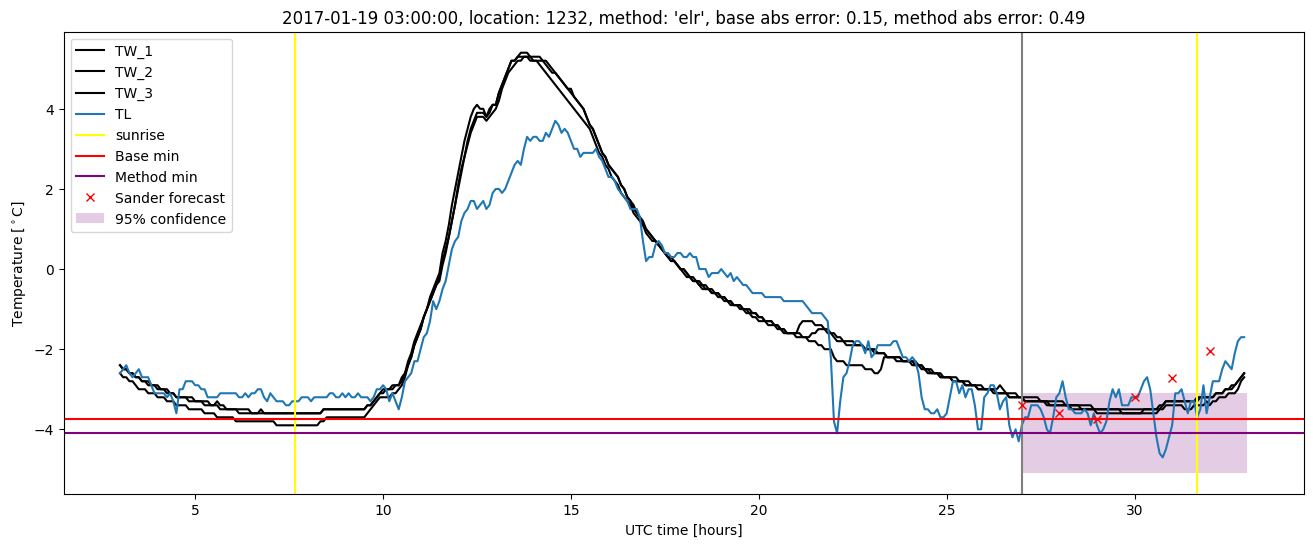
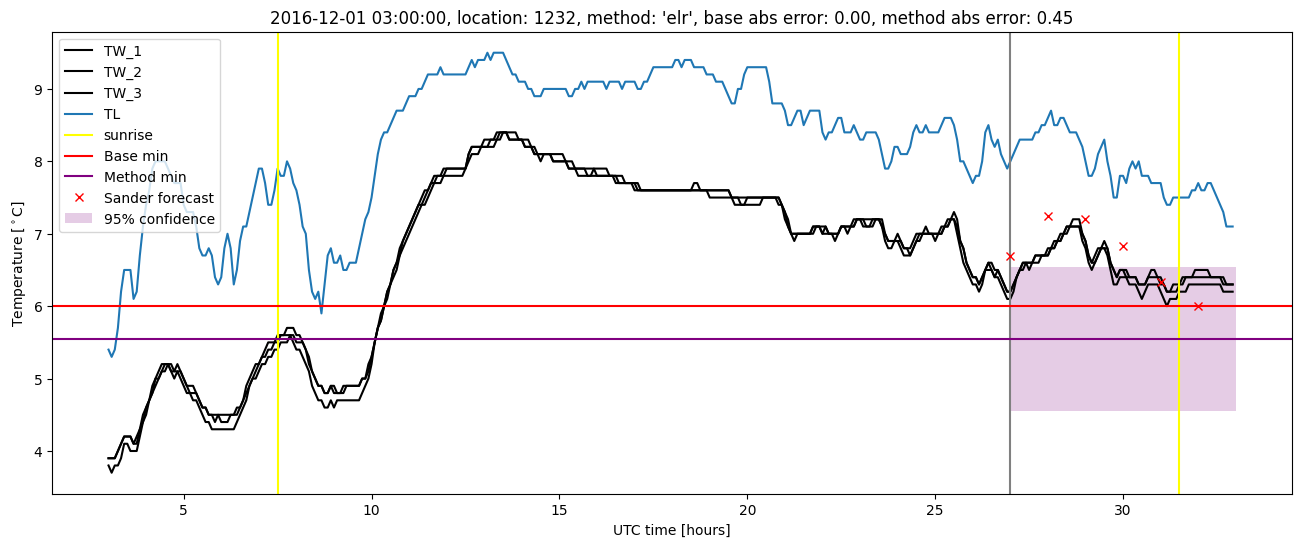
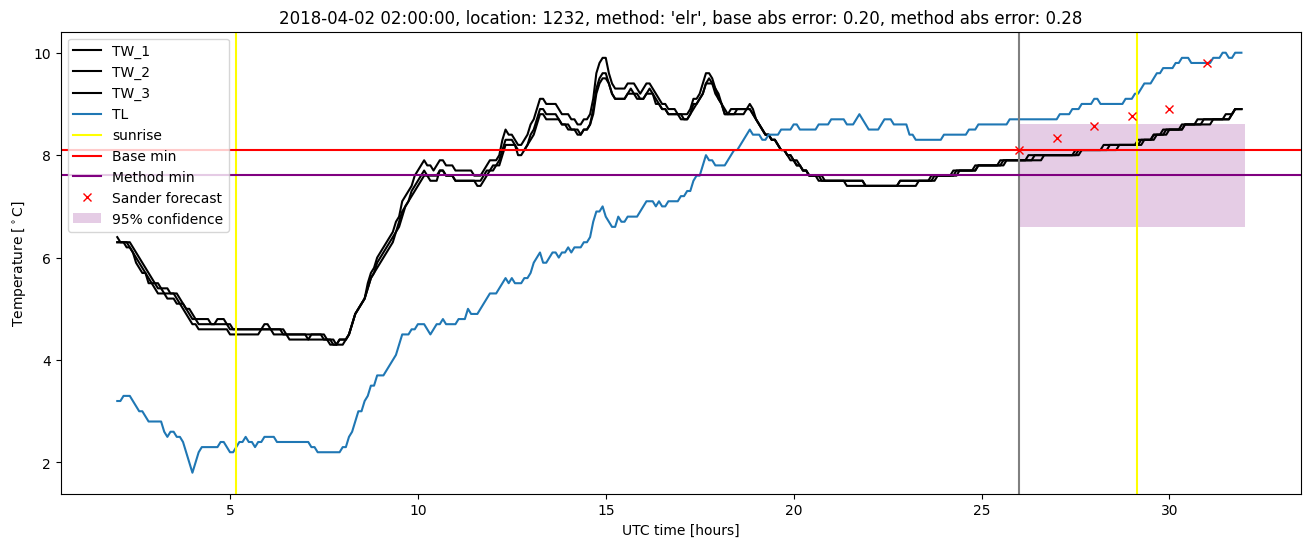
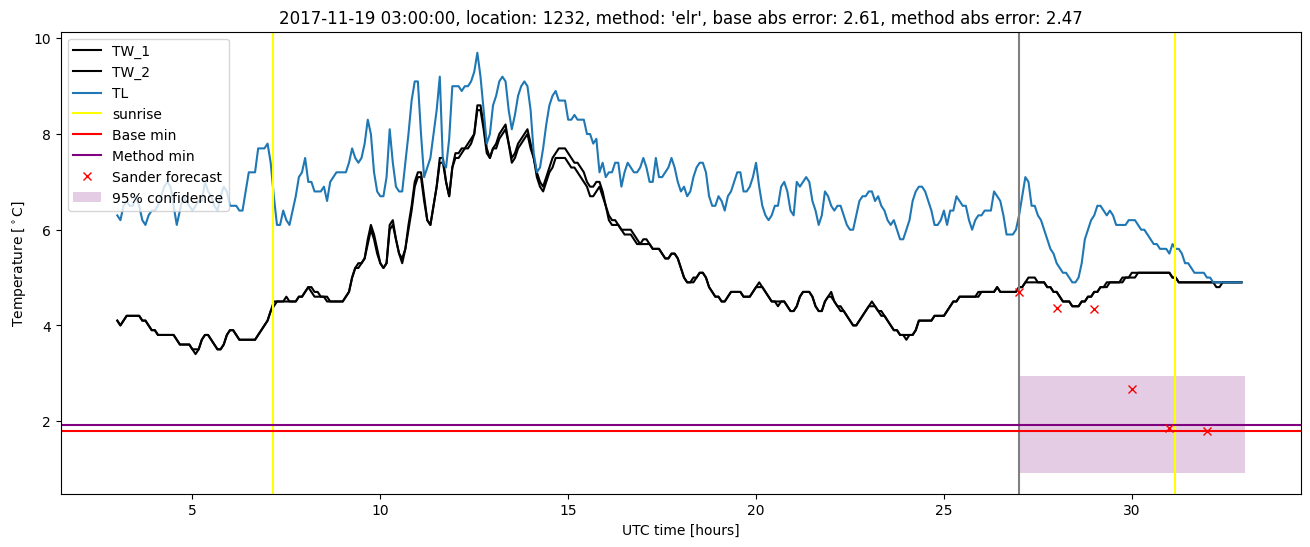
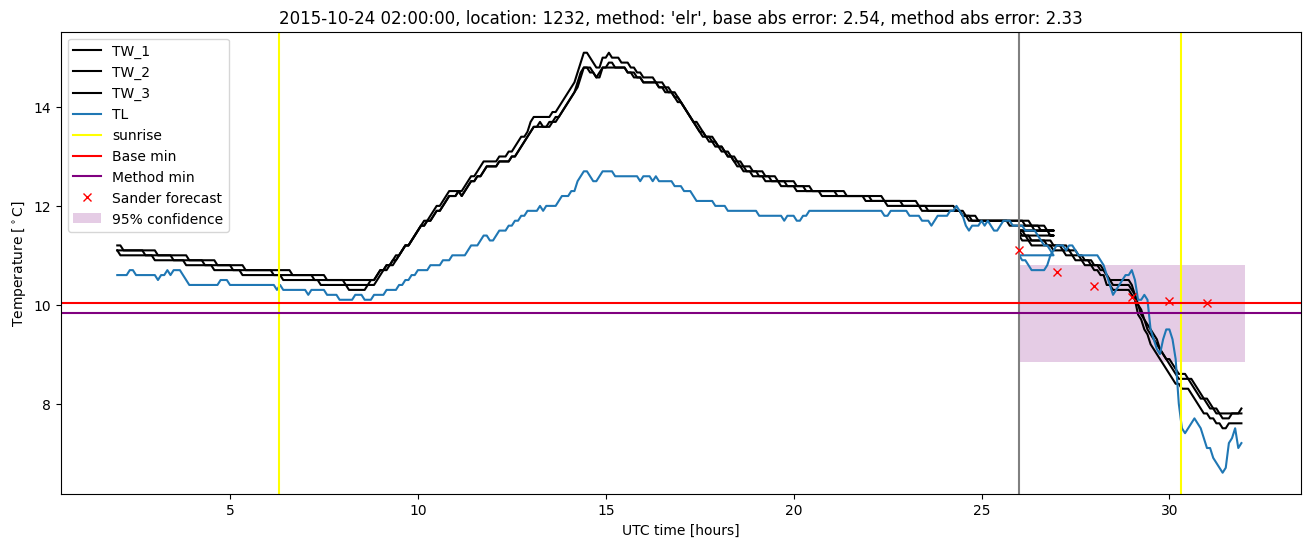
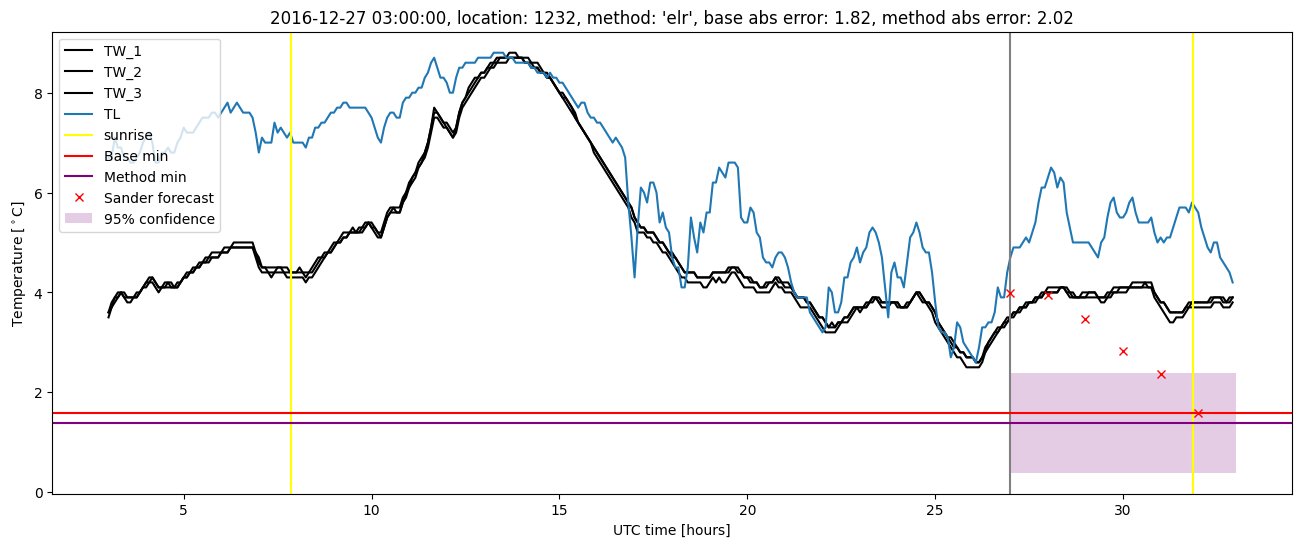
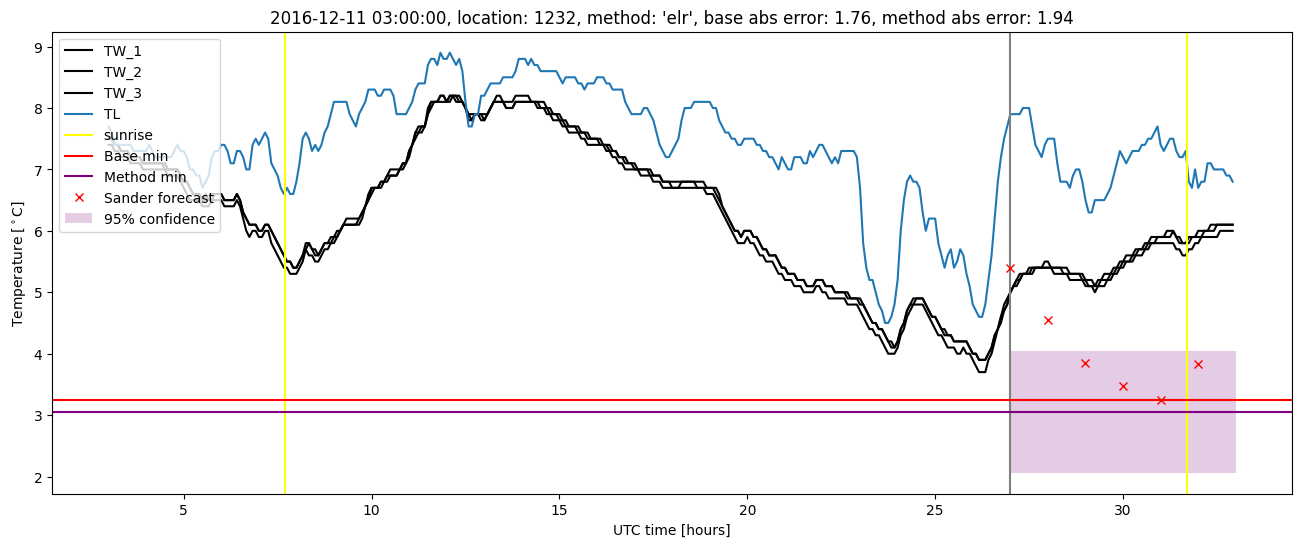
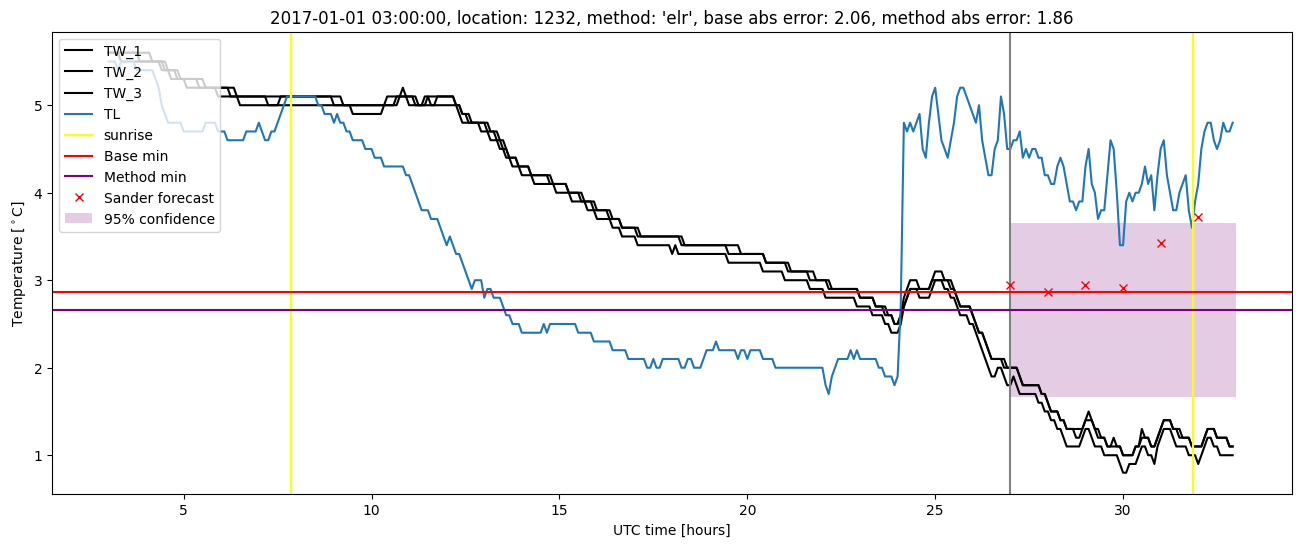
Extended logistic regression plots