GMS location: 1231
Random forest results
| names |
period |
power |
significance |
meanSquareError |
absError |
maxError |
CRPS |
IGN |
| baseline |
winter 2016 |
0.976 |
0.038 |
0.410 |
0.486 |
2.326 |
NaN |
NaN |
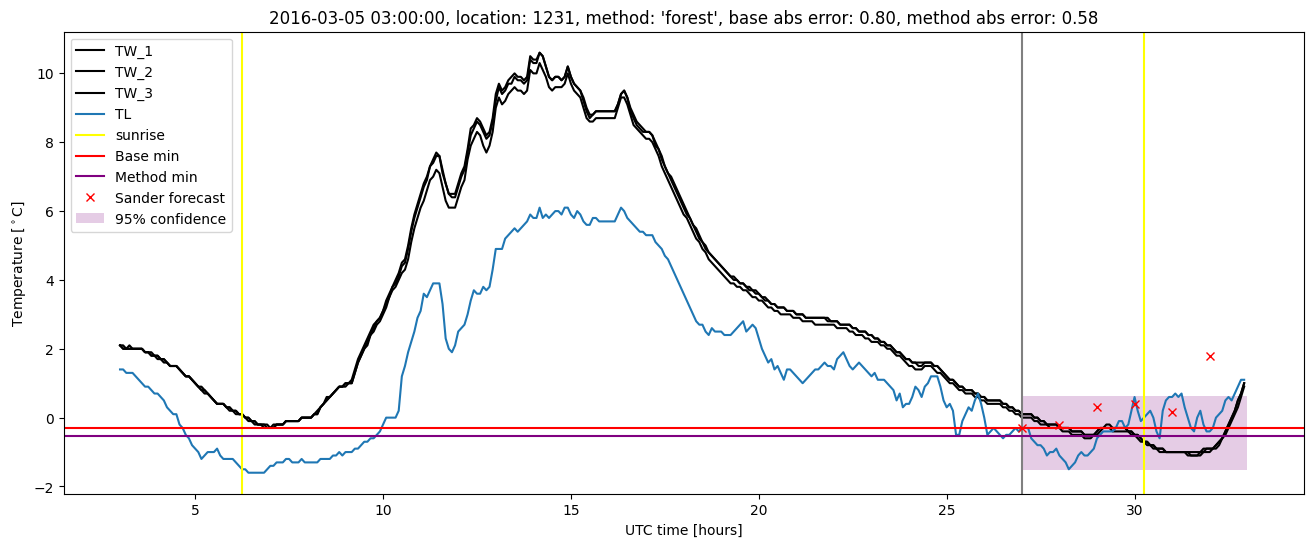
| forest |
winter 2016 |
0.982 |
0.038 |
0.329 |
0.430 |
2.175 |
0.573 |
4.054 |
| baseline |
winter 2017 |
0.976 |
0.033 |
0.384 |
0.466 |
1.904 |
NaN |
NaN |
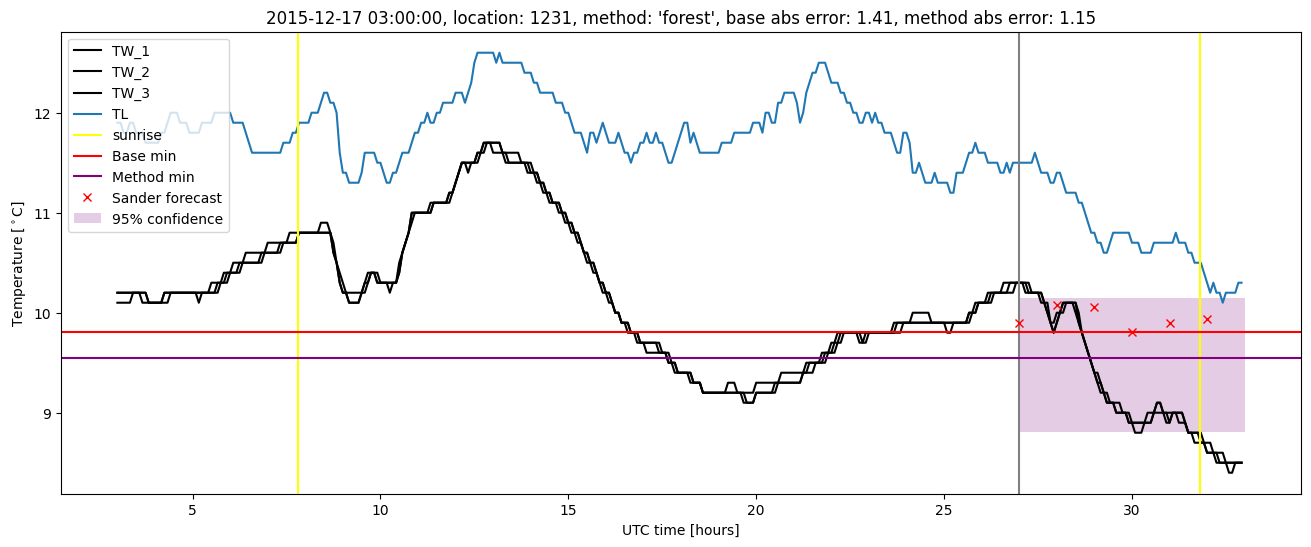
| forest |
winter 2017 |
0.968 |
0.000e+00 |
0.325 |
0.432 |
1.751 |
0.552 |
3.263 |
| baseline |
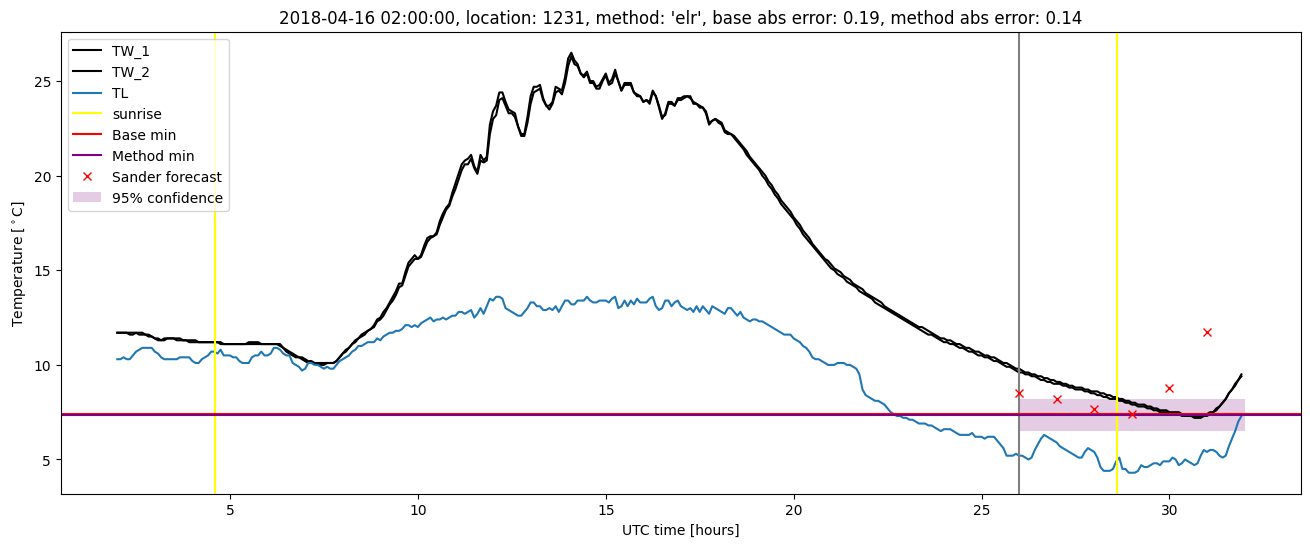
winter 2018 |
0.986 |
0.139 |
0.438 |
0.449 |
3.400 |
NaN |
NaN |
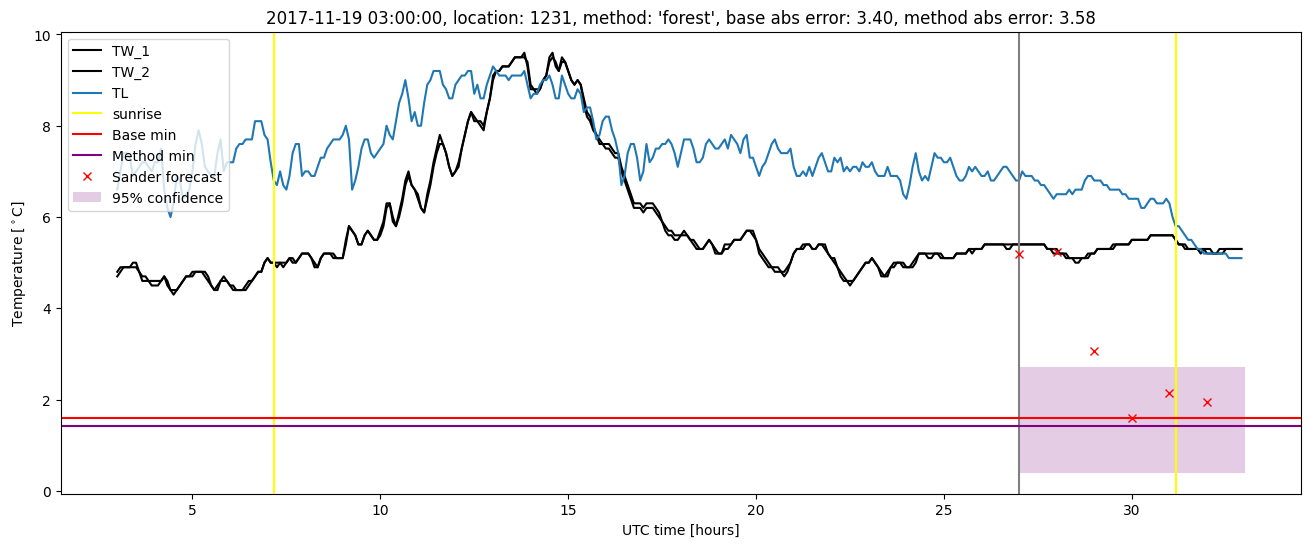
| forest |
winter 2018 |
0.979 |
0.167 |
0.418 |
0.437 |
3.584 |
0.597 |
3.927 |
| baseline |
winter 2019 |
0.987 |
0.077 |
0.310 |
0.422 |
1.870 |
NaN |
NaN |
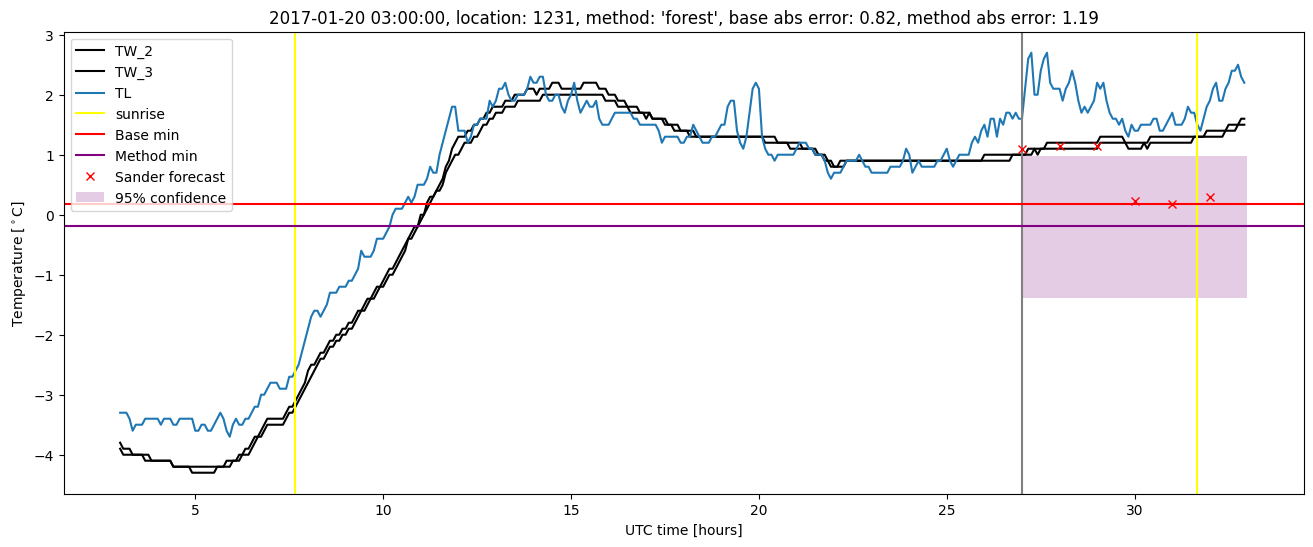
| forest |
winter 2019 |
0.993 |
0.077 |
0.224 |
0.358 |
1.599 |
0.582 |
3.686 |
| baseline |
all |
0.981 |
0.076 |
0.388 |
0.457 |
3.400 |
NaN |
NaN |
| forest |
all |
0.981 |
0.076 |
0.326 |
0.415 |
3.584 |
0.577 |
3.757 |
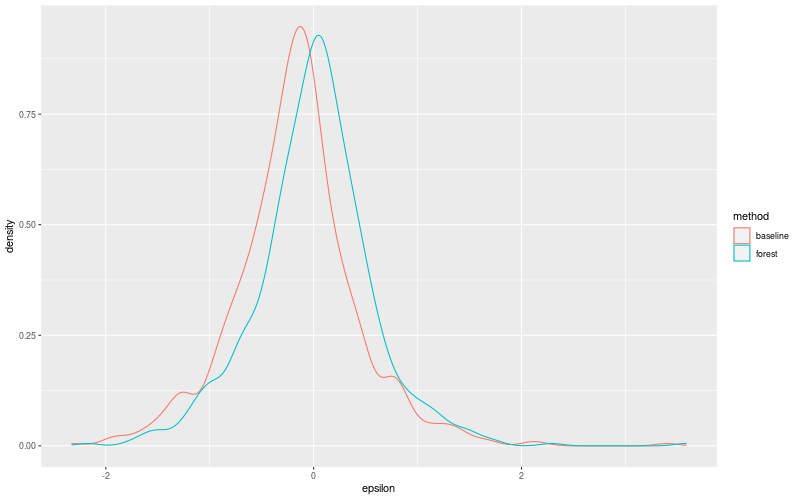
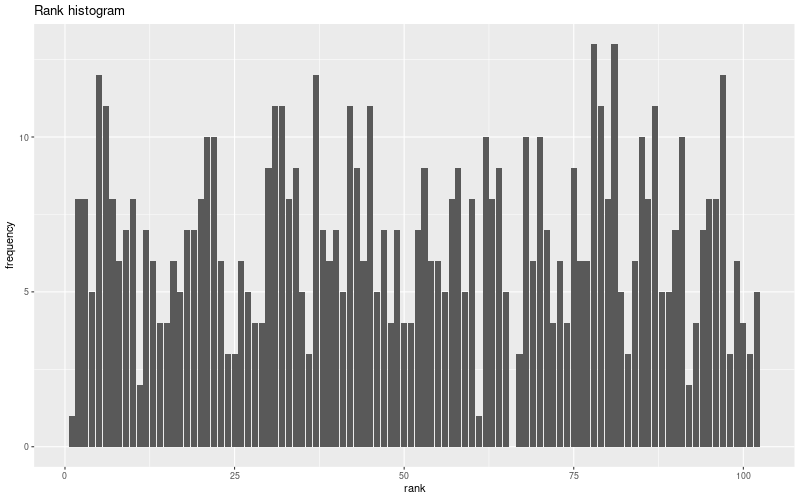
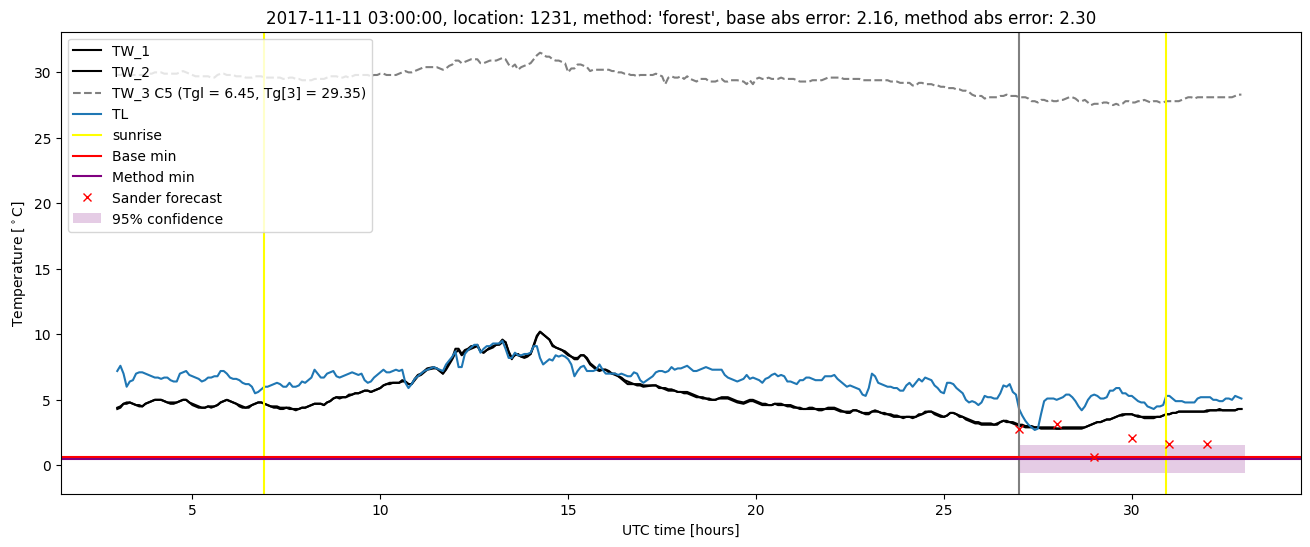
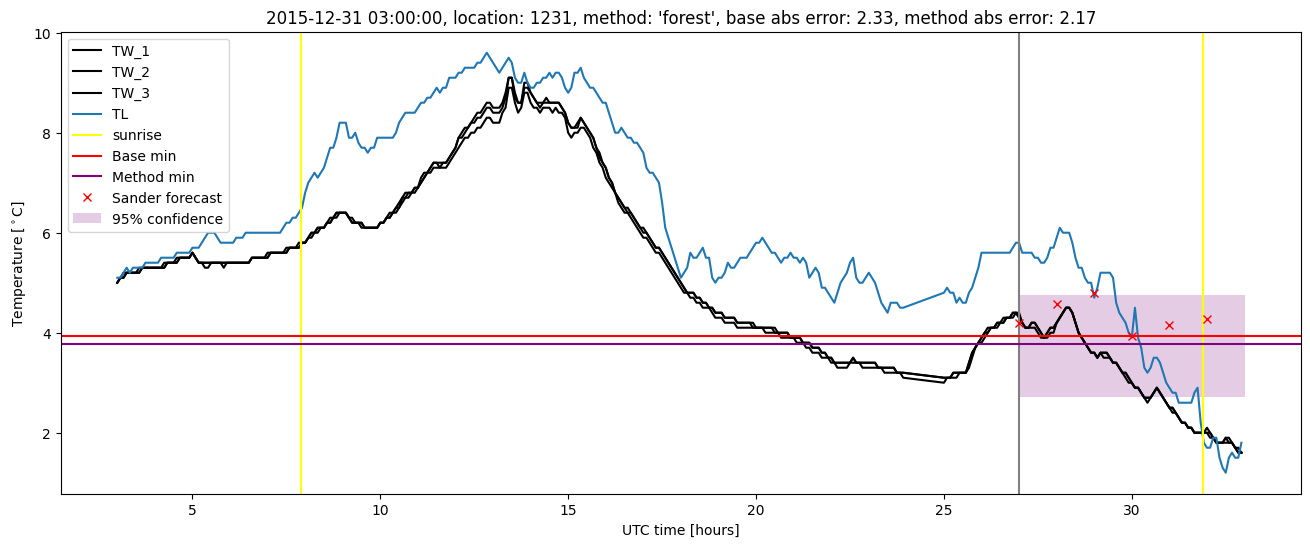
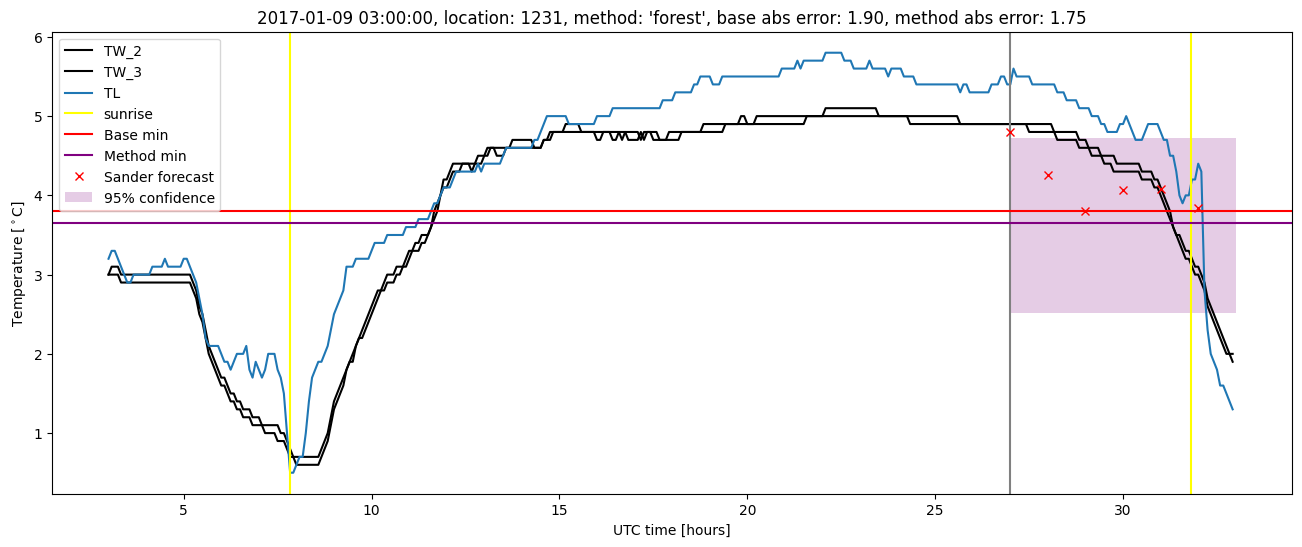
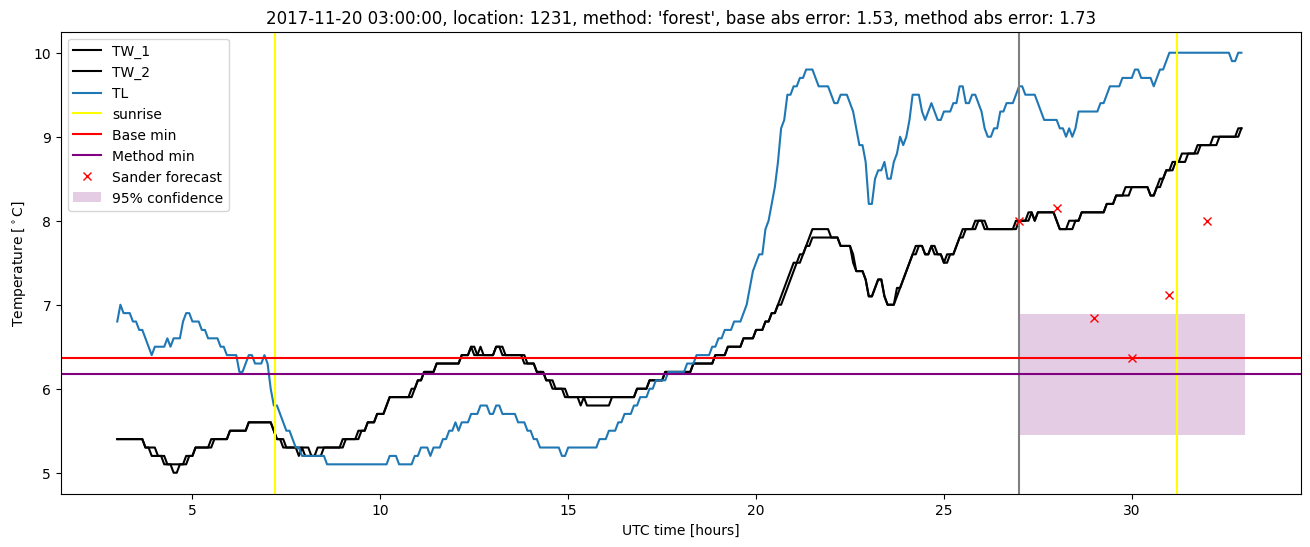
Random forest plots
Extended logistic regression results
| names |
period |
power |
significance |
meanSquareError |
absError |
maxError |
CRPS |
IGN |
| baseline |
winter 2016 |
0.976 |
0.038 |
0.410 |
0.486 |
2.326 |
NaN |
NaN |
| elr |
winter 2016 |
0.976 |
0.077 |
0.336 |
0.463 |
1.906 |
0.672 |
6.720 |
| baseline |
winter 2017 |
0.976 |
0.033 |
0.384 |
0.466 |
1.904 |
NaN |
NaN |
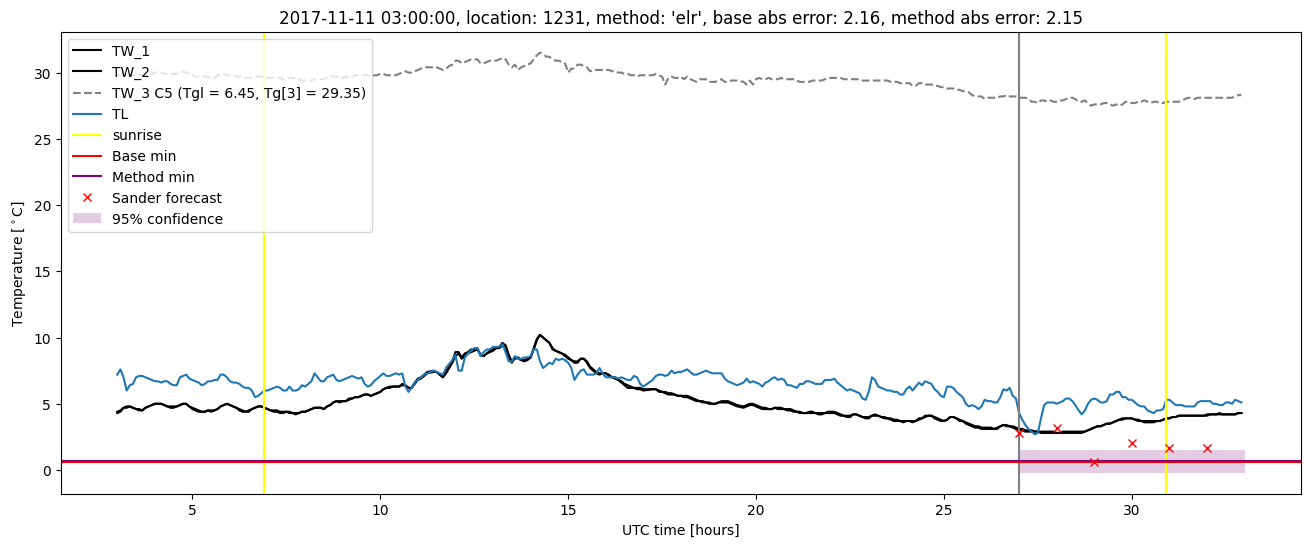
| elr |
winter 2017 |
0.968 |
0.067 |
0.359 |
0.466 |
1.654 |
0.636 |
5.426 |
| baseline |
winter 2018 |
0.986 |
0.139 |
0.438 |
0.449 |
3.400 |
NaN |
NaN |
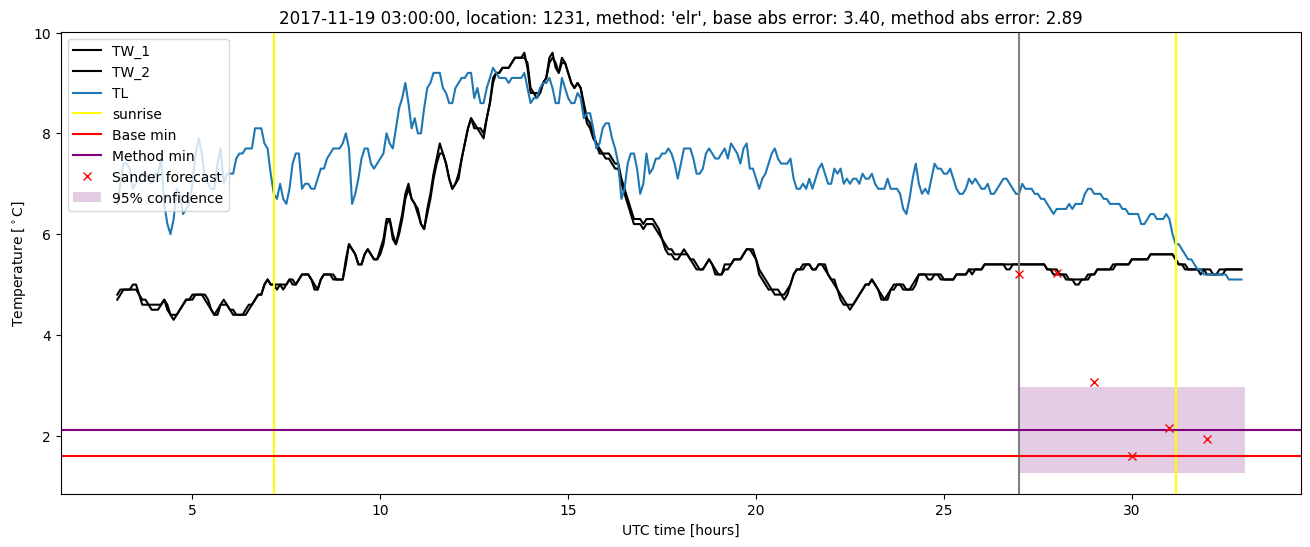
| elr |
winter 2018 |
0.986 |
0.139 |
0.400 |
0.442 |
2.888 |
0.639 |
6.395 |
| baseline |
winter 2019 |
0.987 |
0.077 |
0.310 |
0.422 |
1.870 |
NaN |
NaN |
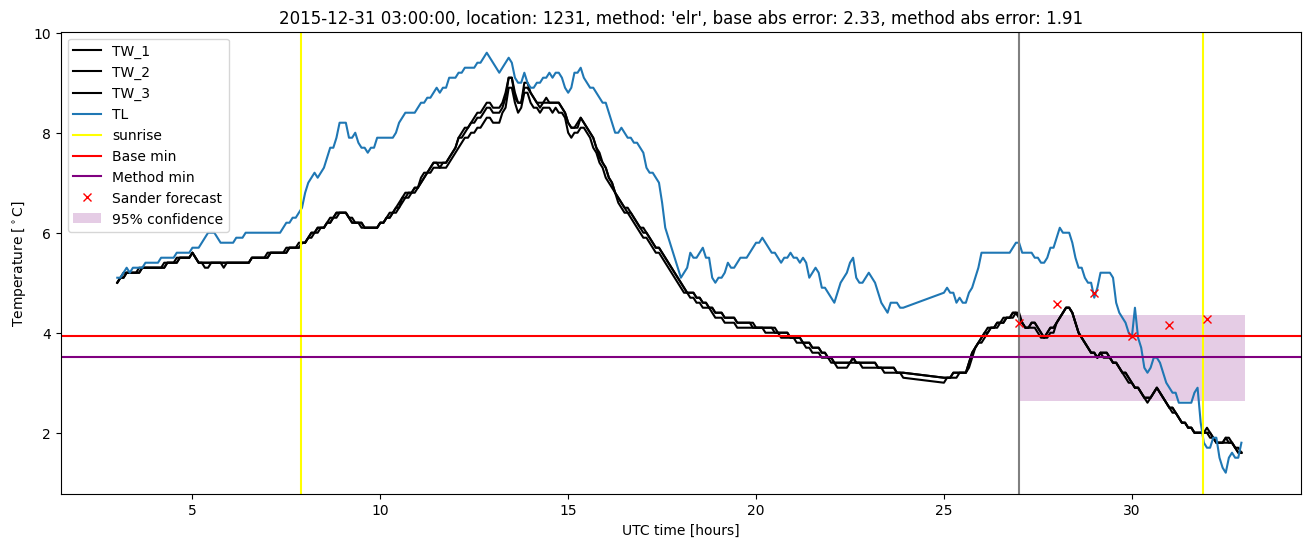
| elr |
winter 2019 |
0.987 |
0.077 |
0.240 |
0.376 |
1.630 |
0.630 |
4.603 |
| baseline |
all |
0.981 |
0.076 |
0.388 |
0.457 |
3.400 |
NaN |
NaN |
| elr |
all |
0.979 |
0.095 |
0.335 |
0.438 |
2.888 |
0.646 |
5.845 |
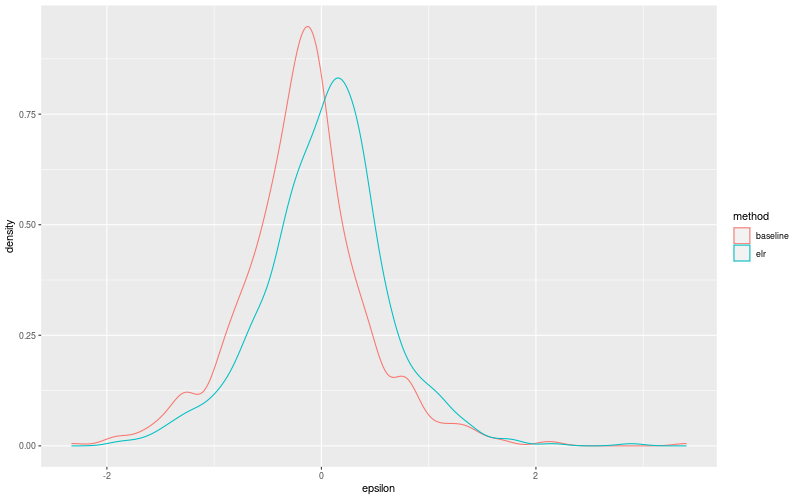
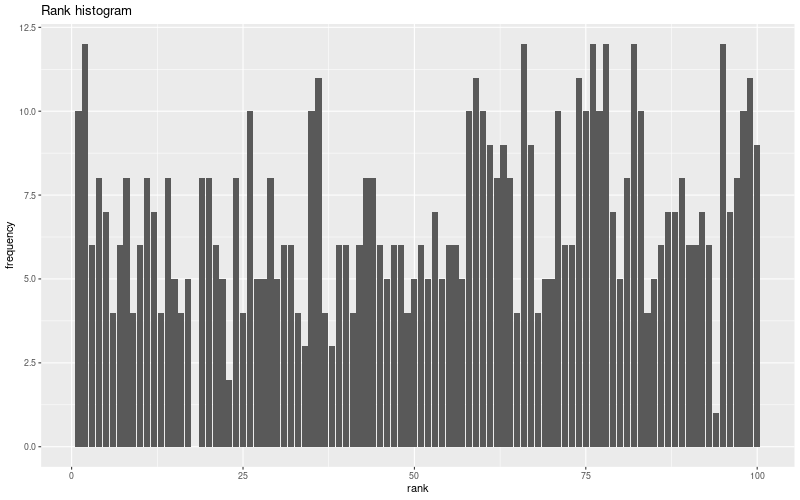
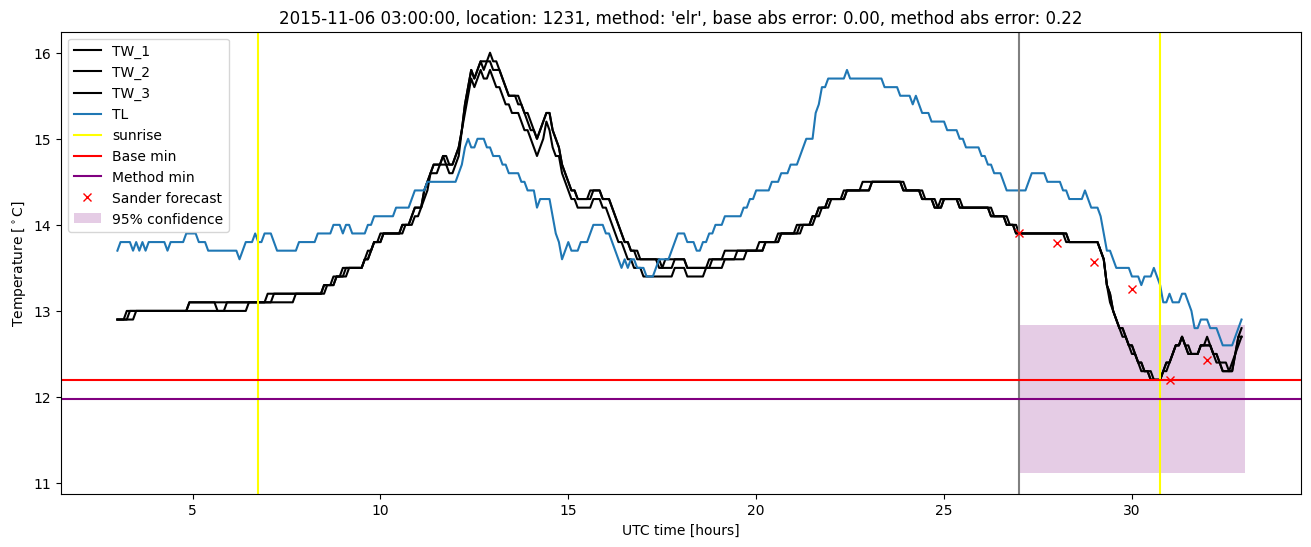
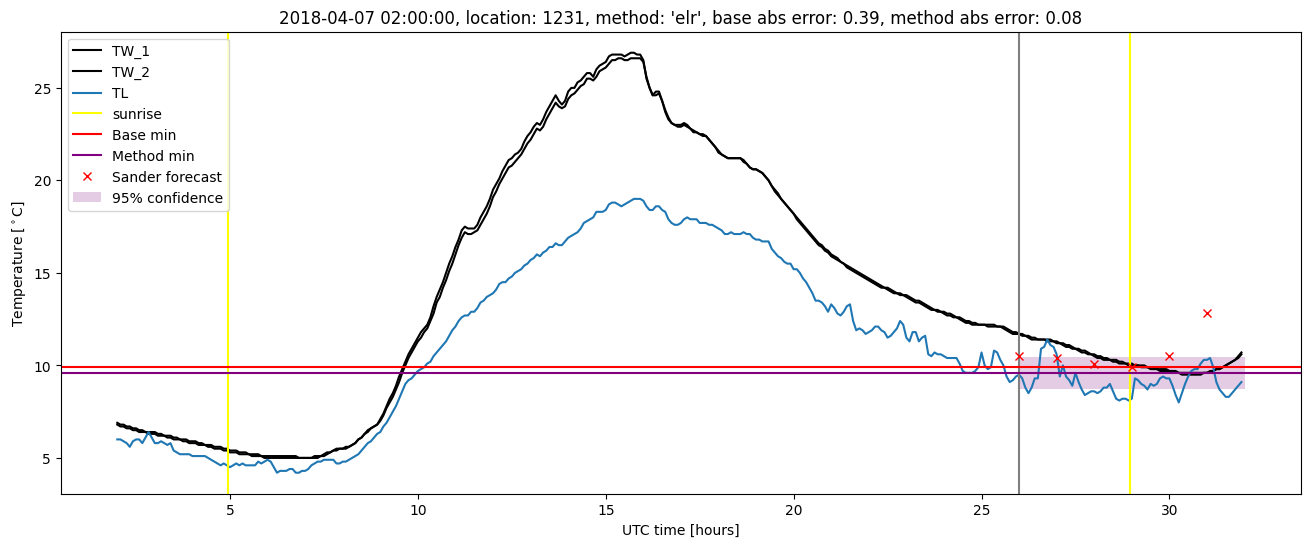
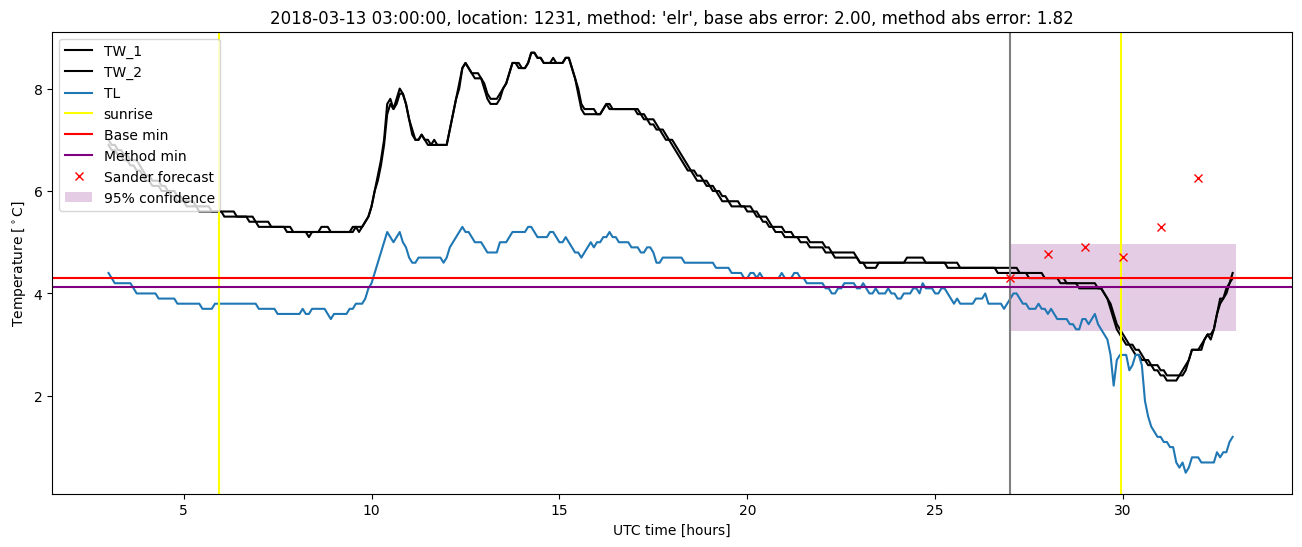
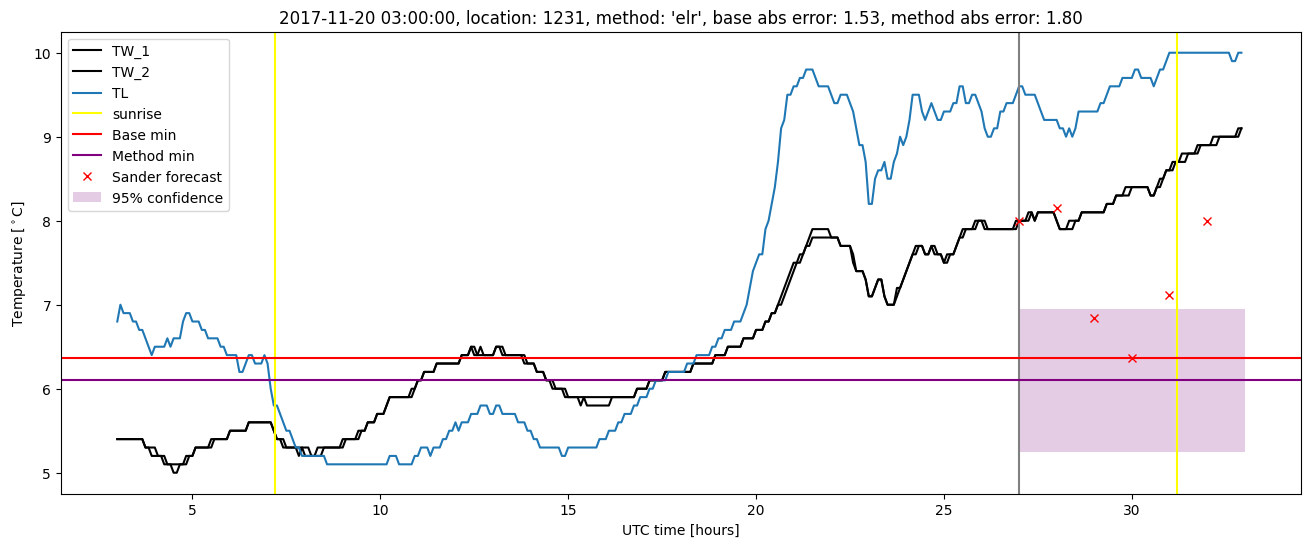
Extended logistic regression plots