GMS location: 1230
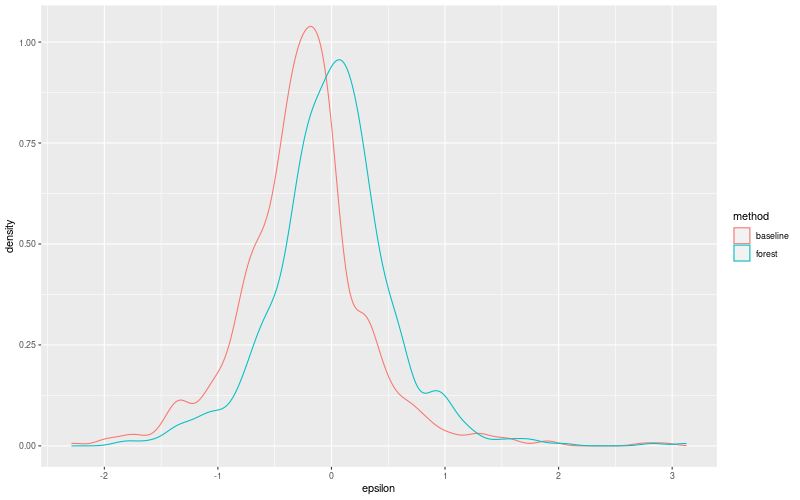
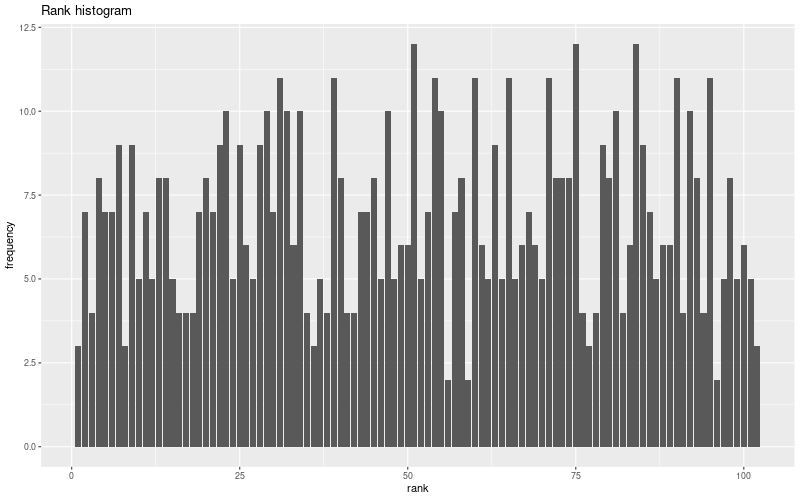
Random forest results
| names |
period |
power |
significance |
meanSquareError |
absError |
maxError |
CRPS |
IGN |
| baseline |
winter 2016 |
1.000 |
0.100 |
0.343 |
0.423 |
2.286 |
NaN |
NaN |
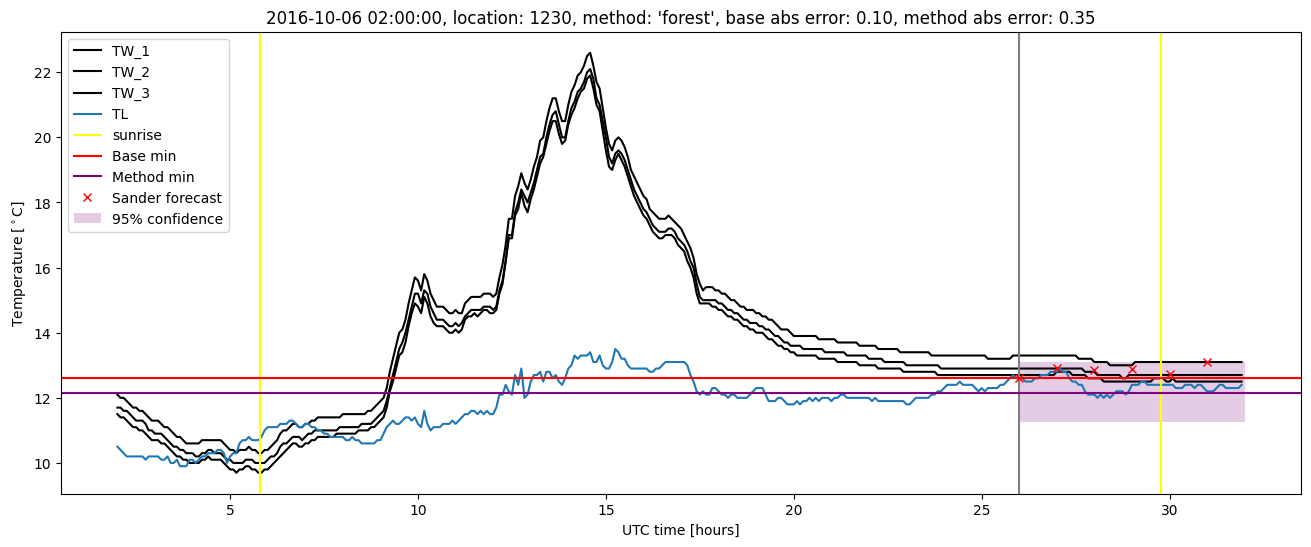
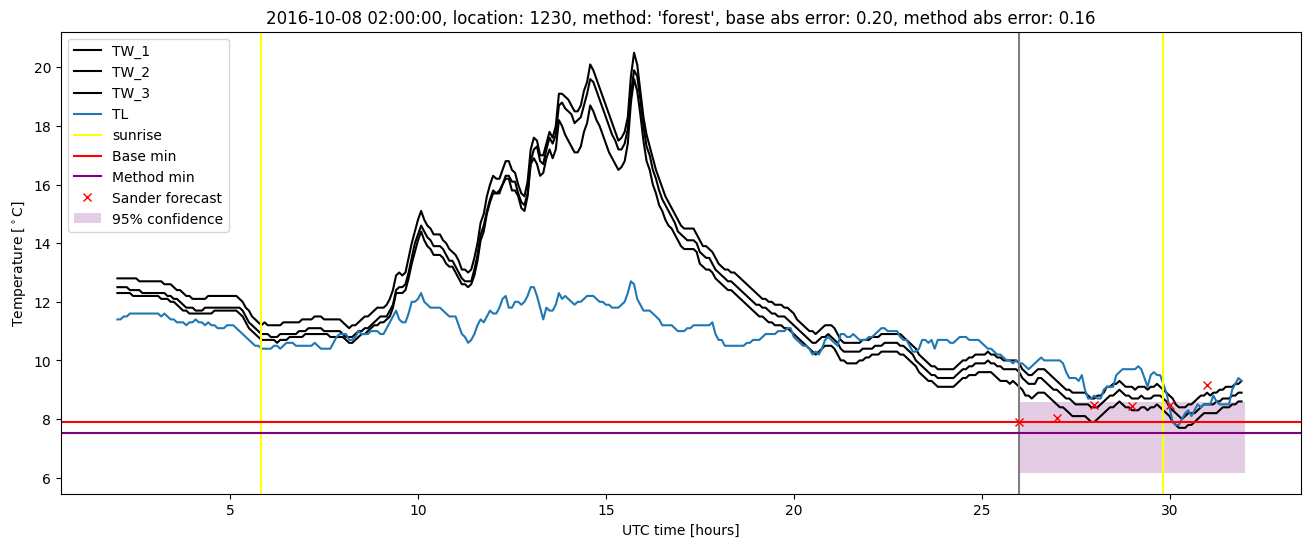
| forest |
winter 2016 |
0.989 |
0.100 |
0.246 |
0.379 |
1.846 |
0.635 |
4.441 |
| baseline |
winter 2017 |
0.992 |
0.067 |
0.317 |
0.427 |
1.922 |
NaN |
NaN |
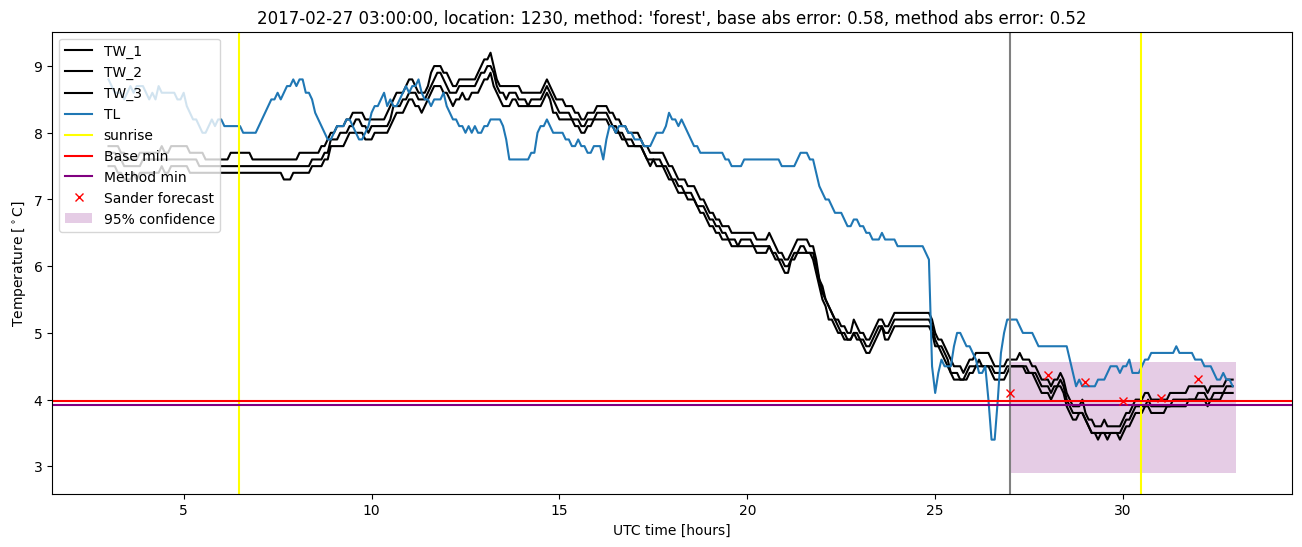
| forest |
winter 2017 |
0.992 |
0.033 |
0.247 |
0.357 |
1.737 |
0.637 |
4.503 |
| baseline |
winter 2018 |
0.974 |
0.107 |
0.450 |
0.485 |
2.934 |
NaN |
NaN |
| forest |
winter 2018 |
0.947 |
0.071 |
0.411 |
0.442 |
3.123 |
0.650 |
5.333 |
| baseline |
winter 2019 |
0.993 |
0.091 |
0.377 |
0.481 |
1.779 |
NaN |
NaN |
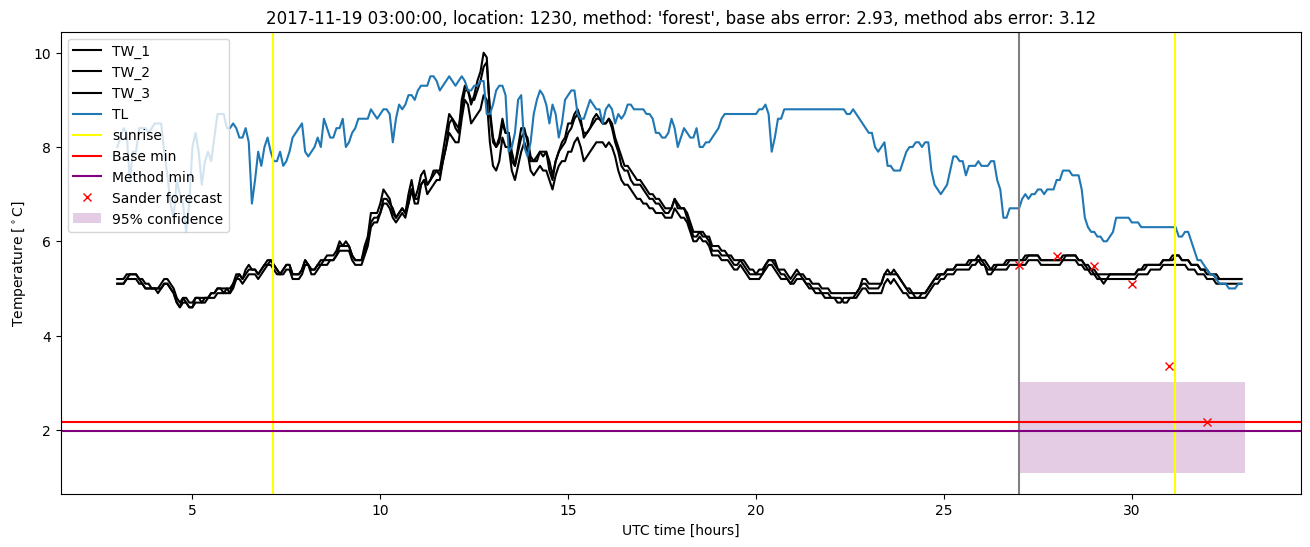
| forest |
winter 2019 |
0.993 |
0.091 |
0.228 |
0.353 |
1.401 |
0.668 |
5.350 |
| baseline |
all |
0.990 |
0.090 |
0.372 |
0.453 |
2.934 |
NaN |
NaN |
| forest |
all |
0.980 |
0.067 |
0.285 |
0.385 |
3.123 |
0.647 |
4.890 |
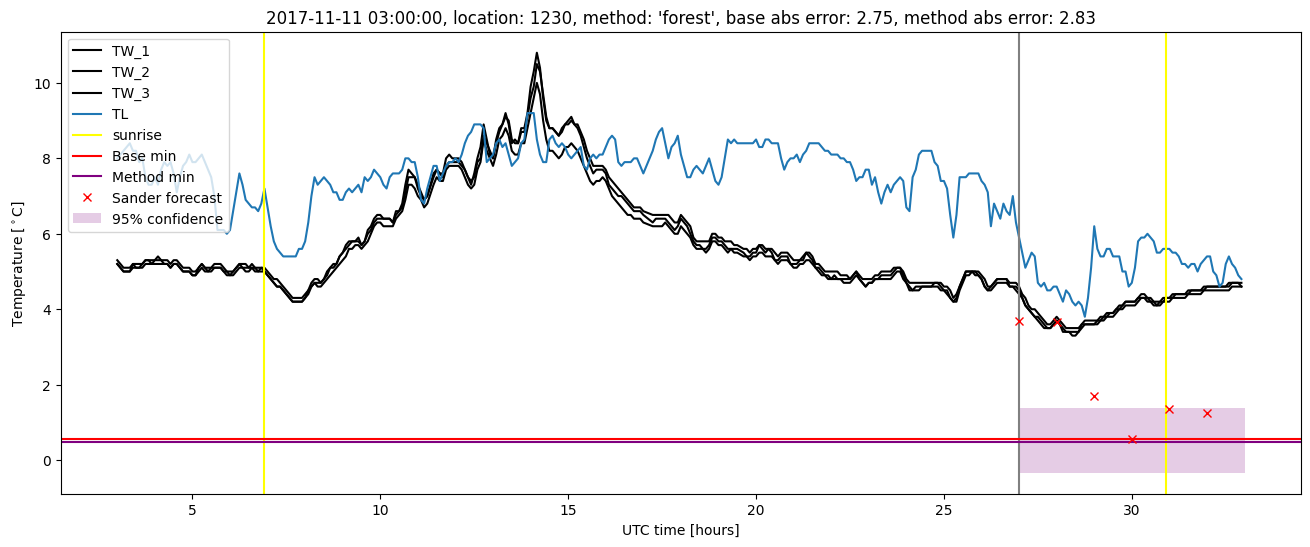
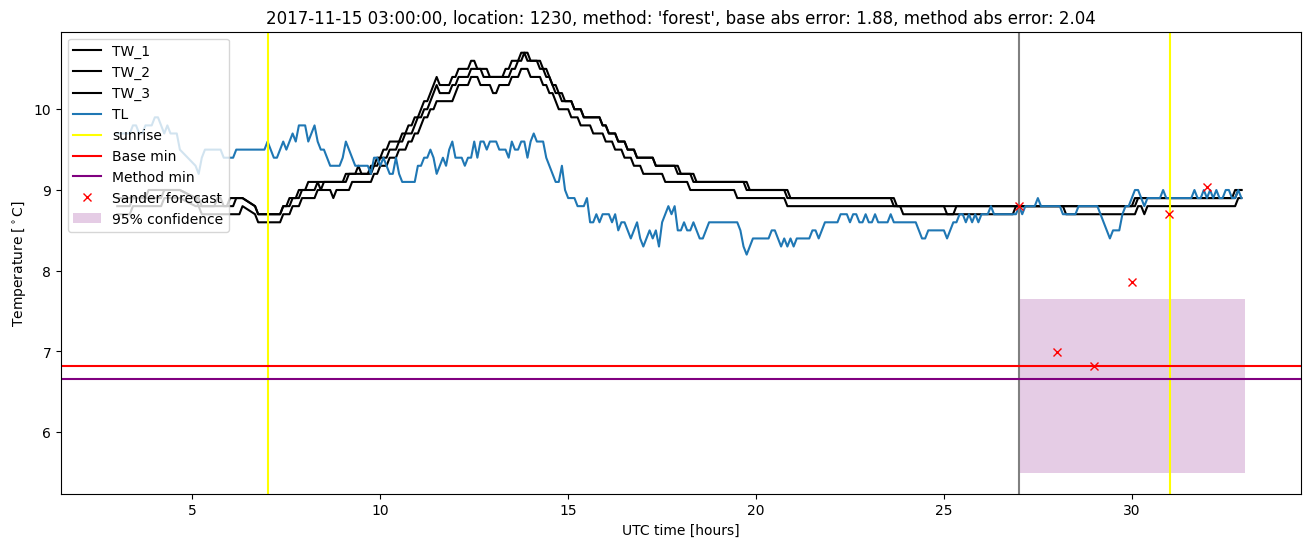
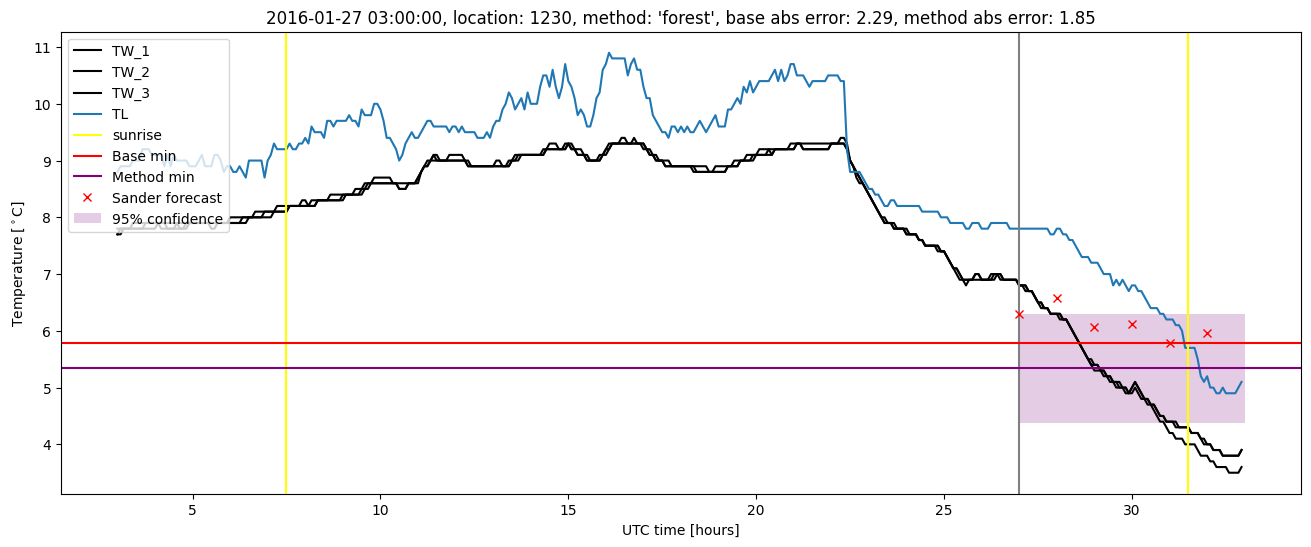
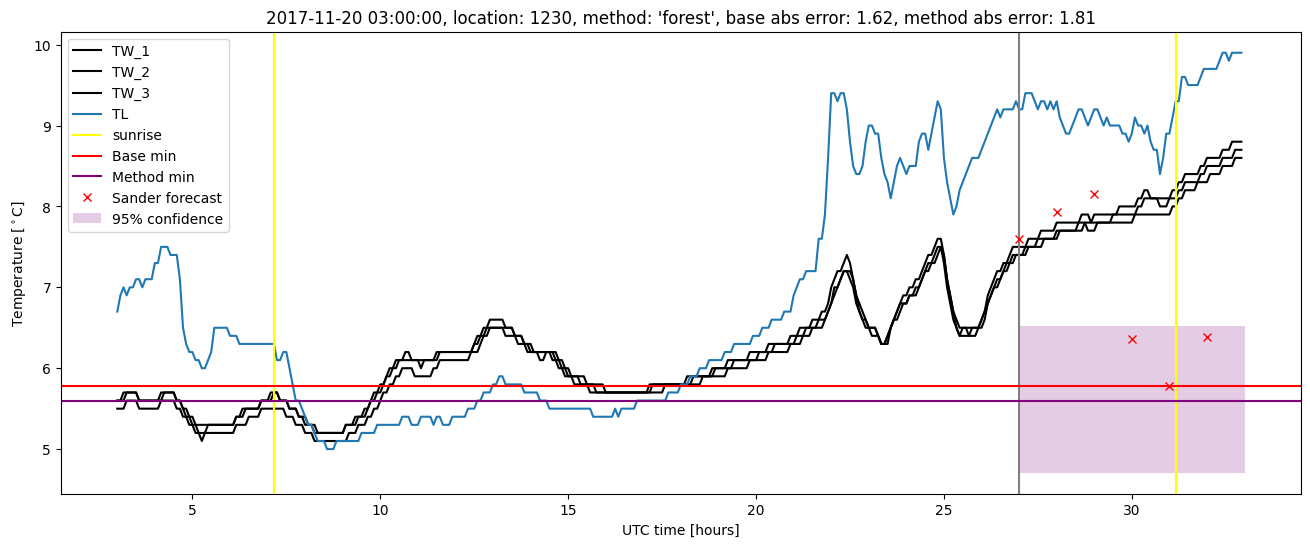
Random forest plots
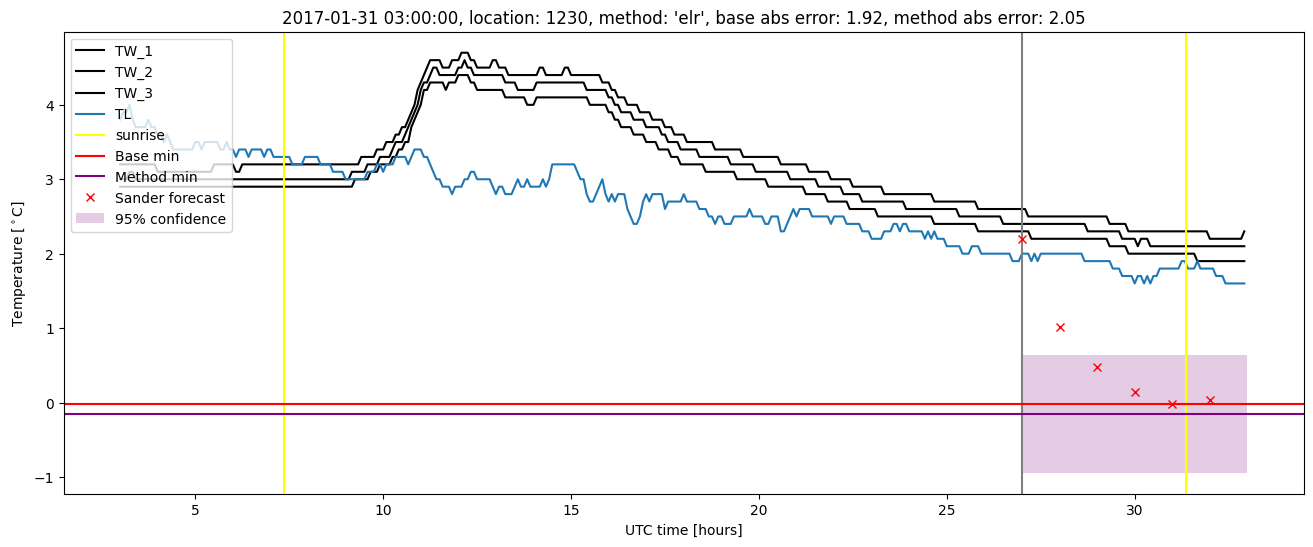
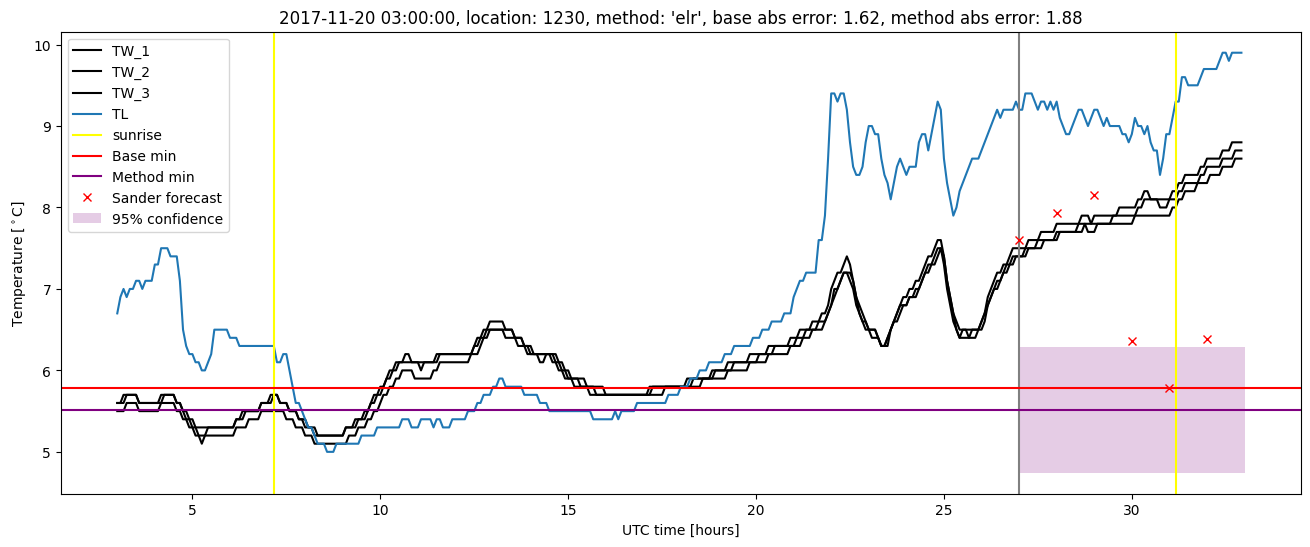
Extended logistic regression results
| names |
period |
power |
significance |
meanSquareError |
absError |
maxError |
CRPS |
IGN |
| baseline |
winter 2016 |
1.000 |
0.100 |
0.343 |
0.423 |
2.286 |
NaN |
NaN |
| elr |
winter 2016 |
0.984 |
0.050 |
0.284 |
0.405 |
1.799 |
0.771 |
1.160e+01 |
| baseline |
winter 2017 |
0.992 |
0.067 |
0.317 |
0.427 |
1.922 |
NaN |
NaN |
| elr |
winter 2017 |
0.984 |
0.033 |
0.286 |
0.391 |
2.052 |
0.731 |
1.039e+01 |
| baseline |
winter 2018 |
0.974 |
0.107 |
0.450 |
0.485 |
2.934 |
NaN |
NaN |
| elr |
winter 2018 |
0.961 |
0.071 |
0.395 |
0.442 |
3.025 |
0.740 |
1.167e+01 |
| baseline |
winter 2019 |
0.993 |
0.091 |
0.377 |
0.481 |
1.779 |
NaN |
NaN |
| elr |
winter 2019 |
0.993 |
0.000e+00 |
0.240 |
0.365 |
1.440 |
0.764 |
9.697 |
| baseline |
all |
0.990 |
0.090 |
0.372 |
0.453 |
2.934 |
NaN |
NaN |
| elr |
all |
0.980 |
0.045 |
0.303 |
0.403 |
3.025 |
0.752 |
1.093e+01 |
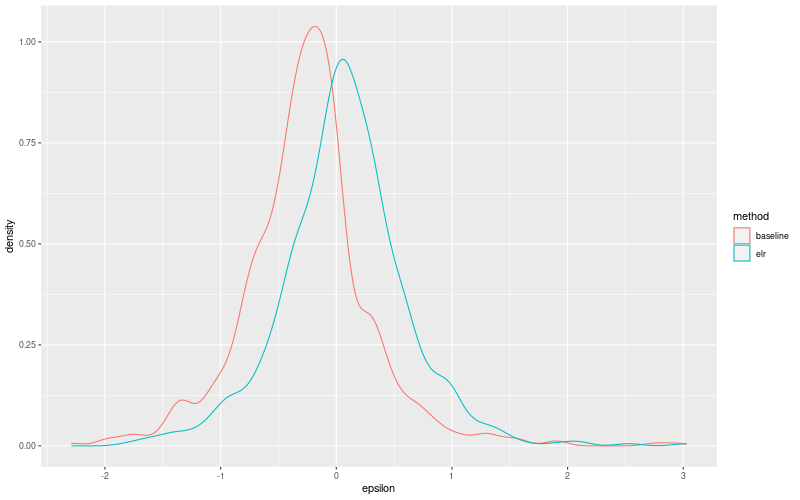
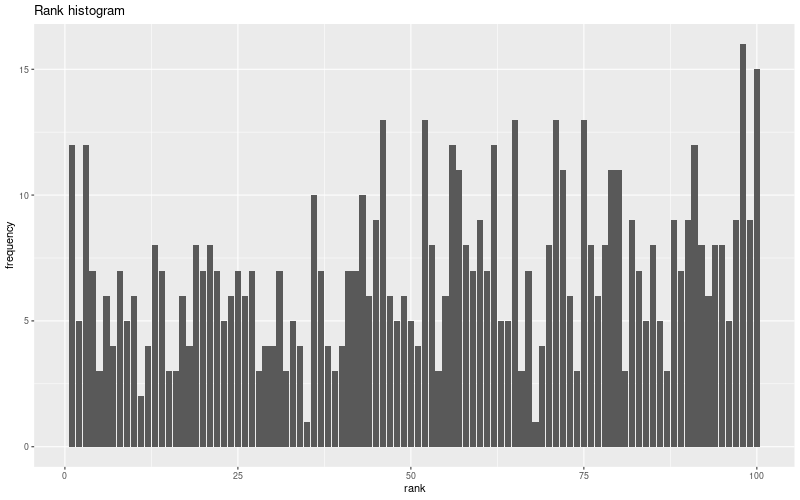
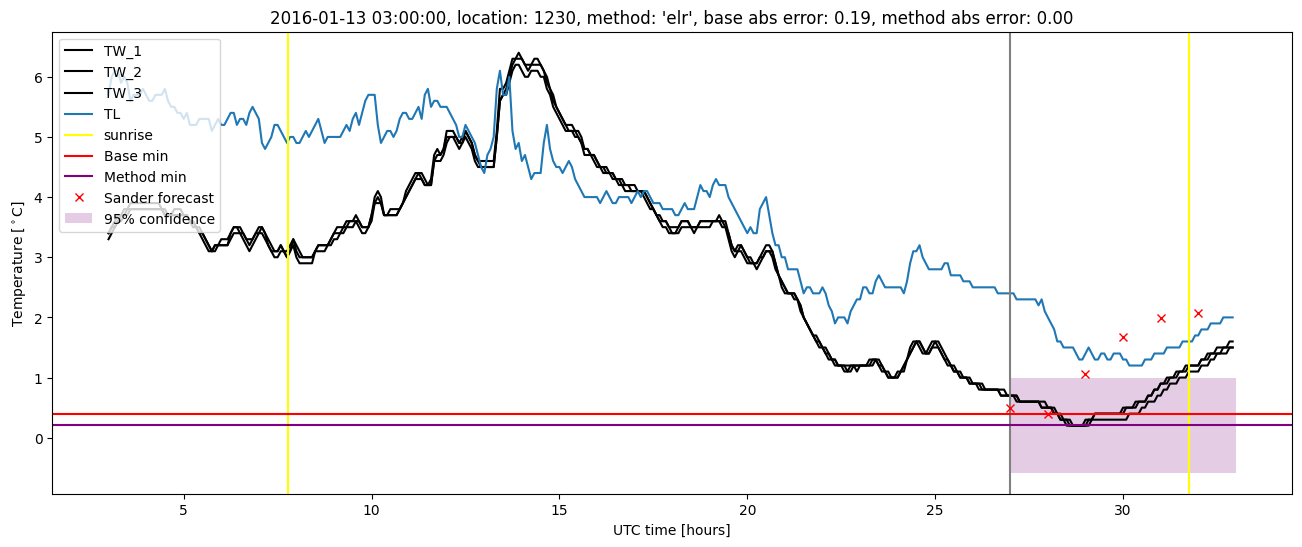
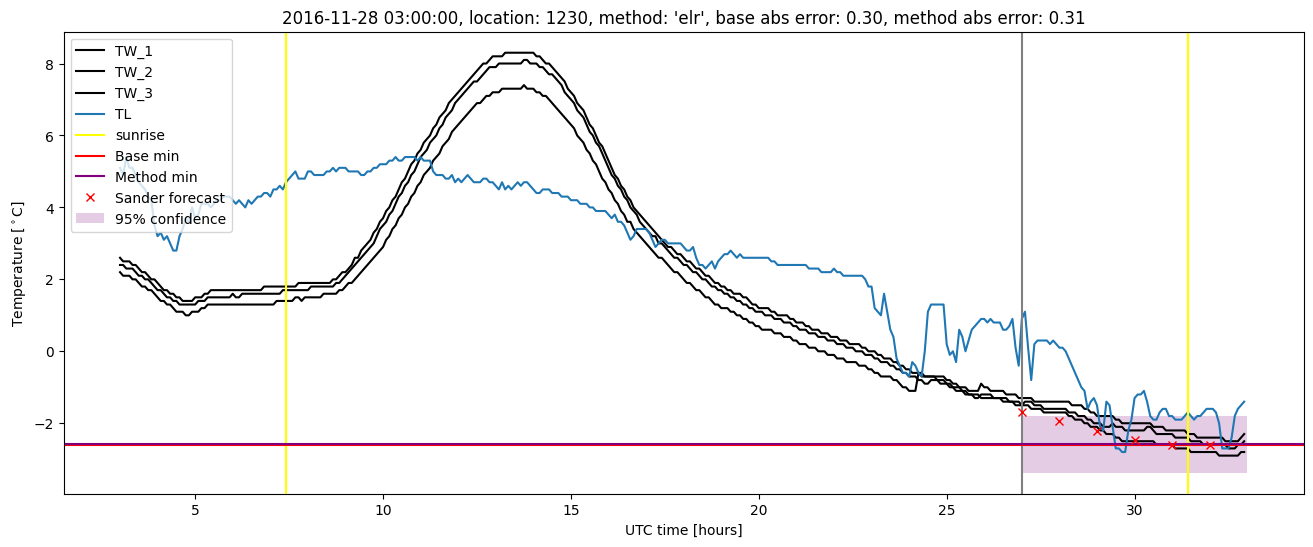
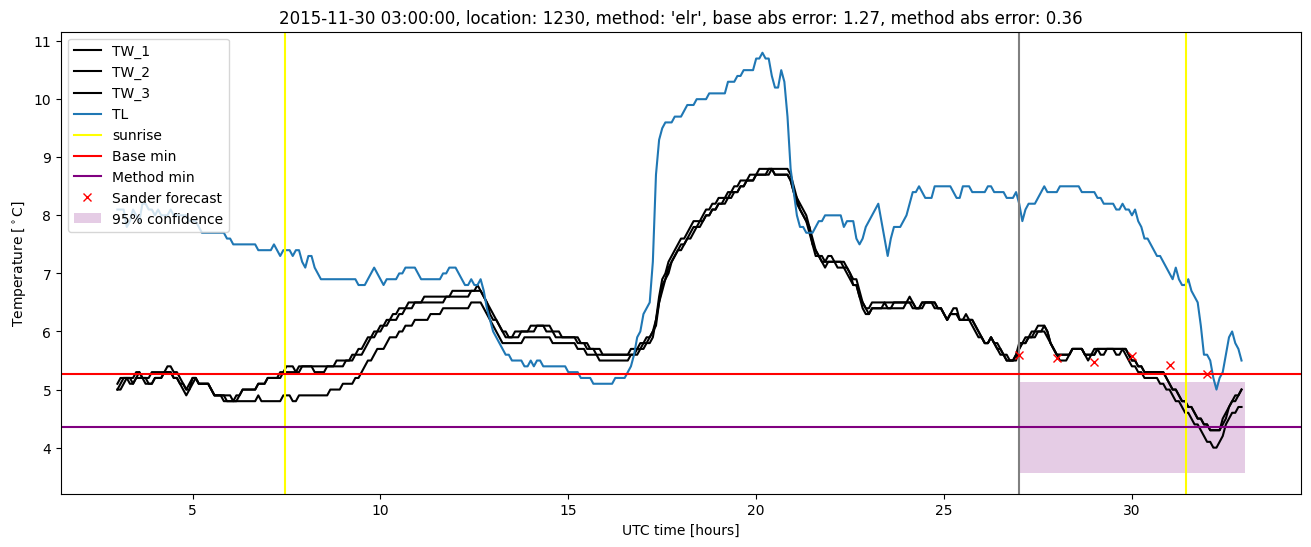
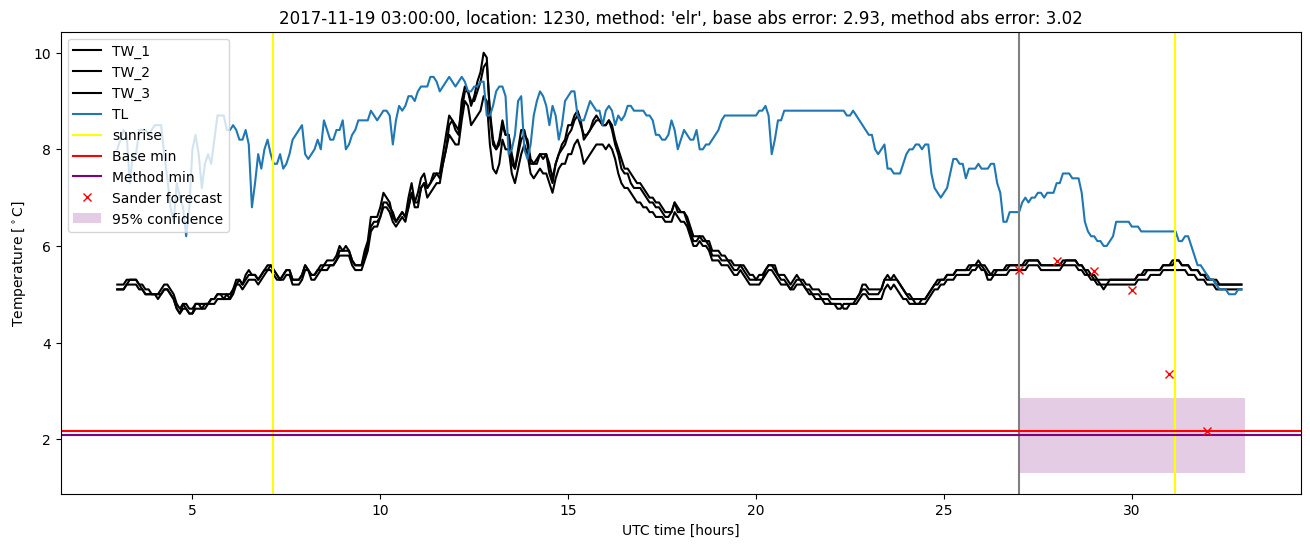
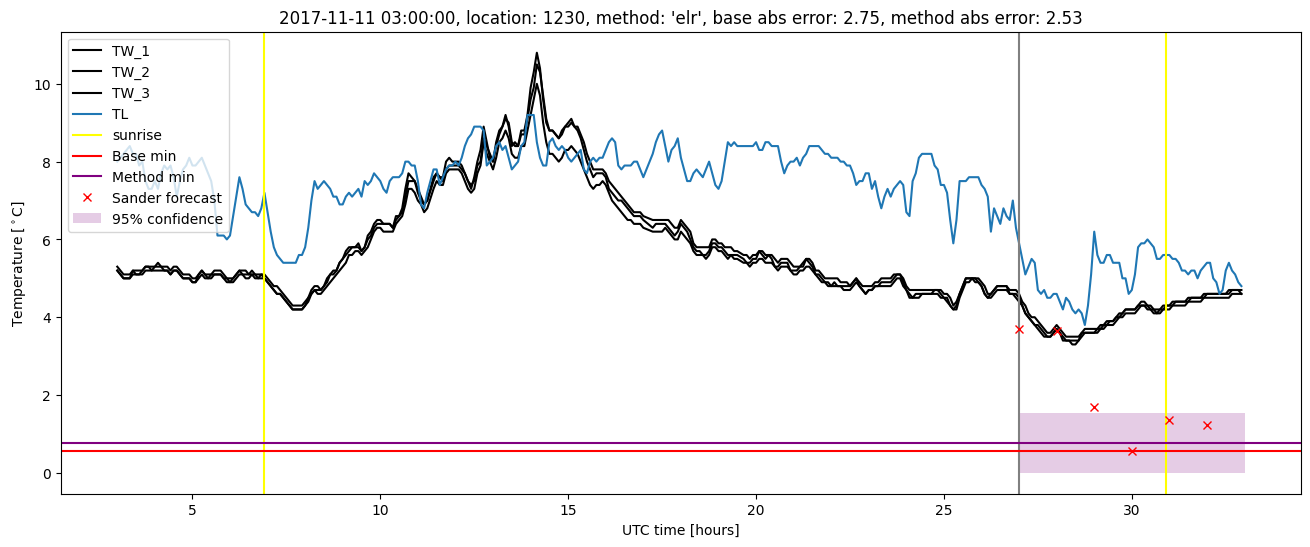
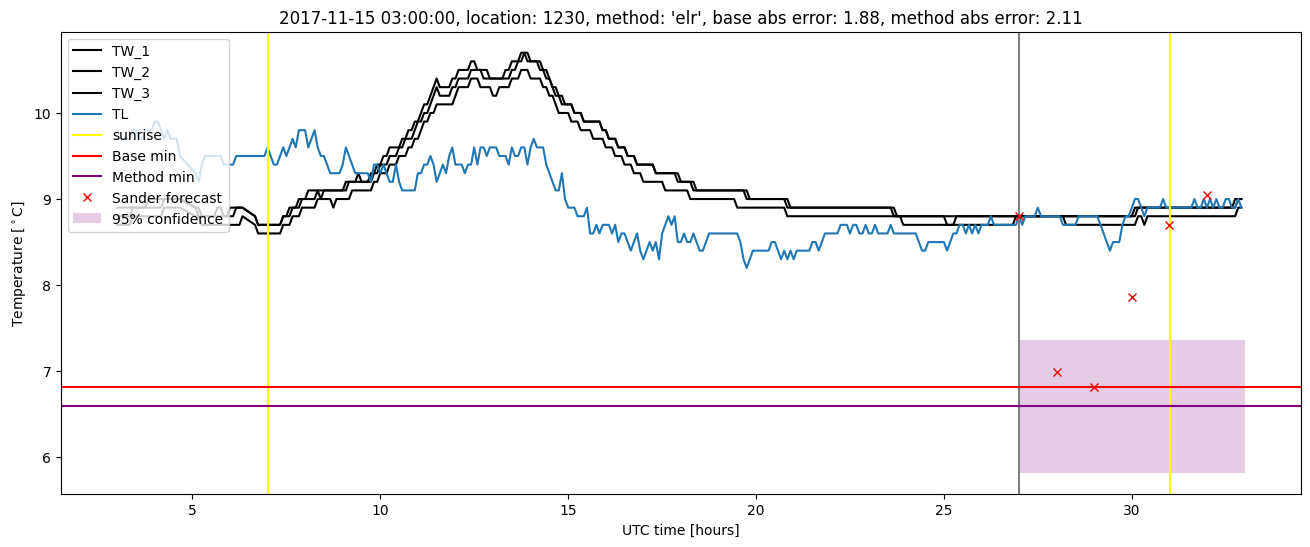
Extended logistic regression plots