GMS location: 1225
Random forest results
| names |
period |
power |
significance |
meanSquareError |
absError |
maxError |
CRPS |
IGN |
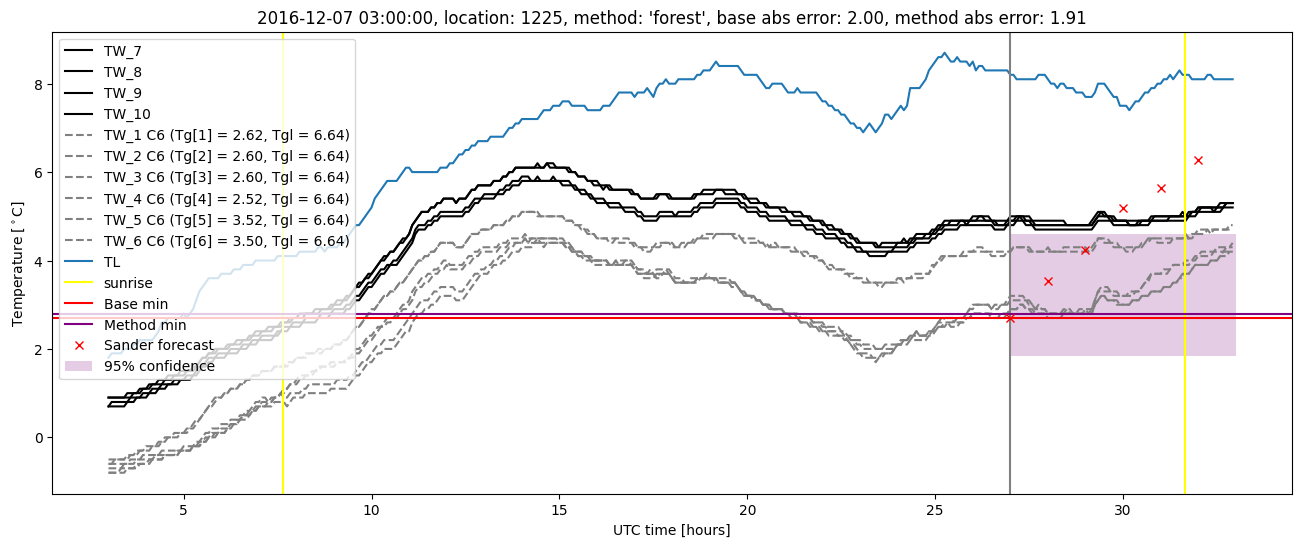
| baseline |
winter 2016 |
0.982 |
0.097 |
0.421 |
0.482 |
2.125 |
NaN |
NaN |
| forest |
winter 2016 |
0.982 |
0.097 |
0.316 |
0.416 |
1.805 |
0.501 |
2.761 |
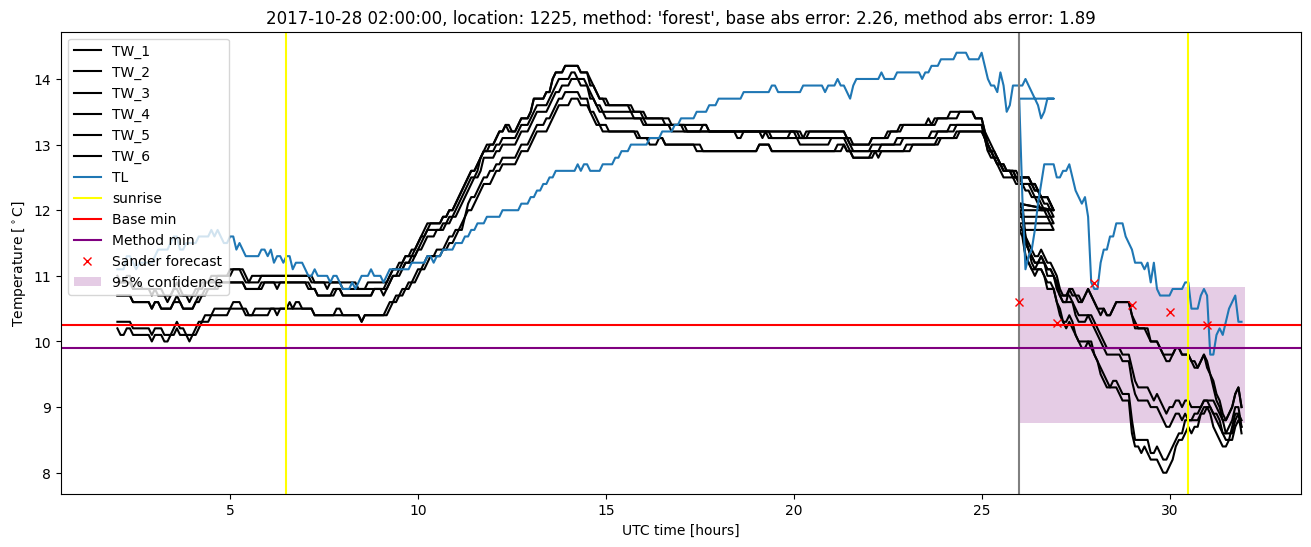
| baseline |
winter 2017 |
0.983 |
0.028 |
0.487 |
0.536 |
2.285 |
NaN |
NaN |
| forest |
winter 2017 |
0.983 |
0.028 |
0.366 |
0.462 |
1.910 |
0.501 |
2.533 |
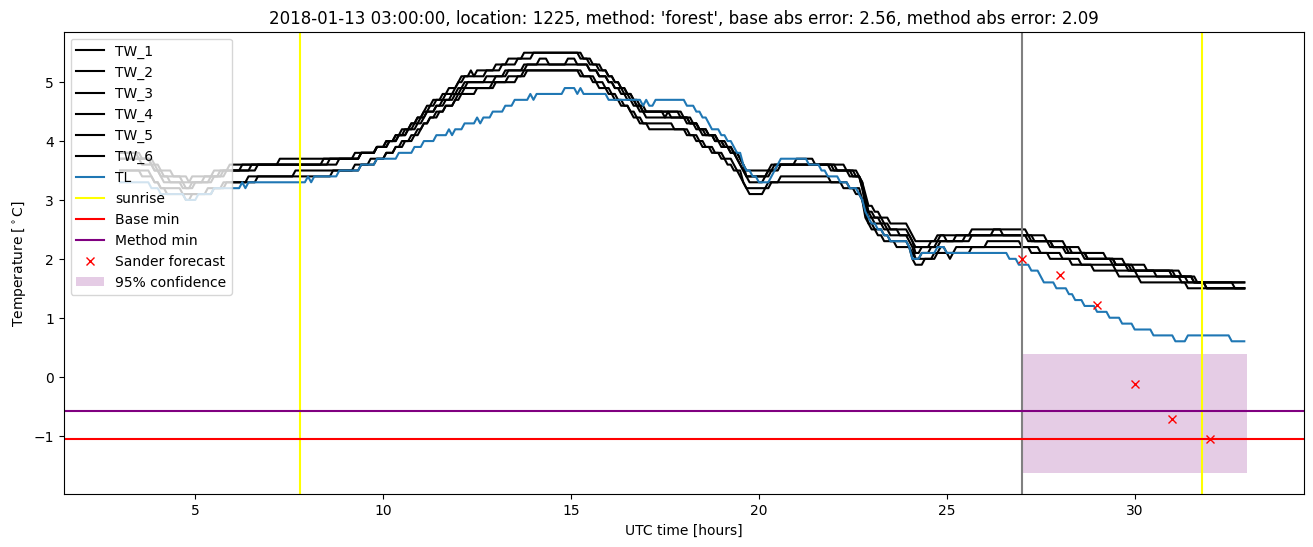
| baseline |
winter 2018 |
0.986 |
0.068 |
0.459 |
0.484 |
2.564 |
NaN |
NaN |
| forest |
winter 2018 |
0.993 |
0.068 |
0.363 |
0.427 |
2.184 |
0.509 |
2.635 |
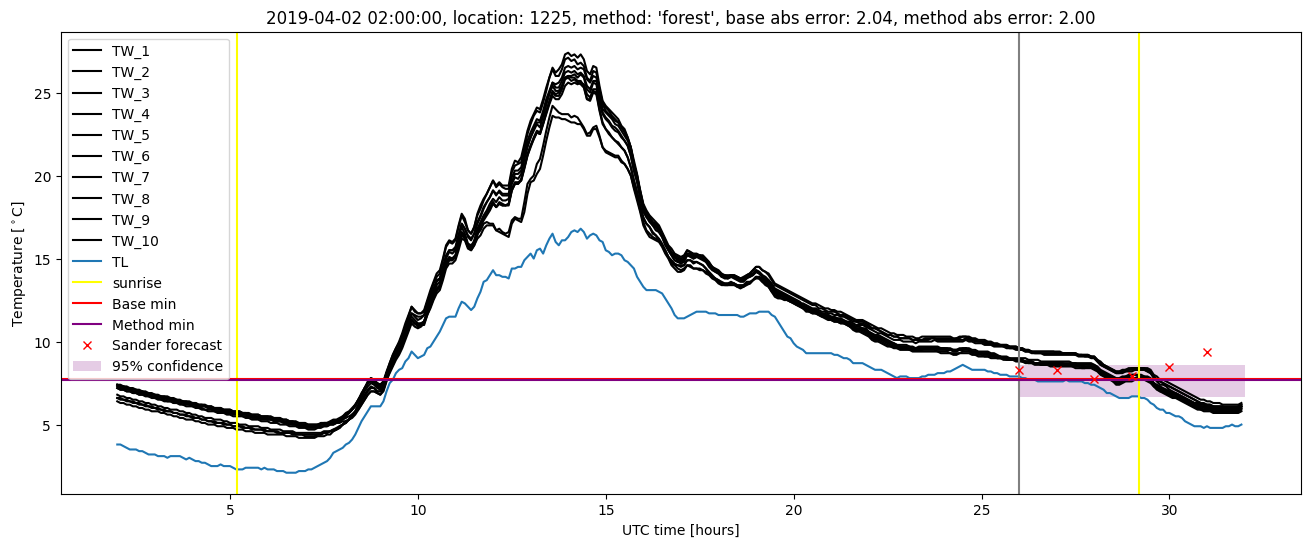
| baseline |
winter 2019 |
0.993 |
0.059 |
0.361 |
0.442 |
2.040 |
NaN |
NaN |
| forest |
winter 2019 |
1.000 |
0.059 |
0.267 |
0.387 |
2.002 |
0.520 |
2.682 |
| baseline |
all |
0.986 |
0.062 |
0.431 |
0.485 |
2.564 |
NaN |
NaN |
| forest |
all |
0.990 |
0.062 |
0.328 |
0.422 |
2.184 |
0.508 |
2.659 |
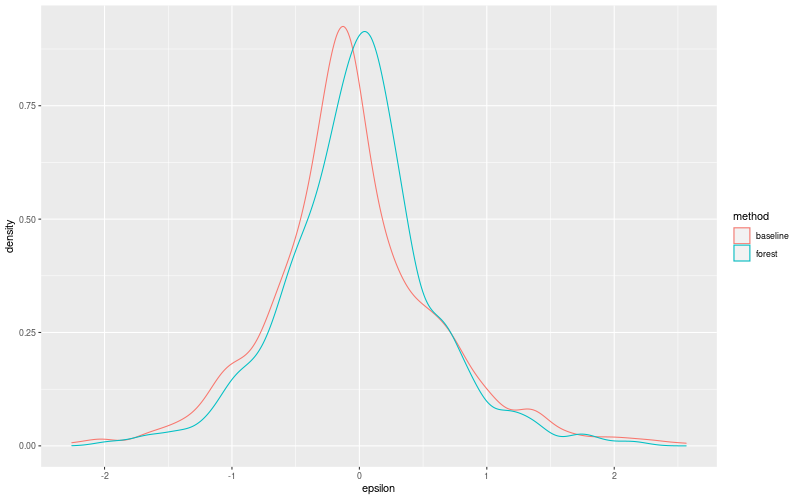
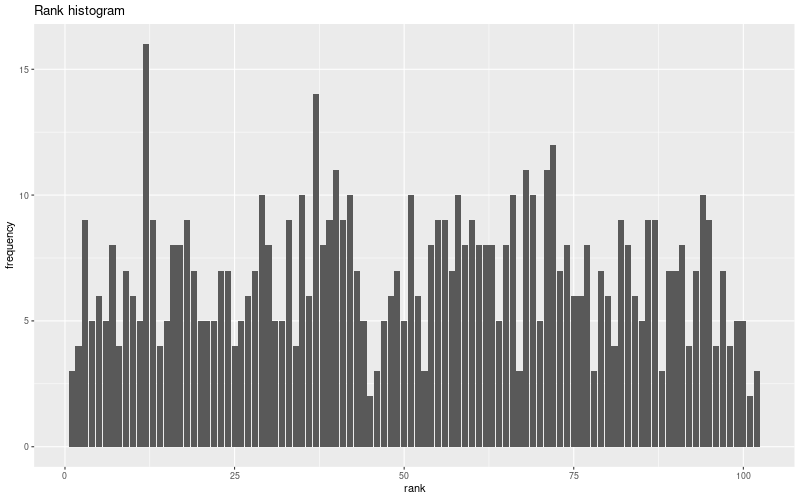
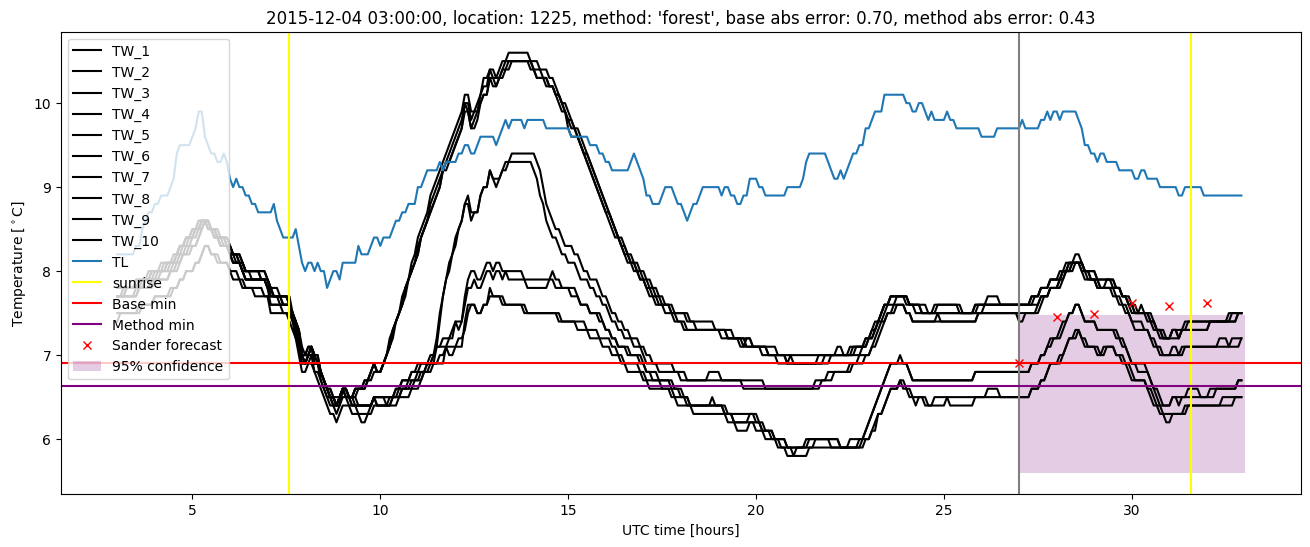
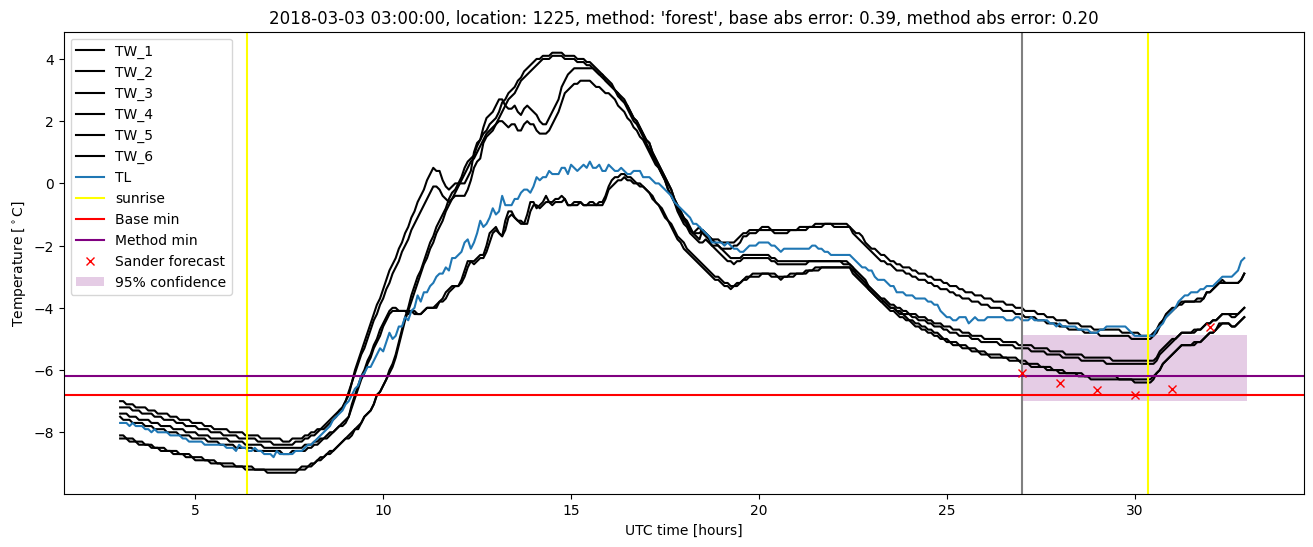
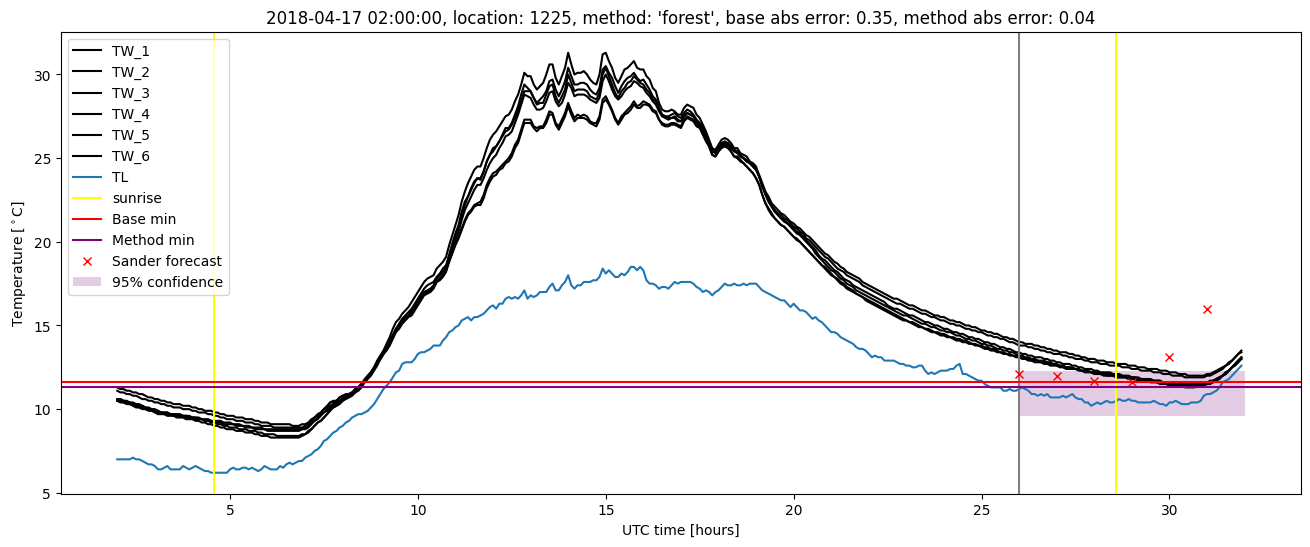
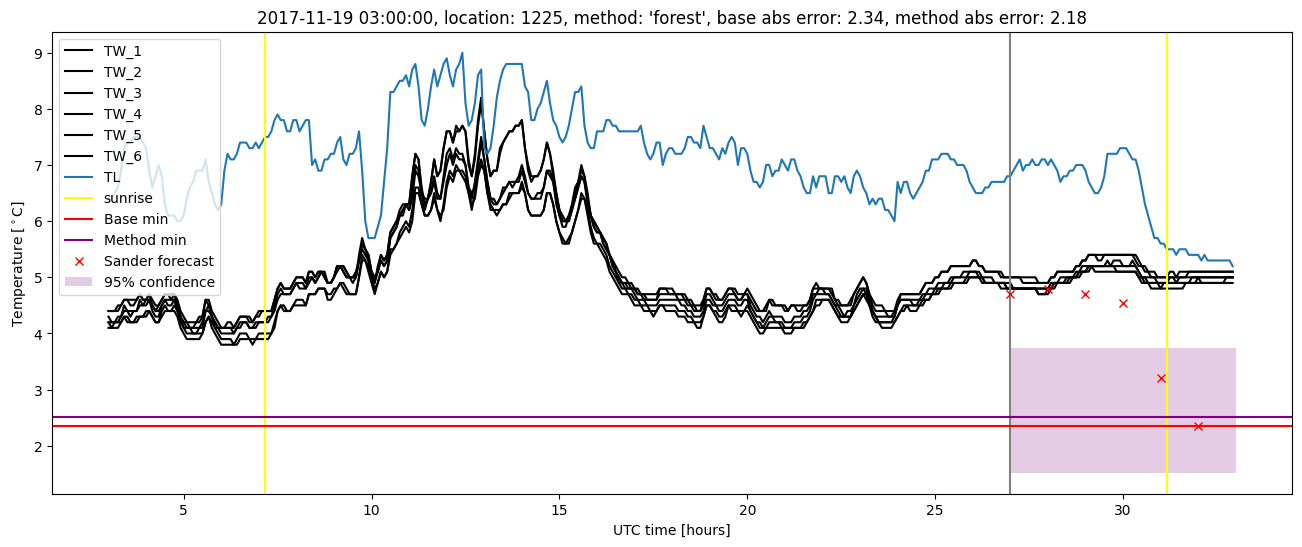
Random forest plots
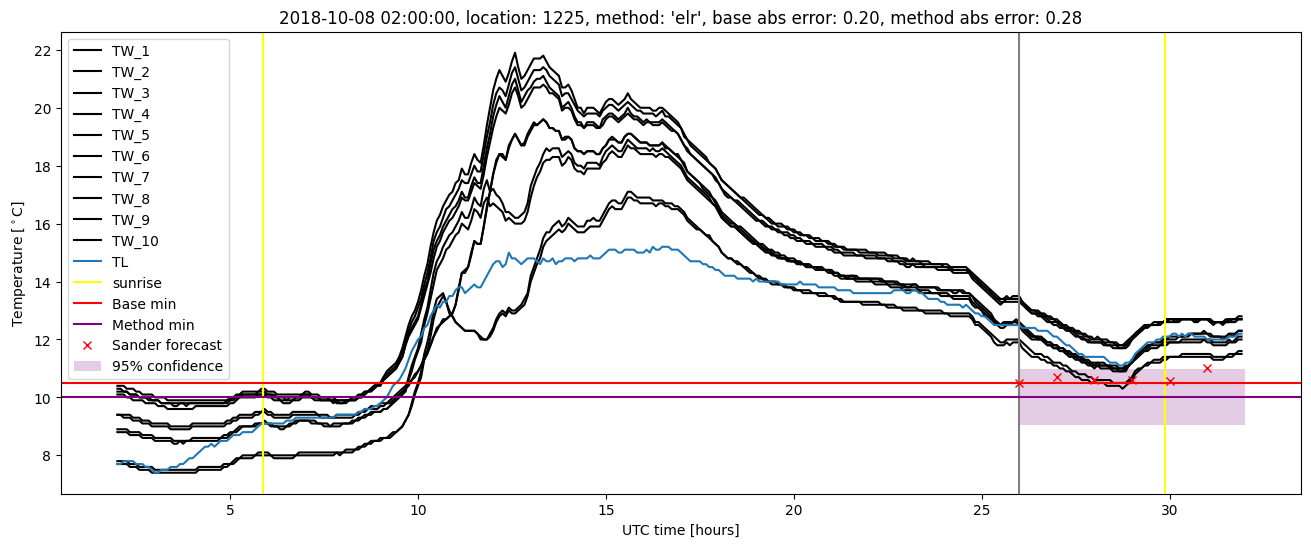
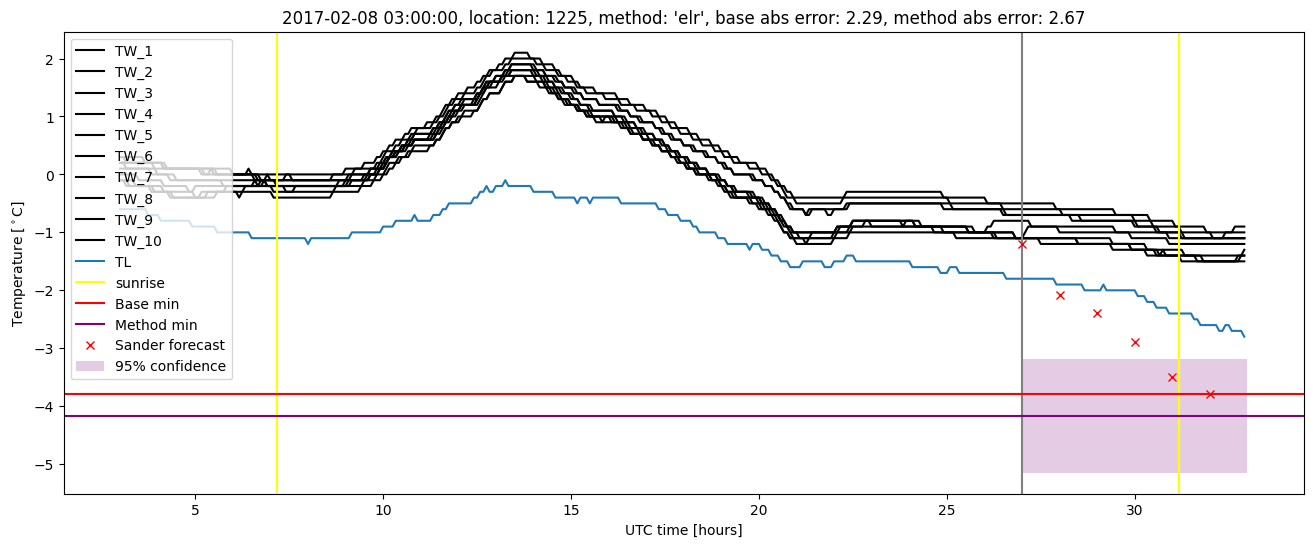
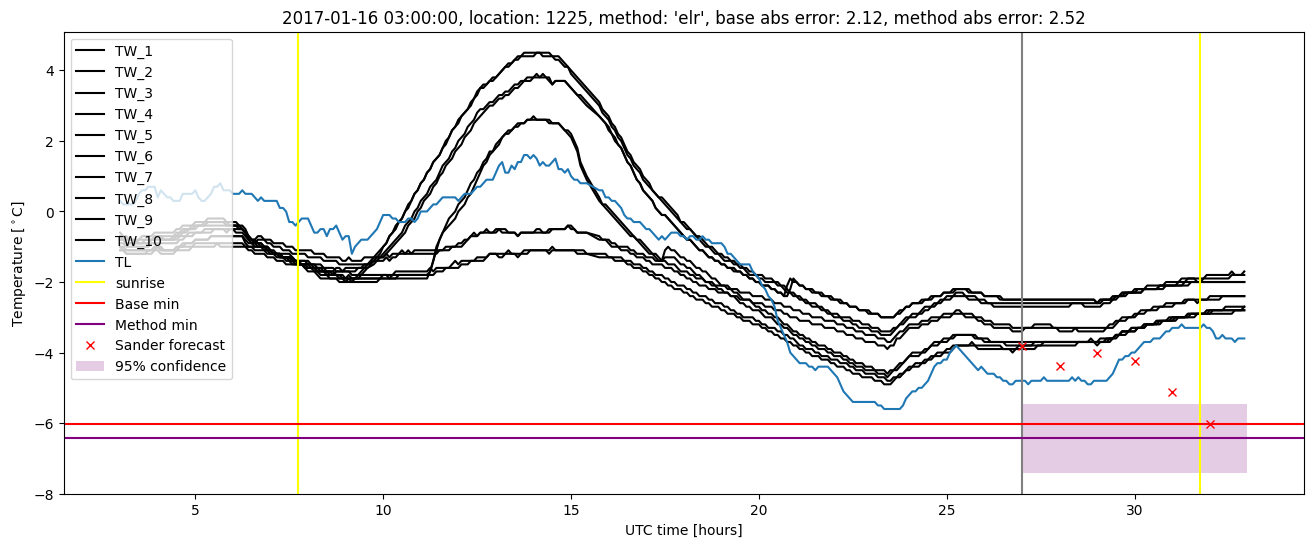
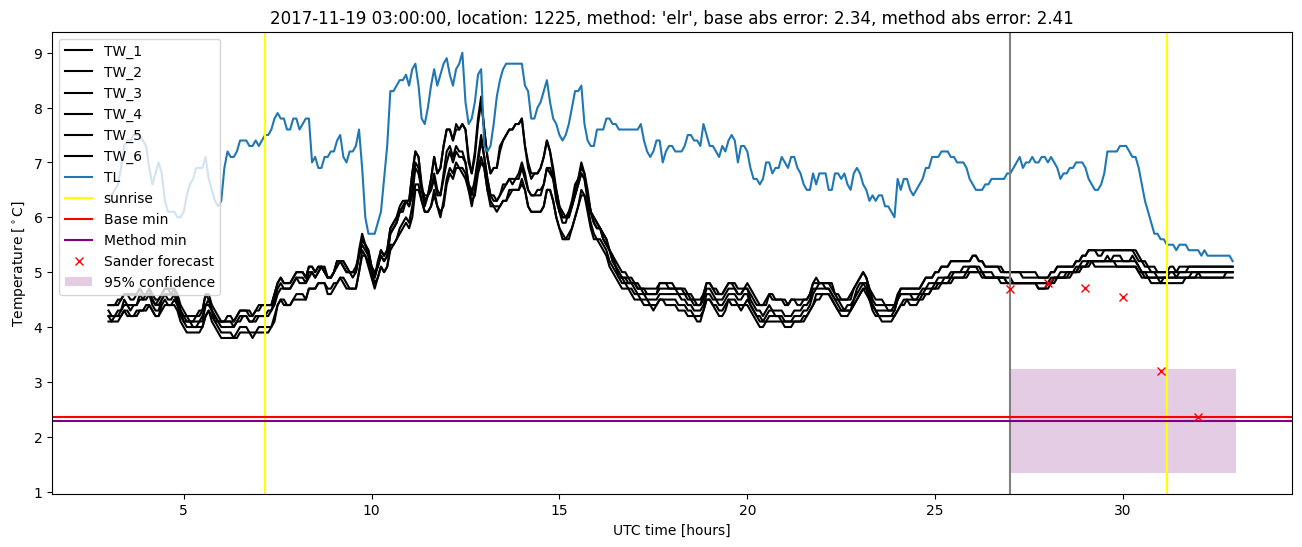
Extended logistic regression results
| names |
period |
power |
significance |
meanSquareError |
absError |
maxError |
CRPS |
IGN |
| baseline |
winter 2016 |
0.982 |
0.097 |
0.421 |
0.482 |
2.125 |
NaN |
NaN |
| elr |
winter 2016 |
0.976 |
0.065 |
0.390 |
0.501 |
1.762 |
0.591 |
3.338 |
| baseline |
winter 2017 |
0.983 |
0.028 |
0.487 |
0.536 |
2.285 |
NaN |
NaN |
| elr |
winter 2017 |
0.974 |
0.028 |
0.517 |
0.529 |
2.666 |
0.581 |
3.431 |
| baseline |
winter 2018 |
0.986 |
0.068 |
0.459 |
0.484 |
2.564 |
NaN |
NaN |
| elr |
winter 2018 |
0.993 |
0.068 |
0.442 |
0.491 |
2.411 |
0.601 |
4.038 |
| baseline |
winter 2019 |
0.993 |
0.059 |
0.361 |
0.442 |
2.040 |
NaN |
NaN |
| elr |
winter 2019 |
1.000 |
0.059 |
0.400 |
0.476 |
2.075 |
0.573 |
3.537 |
| baseline |
all |
0.986 |
0.062 |
0.431 |
0.485 |
2.564 |
NaN |
NaN |
| elr |
all |
0.986 |
0.055 |
0.434 |
0.499 |
2.666 |
0.587 |
3.591 |
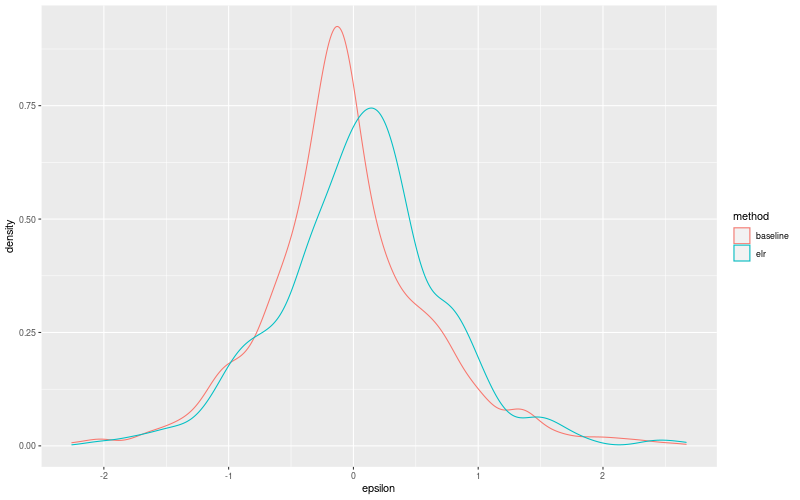
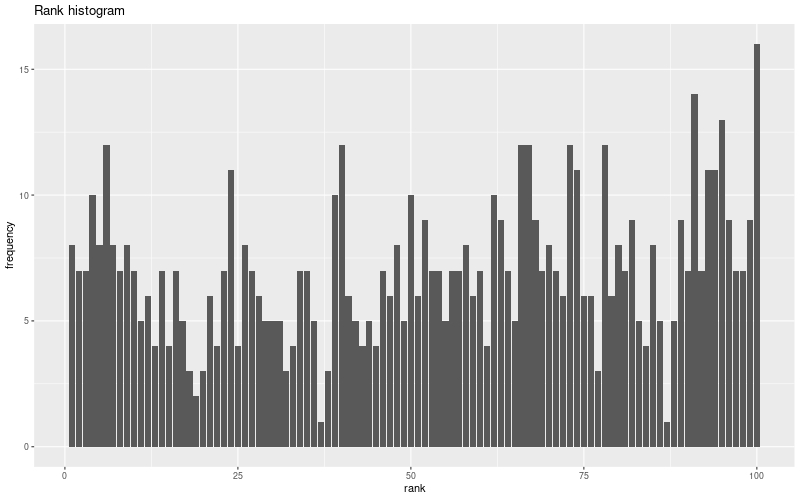
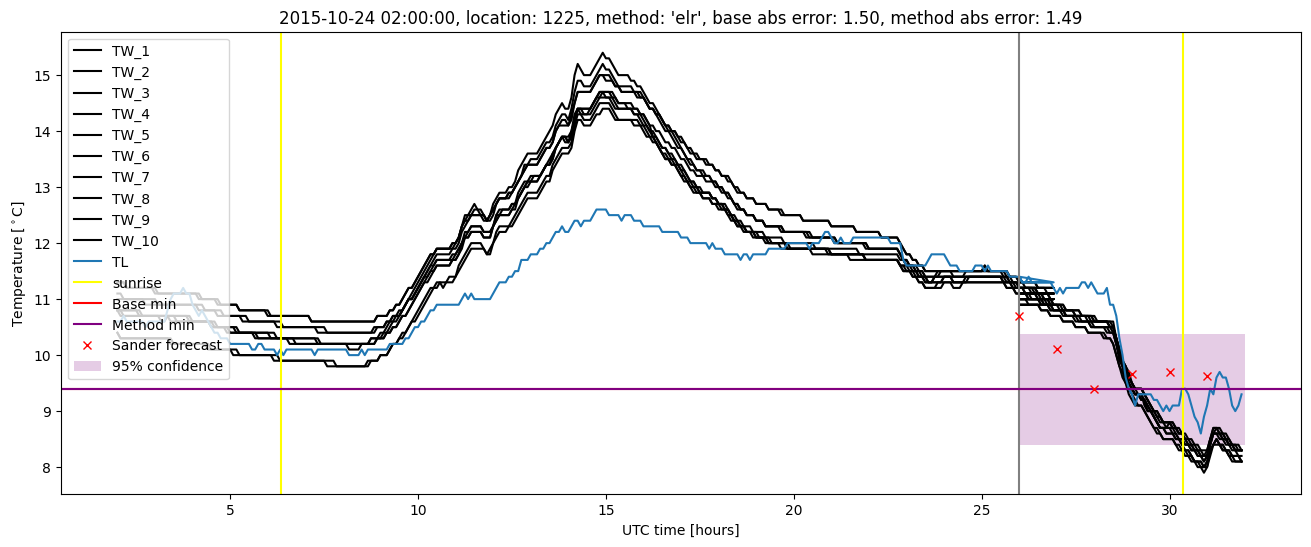
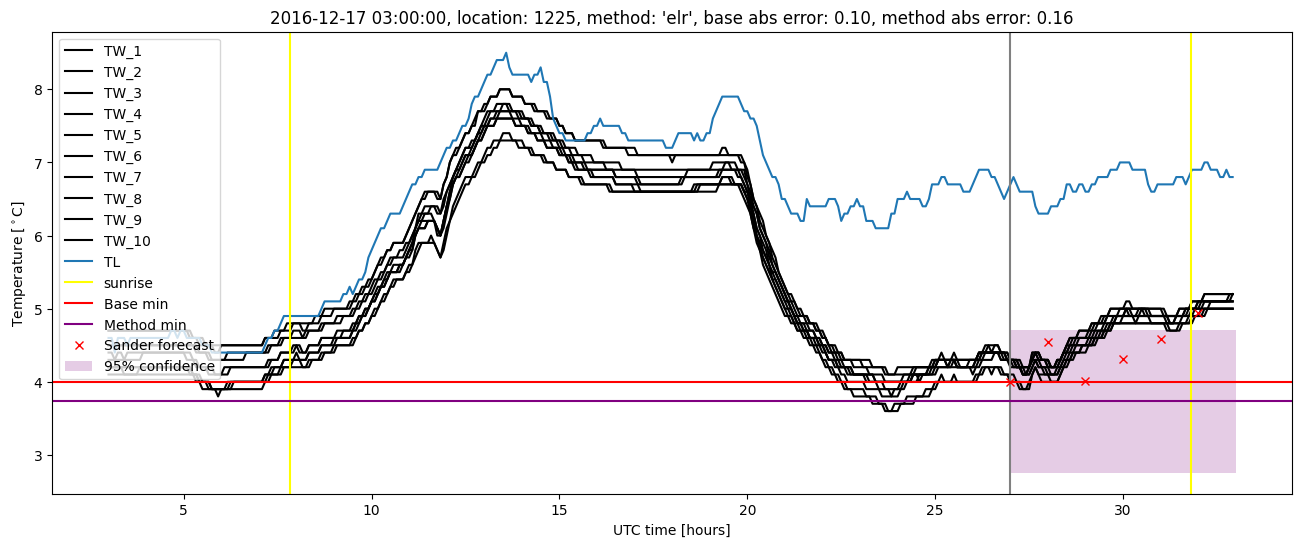
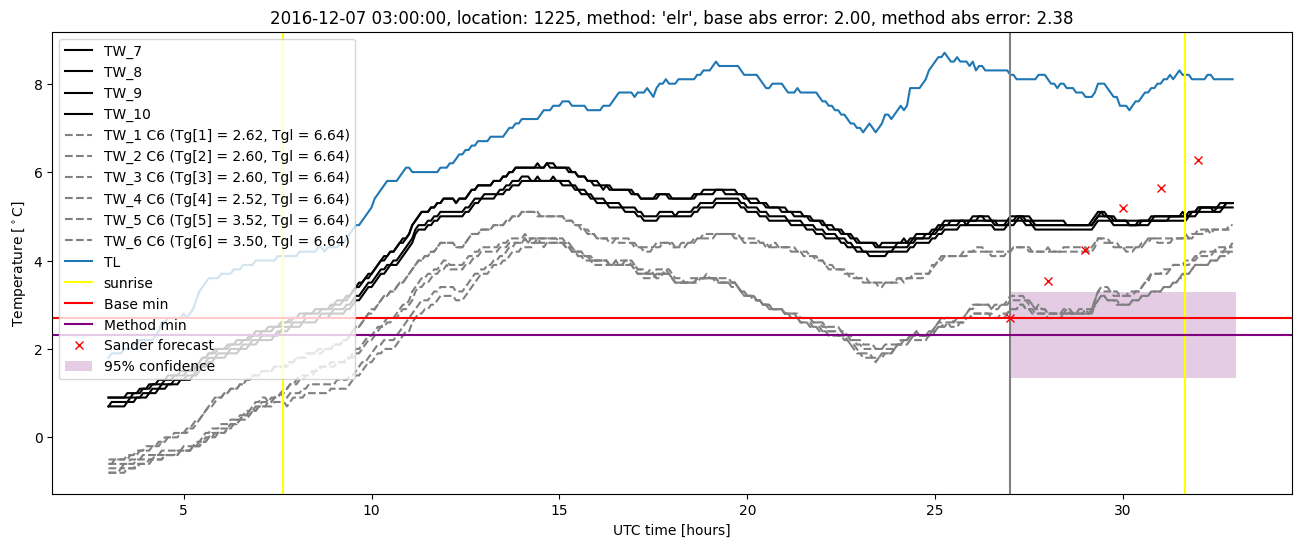
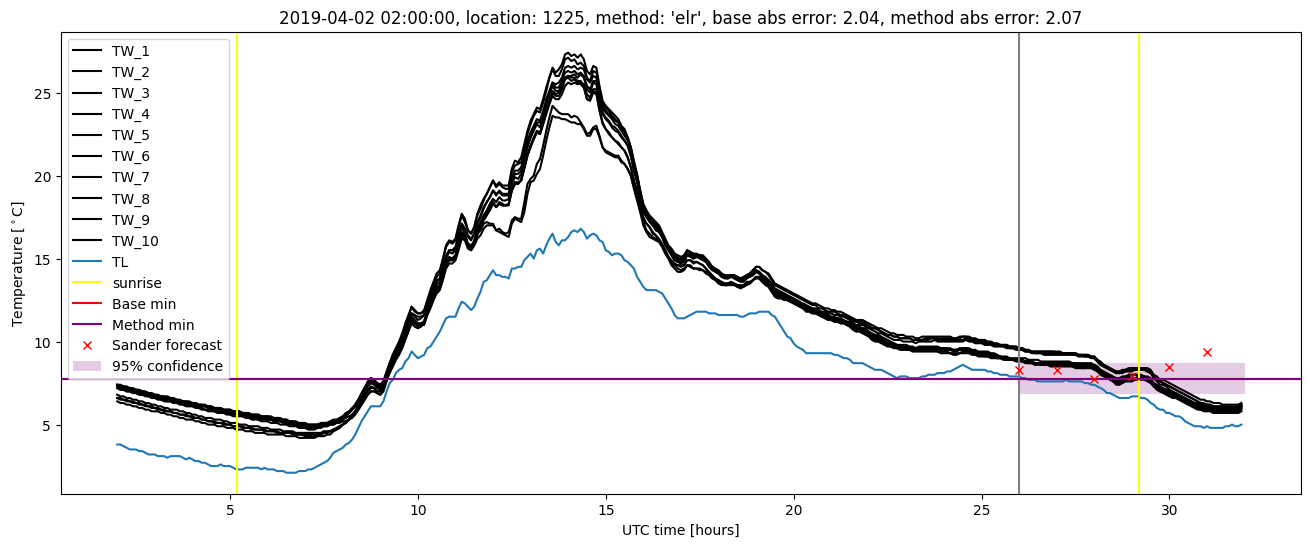
Extended logistic regression plots