GMS location: 1224
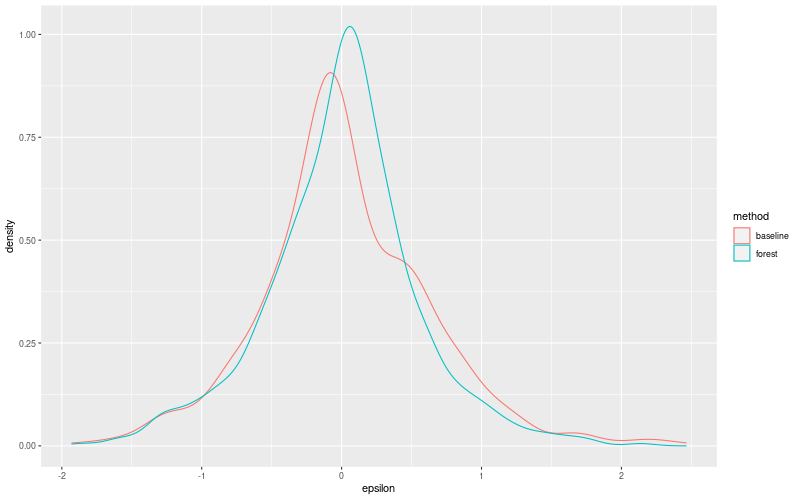
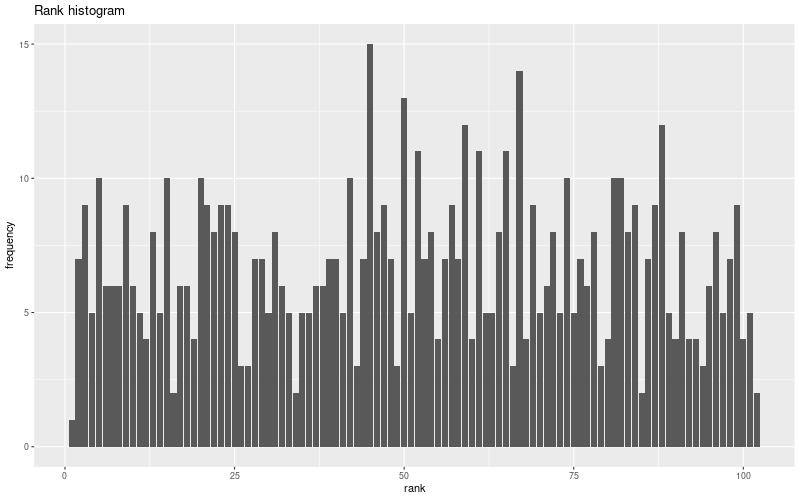
Random forest results
| names |
period |
power |
significance |
meanSquareError |
absError |
maxError |
CRPS |
IGN |
| baseline |
winter 2016 |
0.988 |
0.057 |
0.355 |
0.445 |
1.928 |
NaN |
NaN |
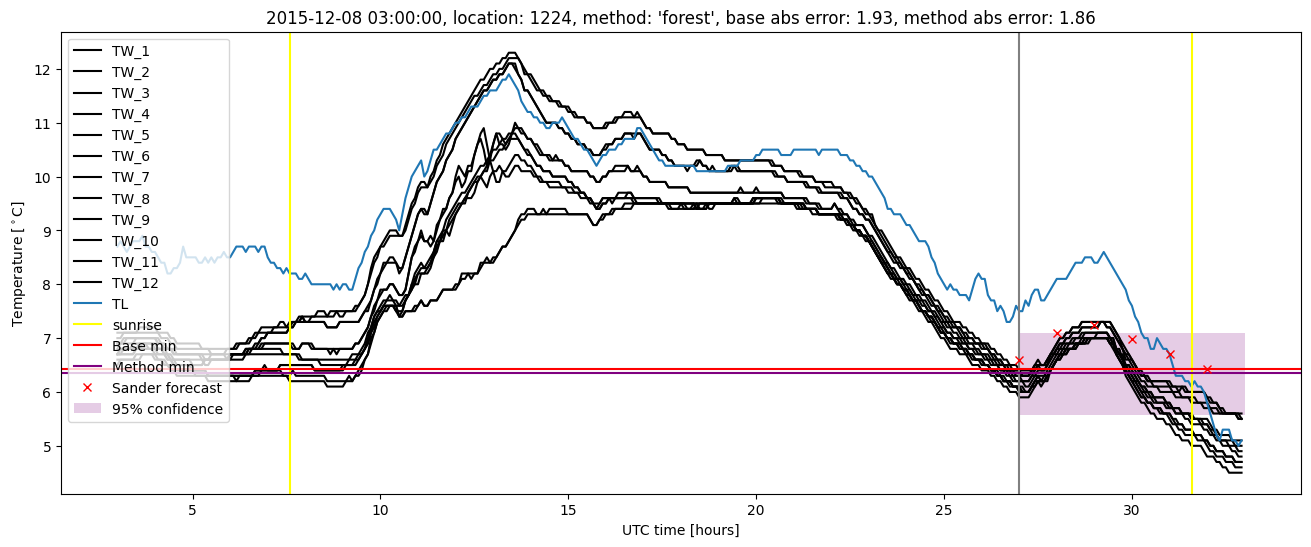
| forest |
winter 2016 |
0.988 |
0.057 |
0.274 |
0.378 |
1.859 |
0.468 |
3.244 |
| baseline |
winter 2017 |
0.982 |
0.071 |
0.469 |
0.498 |
2.259 |
NaN |
NaN |
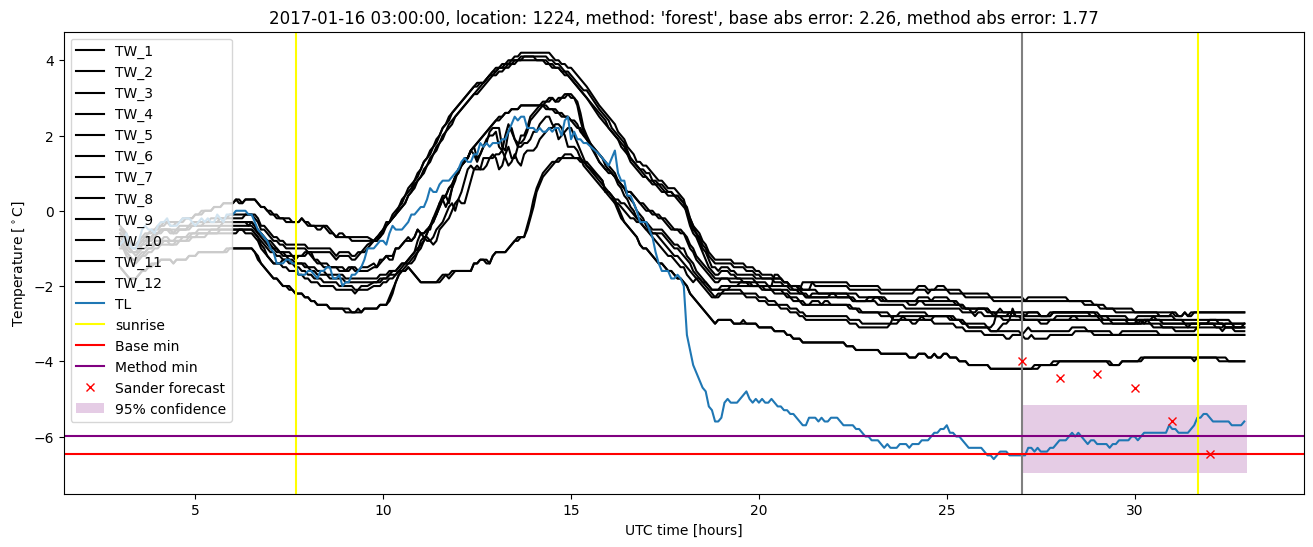
| forest |
winter 2017 |
0.982 |
0.071 |
0.352 |
0.441 |
1.775 |
0.482 |
4.679 |
| baseline |
winter 2018 |
0.986 |
0.079 |
0.391 |
0.465 |
2.463 |
NaN |
NaN |
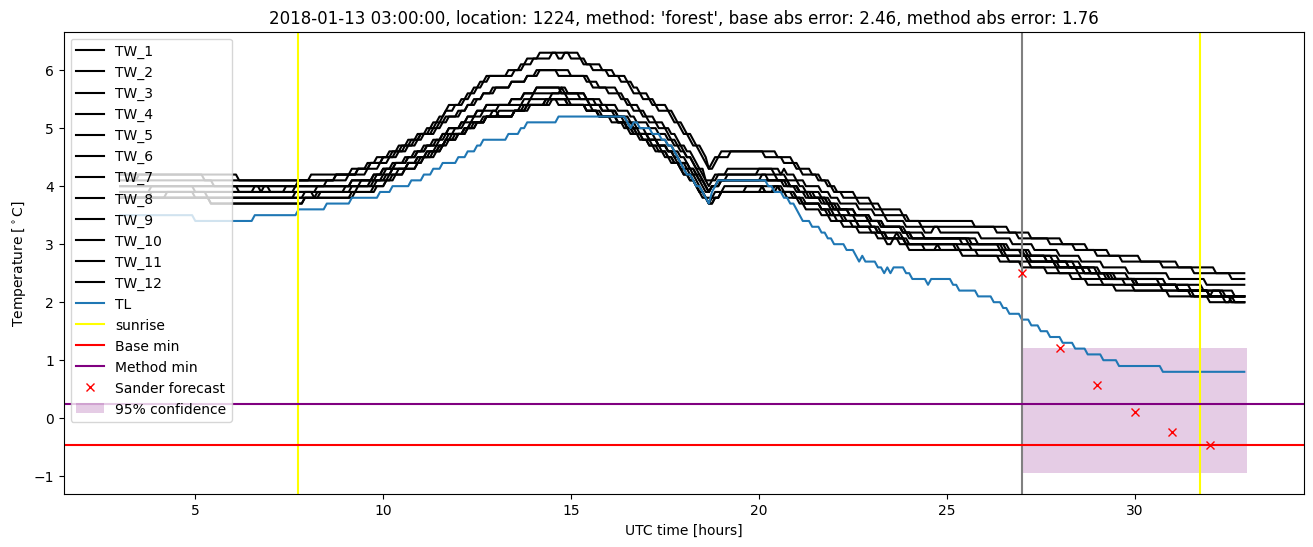
| forest |
winter 2018 |
0.993 |
0.105 |
0.327 |
0.429 |
2.136 |
0.477 |
3.293 |
| baseline |
winter 2019 |
1.000 |
0.000e+00 |
0.274 |
0.396 |
1.404 |
NaN |
NaN |
| forest |
winter 2019 |
1.000 |
0.000e+00 |
0.201 |
0.334 |
1.333 |
0.466 |
3.159 |
| baseline |
all |
0.989 |
0.064 |
0.371 |
0.451 |
2.463 |
NaN |
NaN |
| forest |
all |
0.991 |
0.072 |
0.289 |
0.396 |
2.136 |
0.473 |
3.559 |
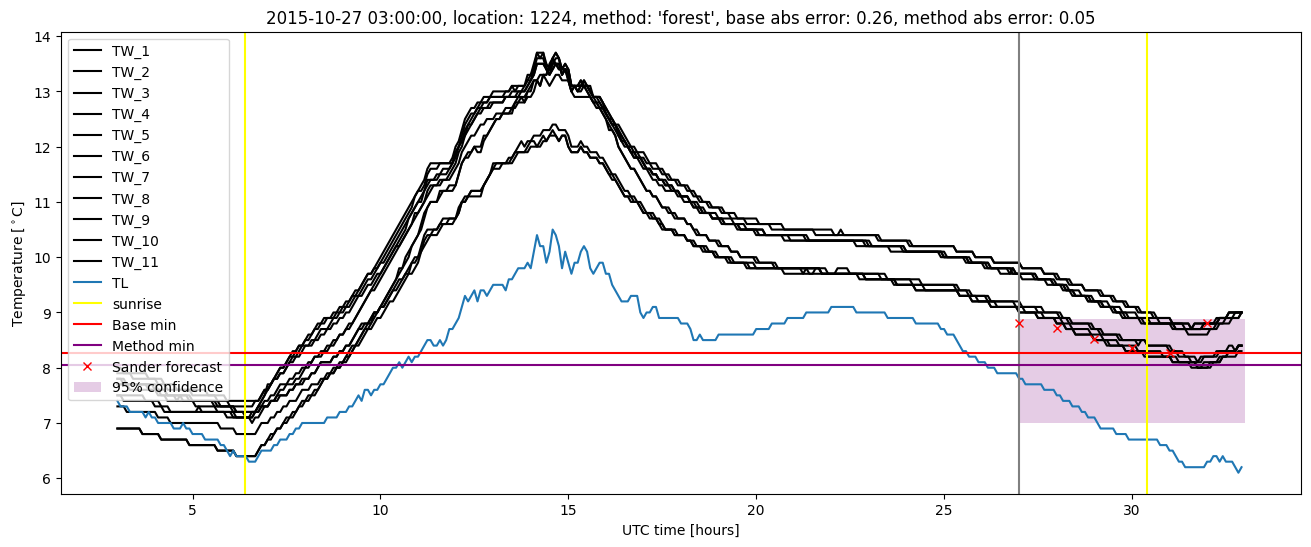
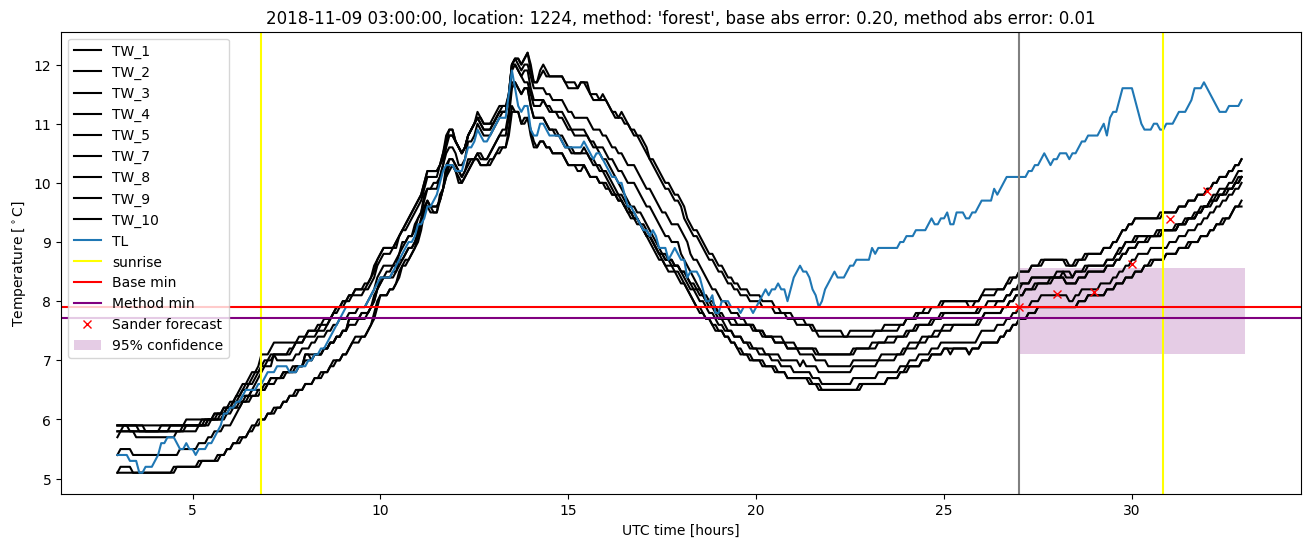
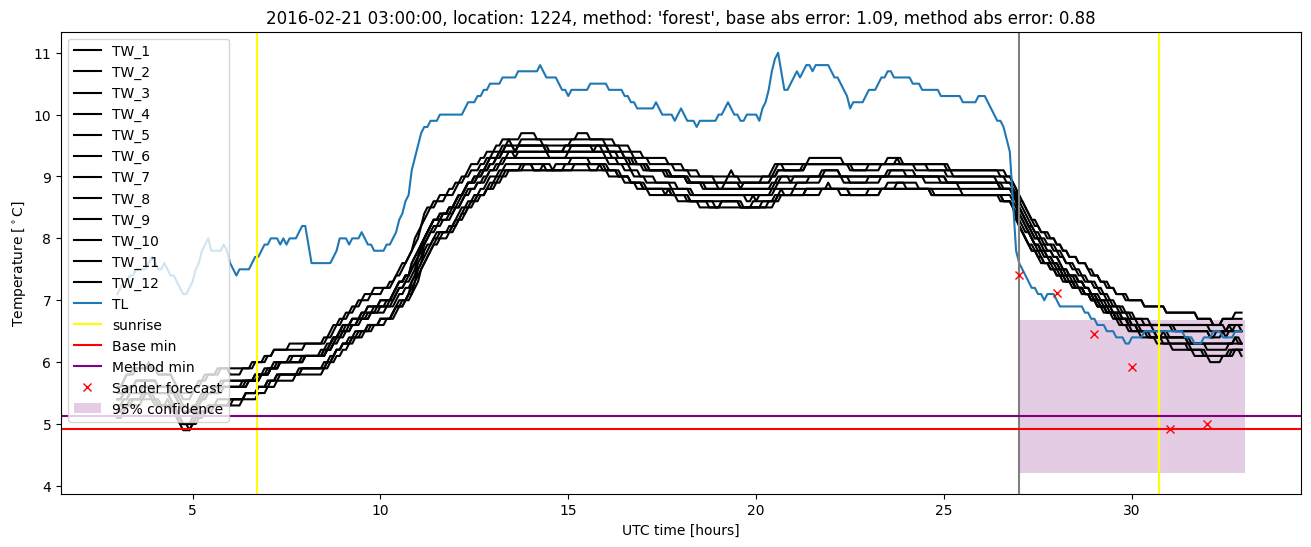
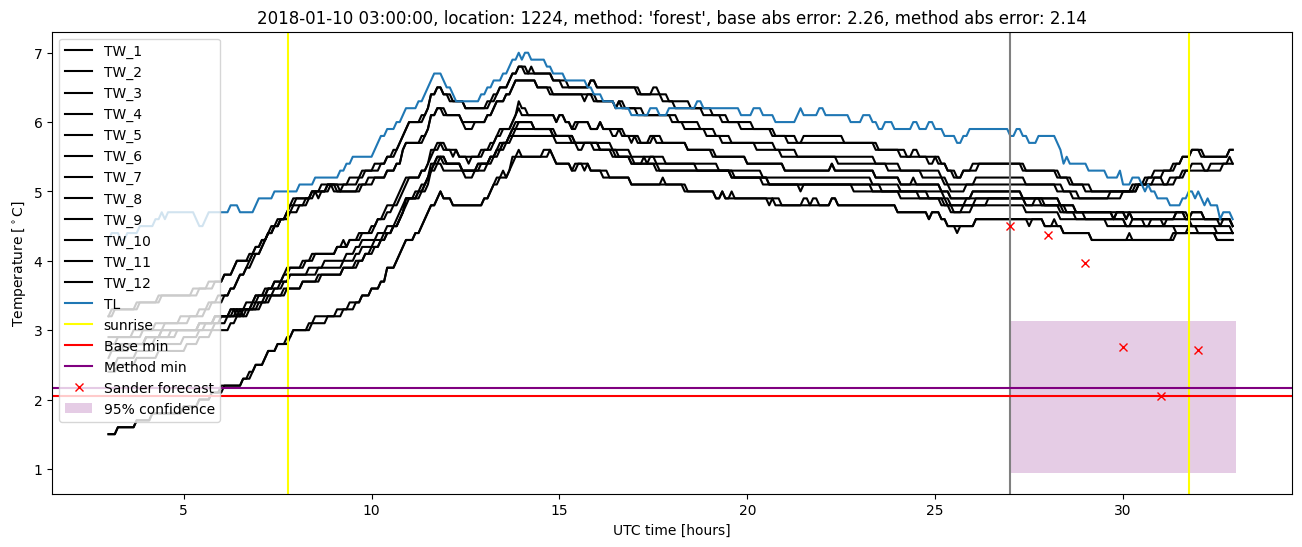
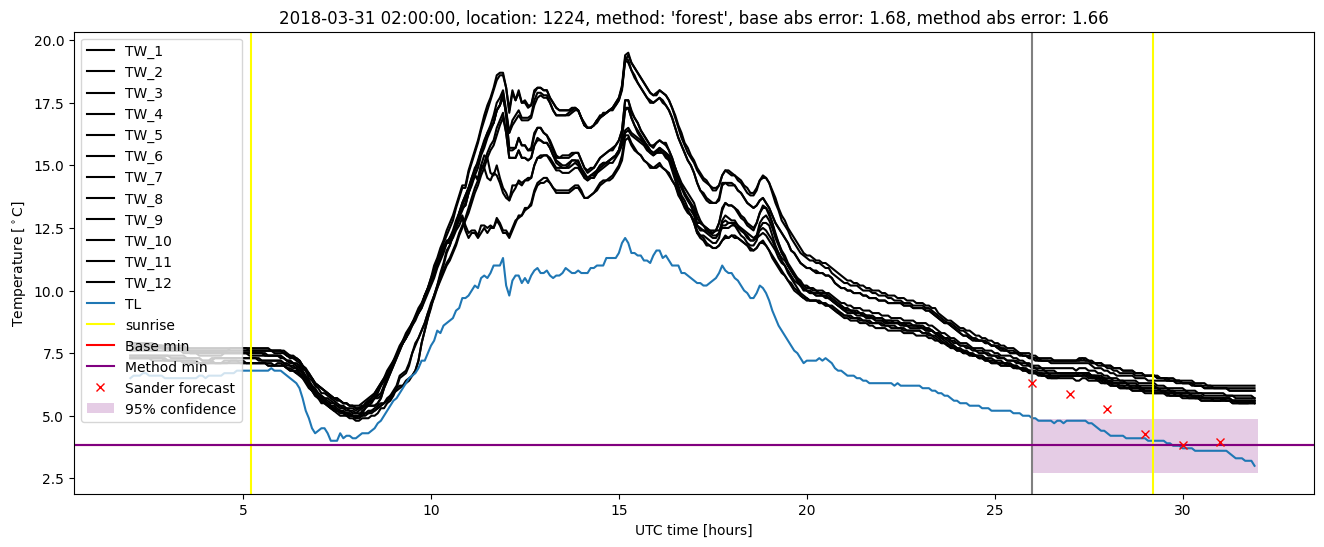
Random forest plots
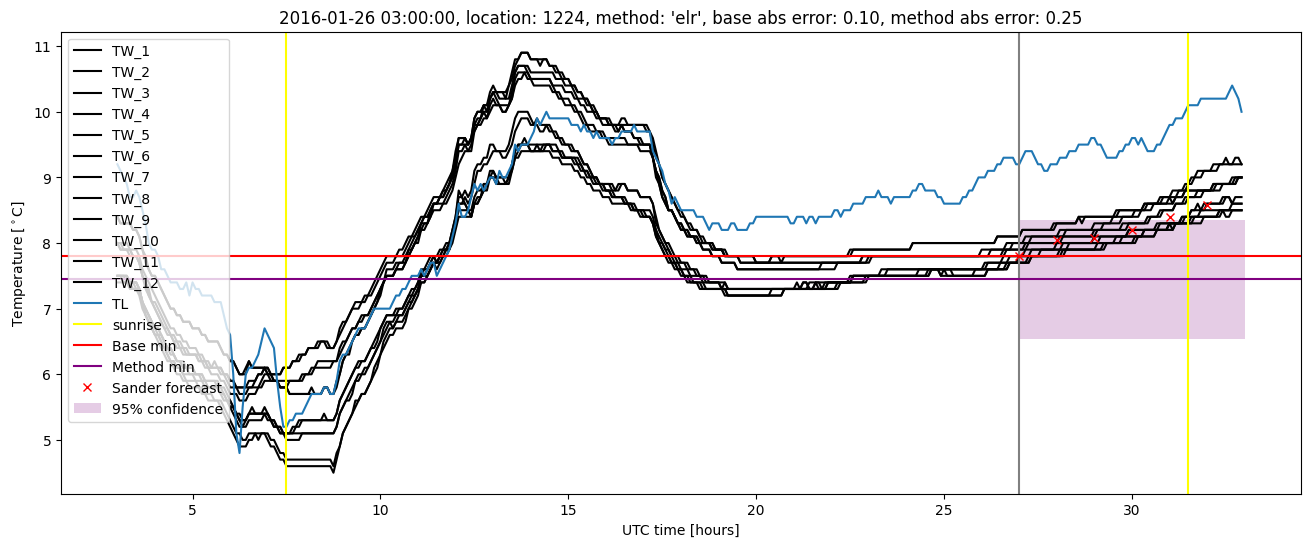
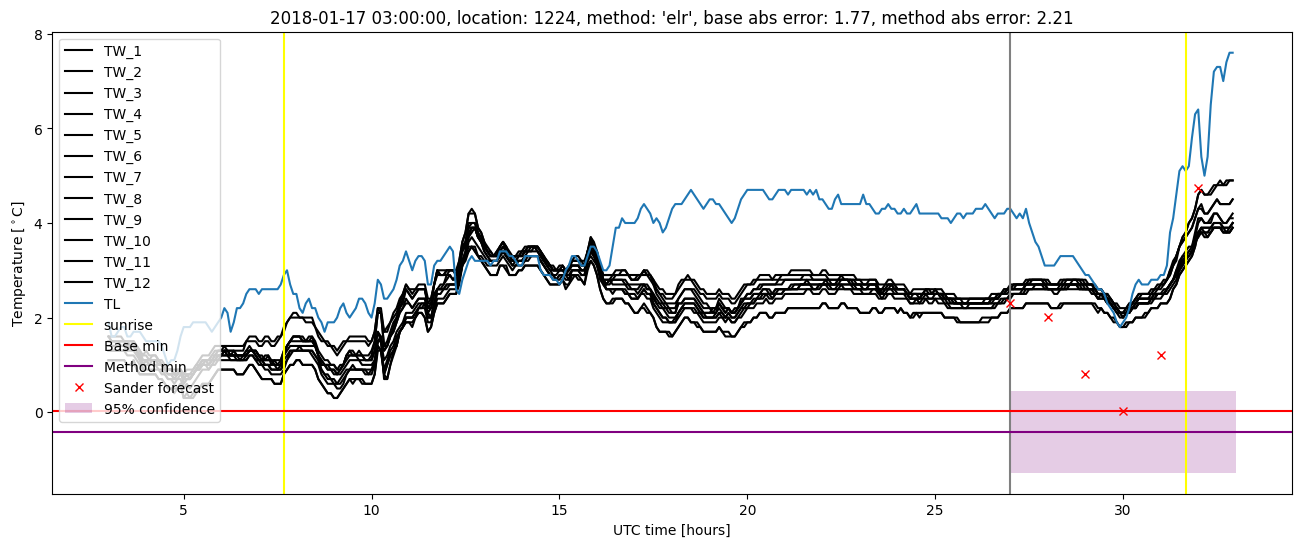
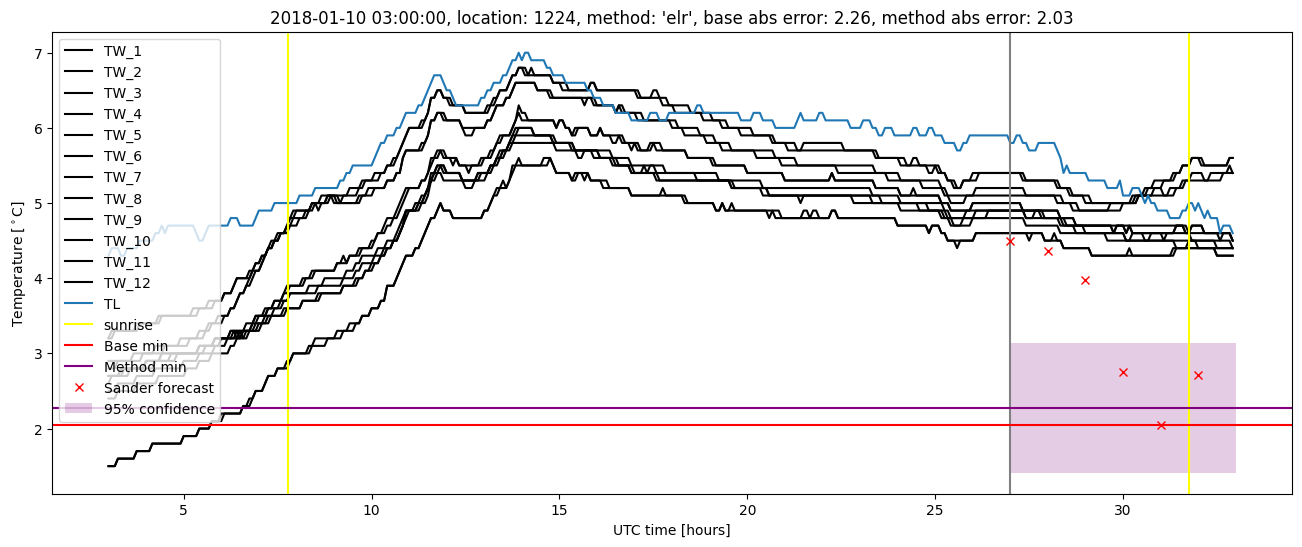
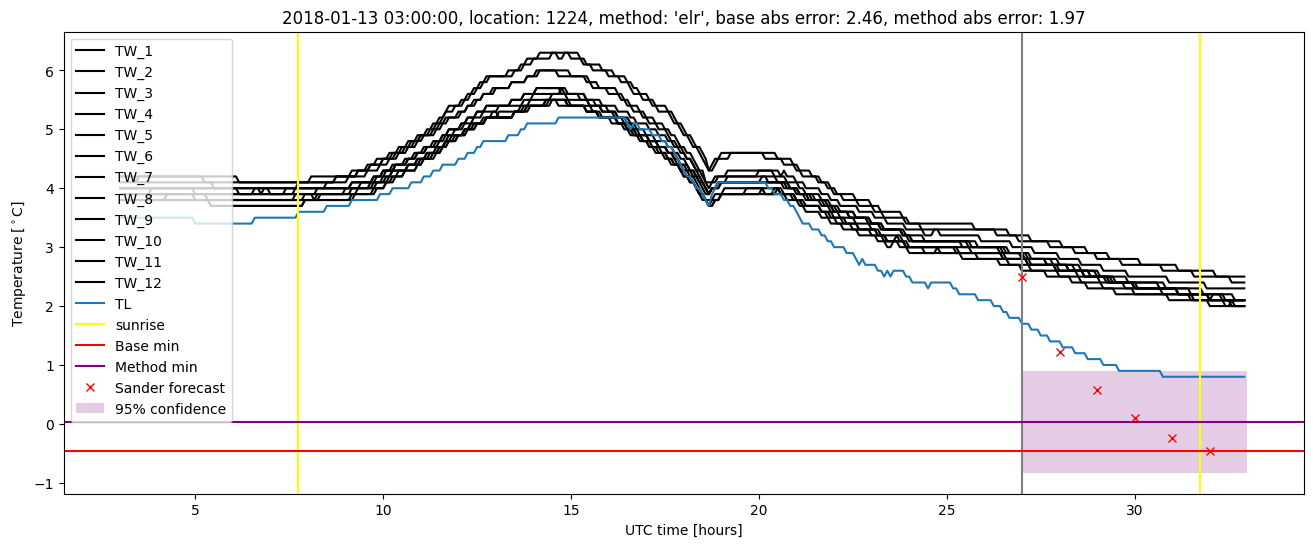
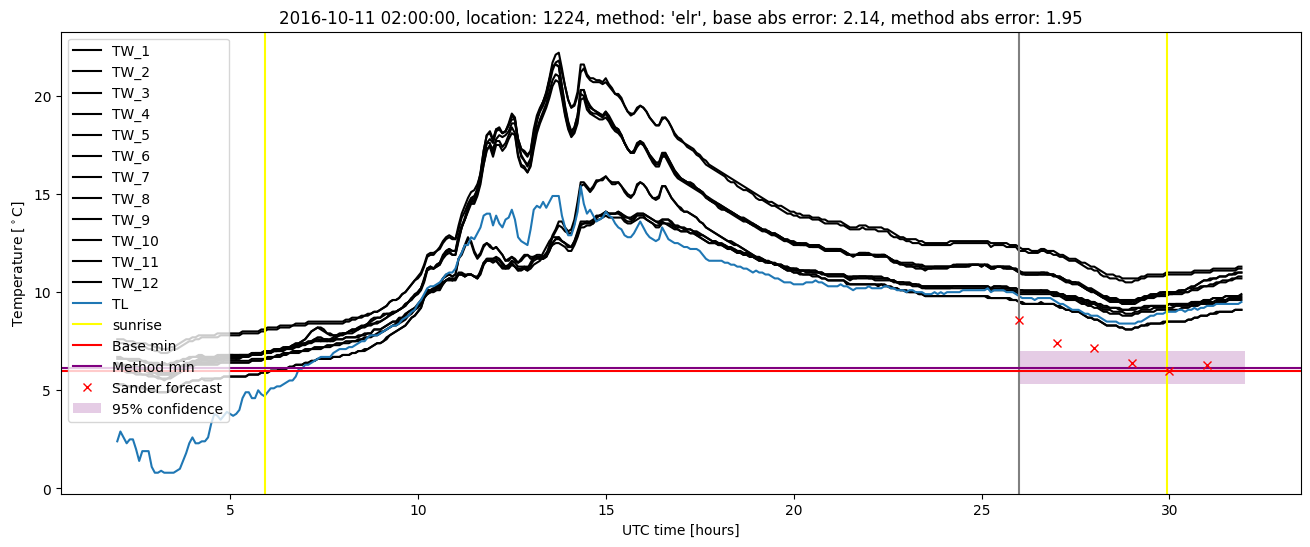
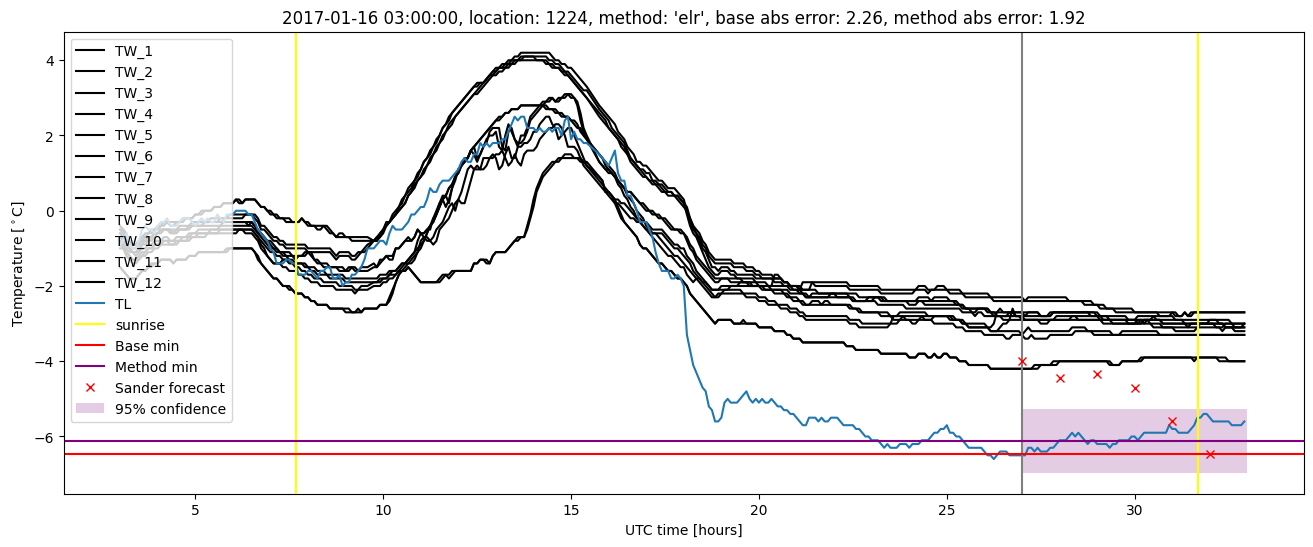
Extended logistic regression results
| names |
period |
power |
significance |
meanSquareError |
absError |
maxError |
CRPS |
IGN |
| baseline |
winter 2016 |
0.988 |
0.057 |
0.355 |
0.445 |
1.928 |
NaN |
NaN |
| elr |
winter 2016 |
0.994 |
0.057 |
0.287 |
0.405 |
1.662 |
0.526 |
3.704 |
| baseline |
winter 2017 |
0.982 |
0.071 |
0.469 |
0.498 |
2.259 |
NaN |
NaN |
| elr |
winter 2017 |
0.964 |
0.167 |
0.435 |
0.495 |
1.946 |
0.524 |
4.615 |
| baseline |
winter 2018 |
0.986 |
0.079 |
0.391 |
0.465 |
2.463 |
NaN |
NaN |
| elr |
winter 2018 |
0.979 |
0.105 |
0.367 |
0.462 |
2.214 |
0.557 |
4.839 |
| baseline |
winter 2019 |
1.000 |
0.000e+00 |
0.274 |
0.396 |
1.404 |
NaN |
NaN |
| elr |
winter 2019 |
1.000 |
0.100 |
0.264 |
0.390 |
1.407 |
0.532 |
3.641 |
| baseline |
all |
0.989 |
0.064 |
0.371 |
0.451 |
2.463 |
NaN |
NaN |
| elr |
all |
0.986 |
0.112 |
0.336 |
0.437 |
2.214 |
0.535 |
4.192 |
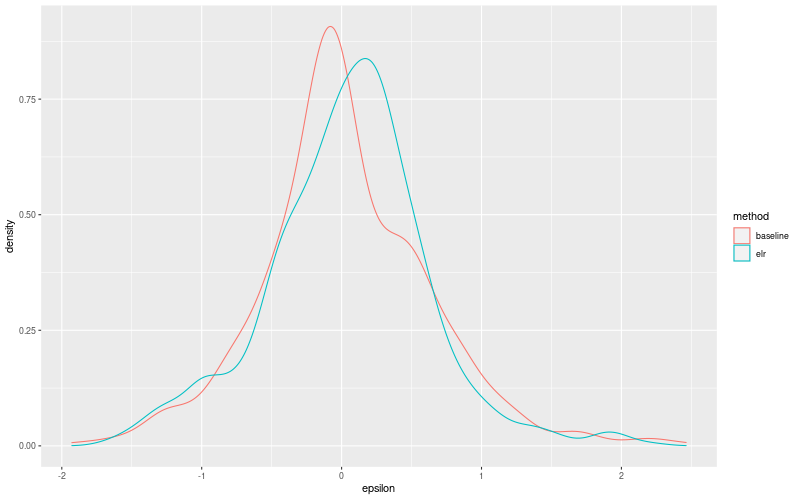
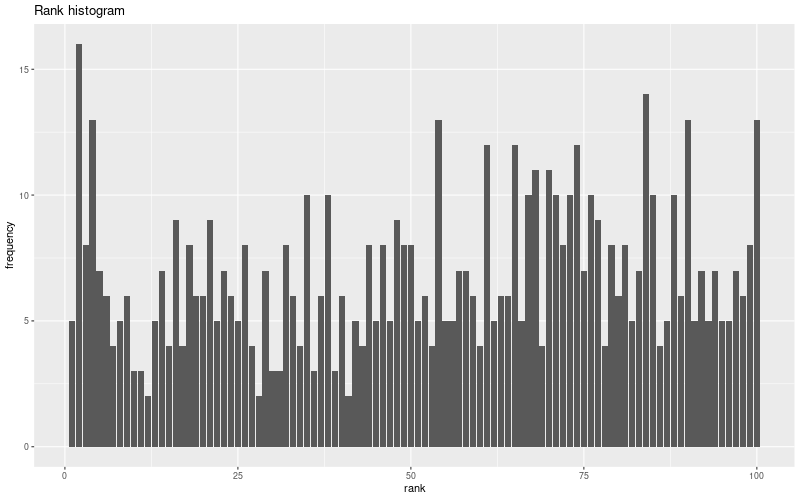
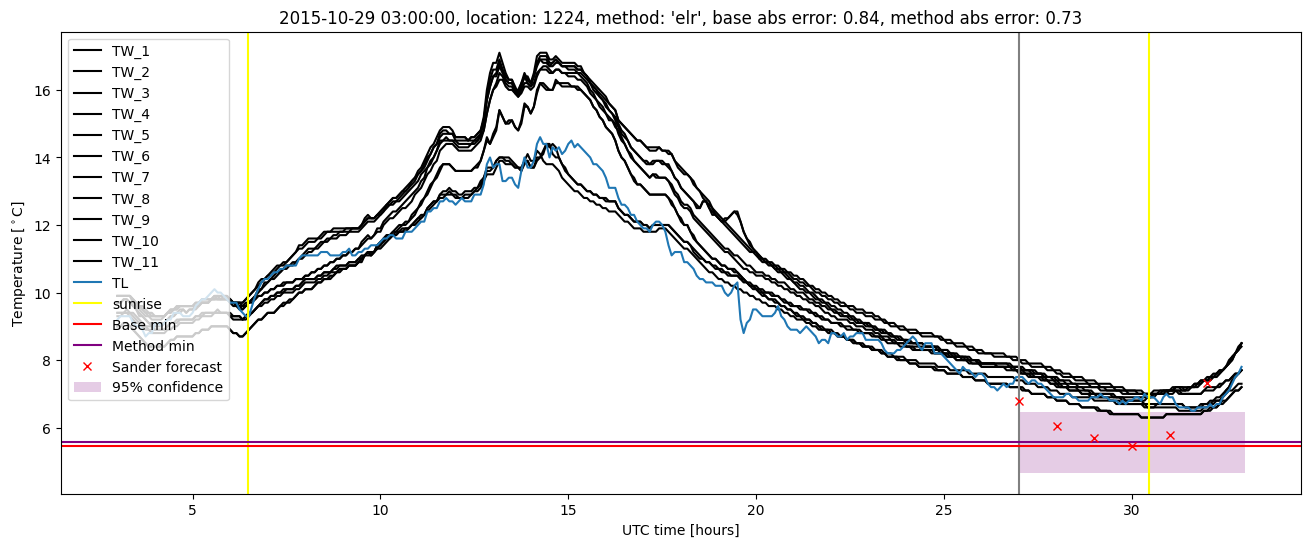
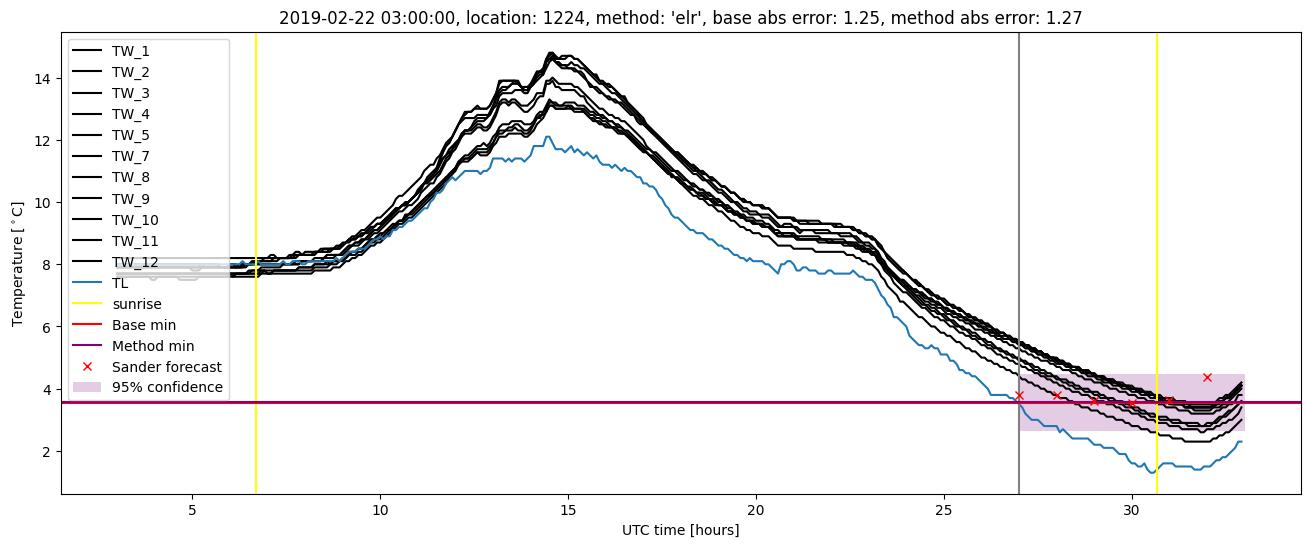
Extended logistic regression plots