GMS location: 1223
Random forest results
| names |
period |
power |
significance |
meanSquareError |
absError |
maxError |
CRPS |
IGN |
| baseline |
winter 2016 |
0.994 |
0.097 |
0.356 |
0.448 |
2.011 |
NaN |
NaN |
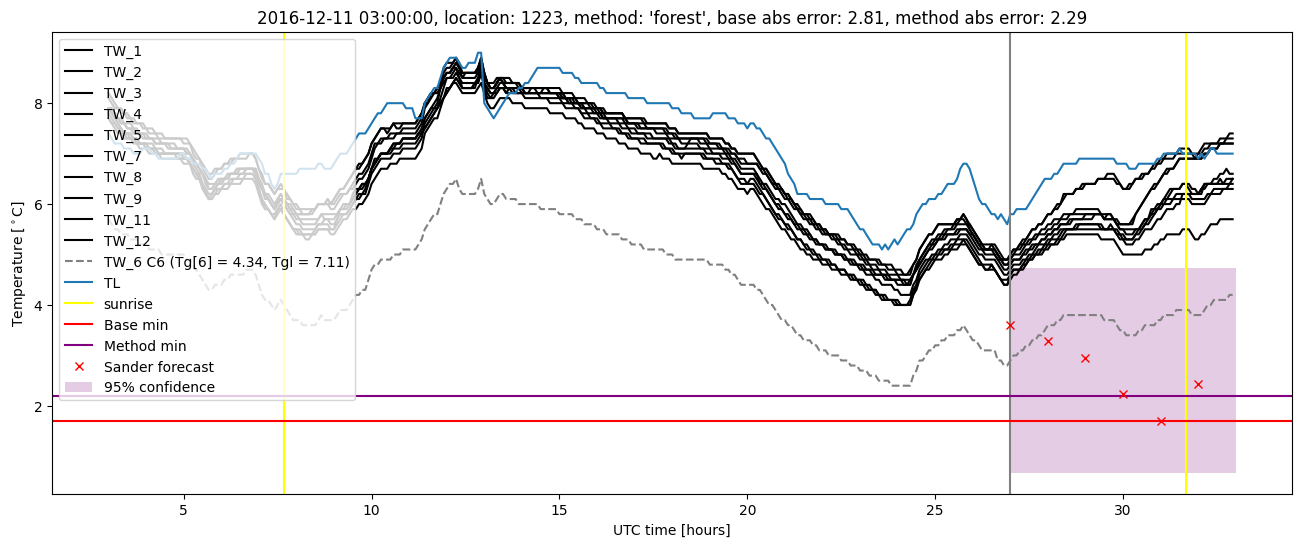
| forest |
winter 2016 |
0.994 |
0.065 |
0.282 |
0.383 |
1.952 |
0.462 |
2.521 |
| baseline |
winter 2017 |
0.965 |
0.128 |
0.499 |
0.505 |
2.806 |
NaN |
NaN |
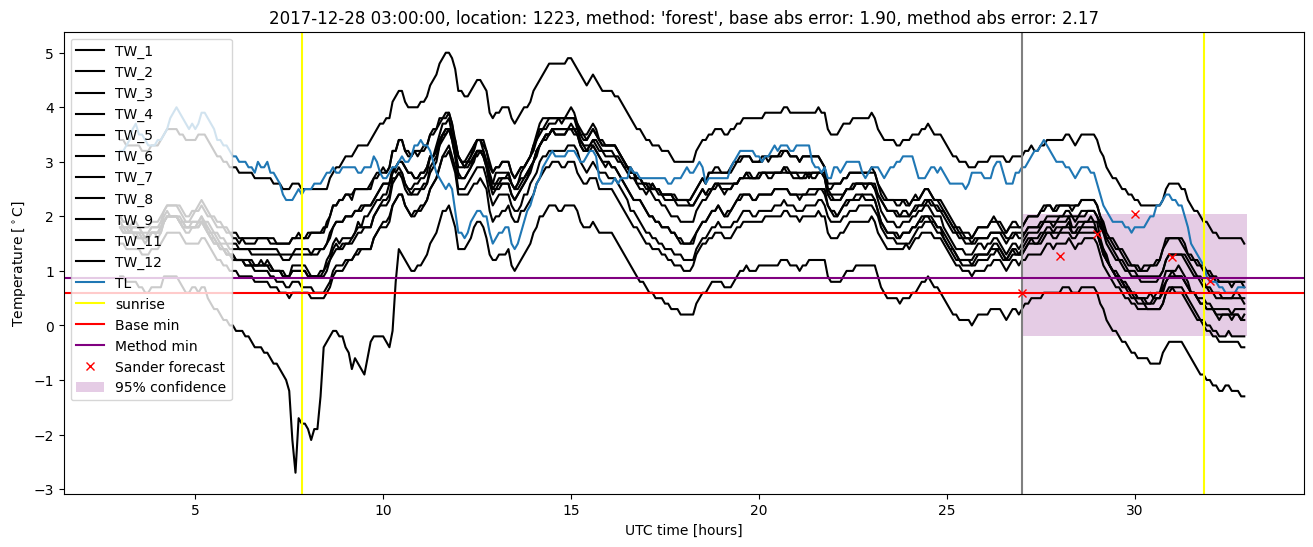
| forest |
winter 2017 |
0.982 |
0.077 |
0.380 |
0.444 |
2.295 |
0.472 |
3.476 |
| baseline |
winter 2018 |
0.991 |
0.077 |
0.430 |
0.451 |
3.047 |
NaN |
NaN |
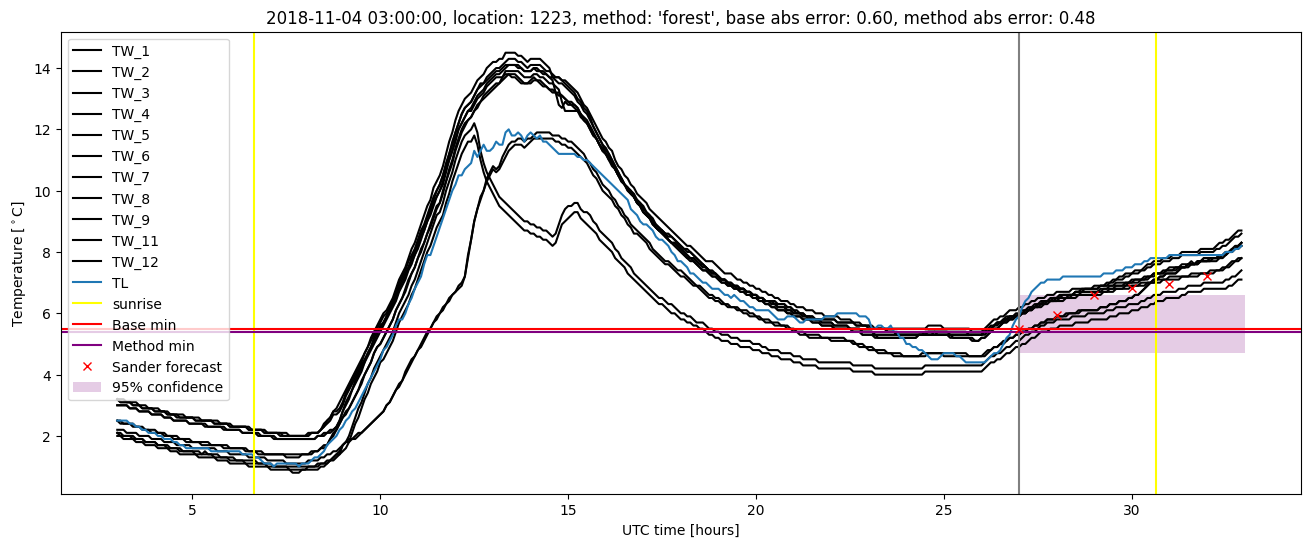
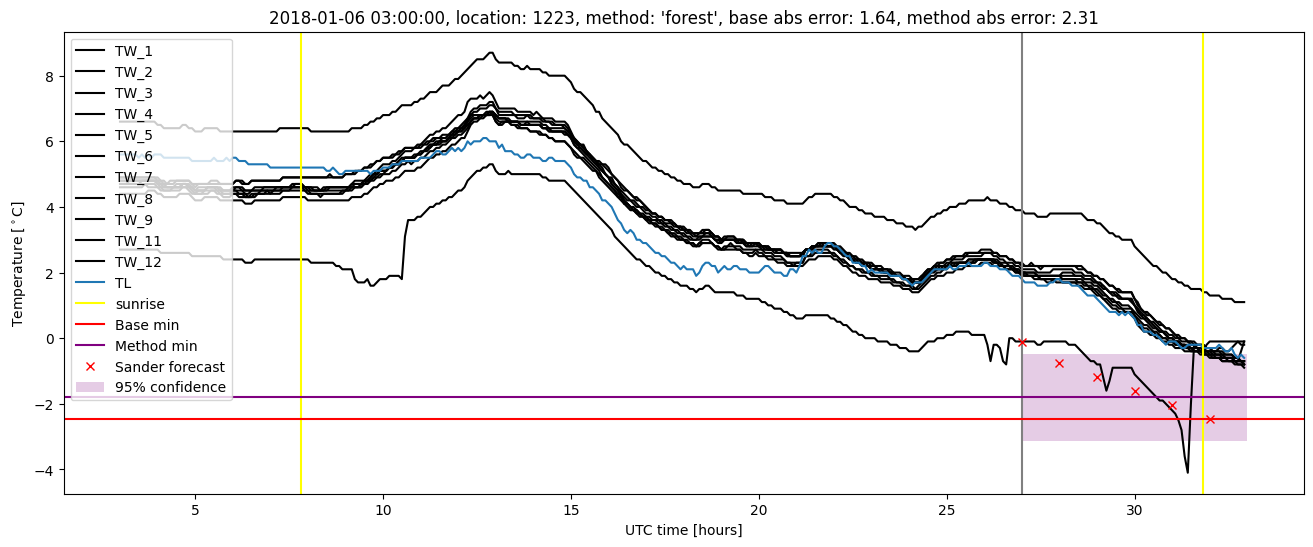
| forest |
winter 2018 |
1.000 |
0.115 |
0.392 |
0.438 |
2.777 |
0.466 |
2.469 |
| baseline |
winter 2019 |
0.982 |
0.083 |
0.357 |
0.434 |
2.093 |
NaN |
NaN |
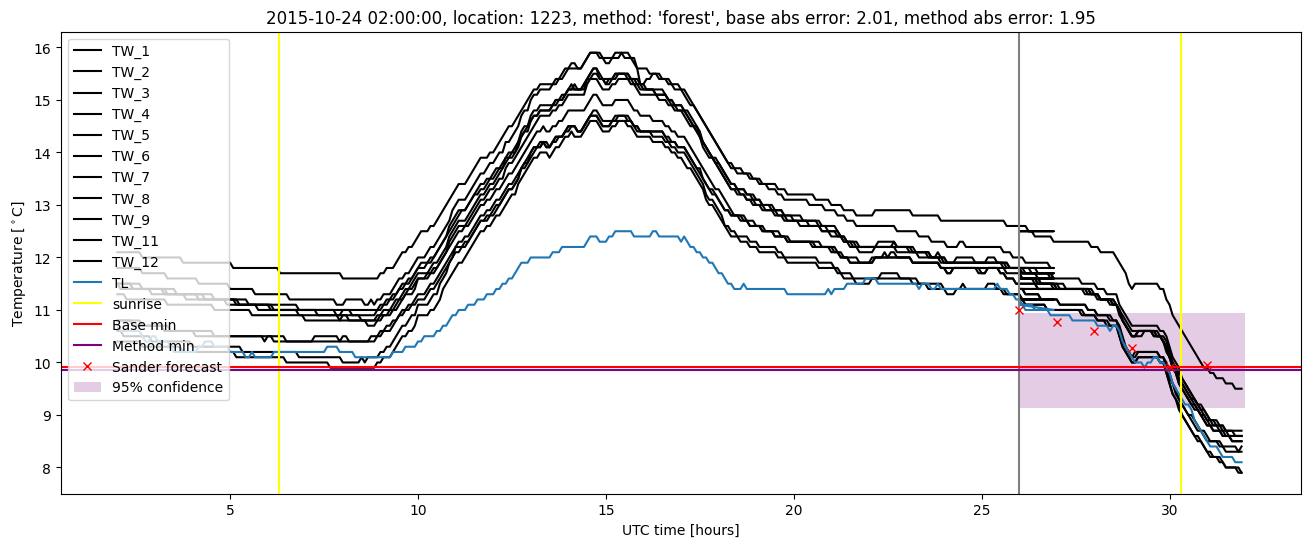
| forest |
winter 2019 |
0.982 |
0.083 |
0.310 |
0.413 |
1.842 |
0.453 |
2.304 |
| baseline |
all |
0.984 |
0.102 |
0.408 |
0.460 |
3.047 |
NaN |
NaN |
| forest |
all |
0.990 |
0.083 |
0.336 |
0.416 |
2.777 |
0.464 |
2.702 |
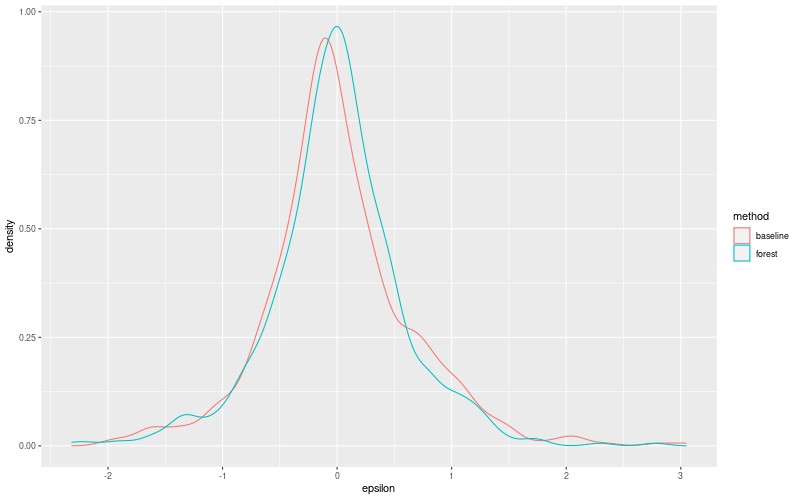
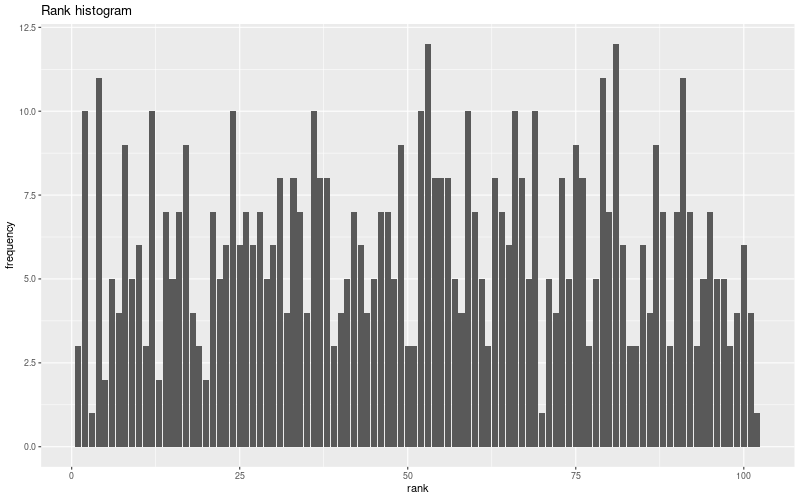
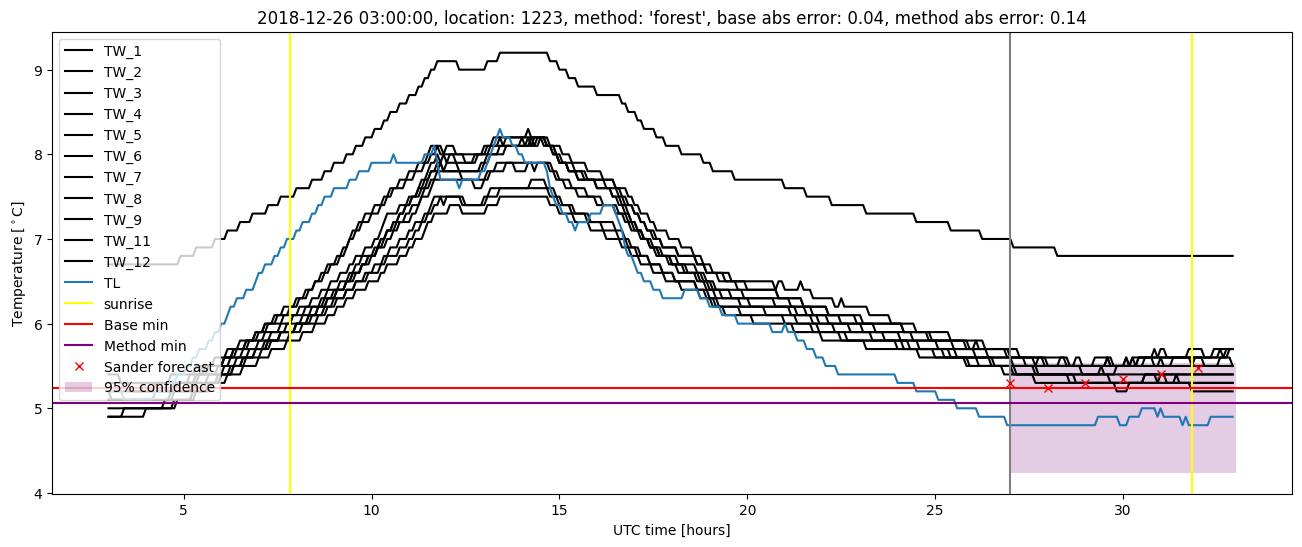
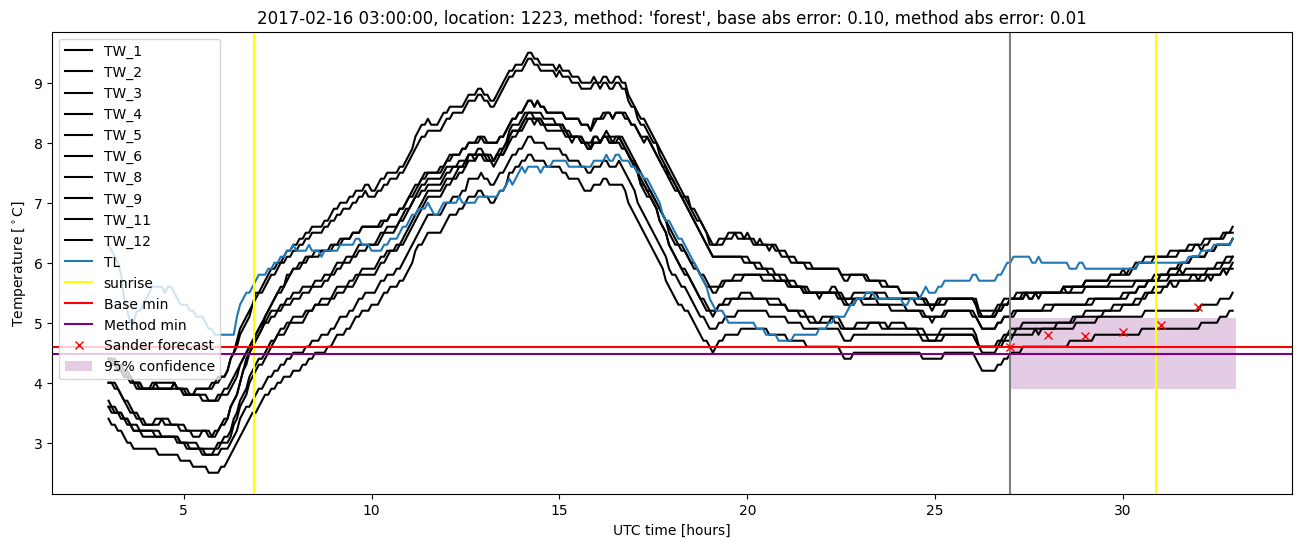
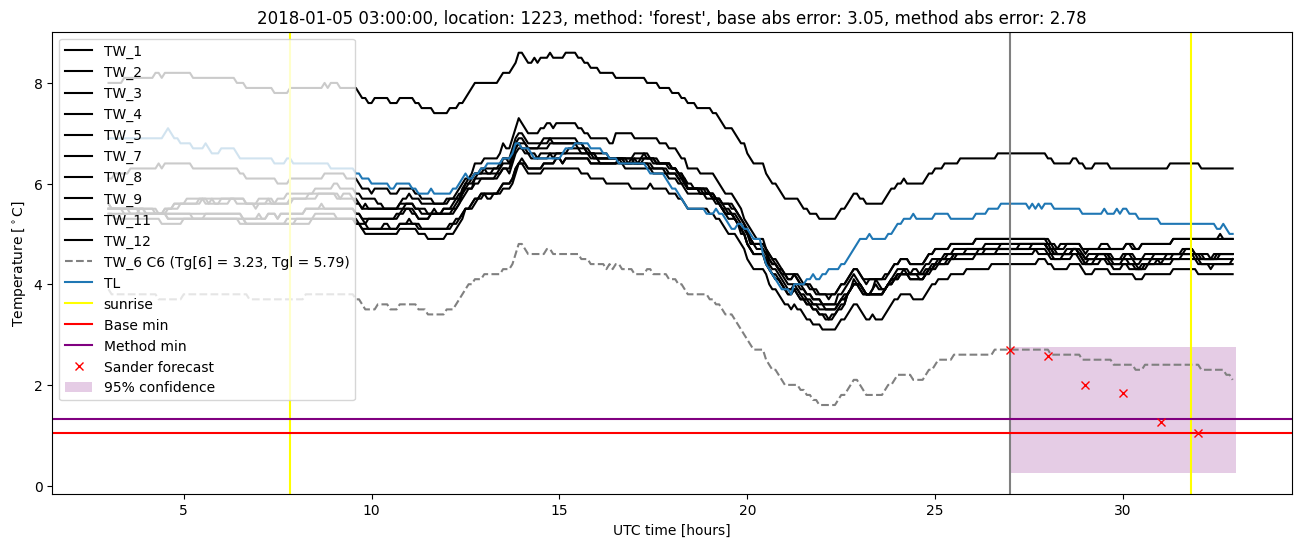
Random forest plots
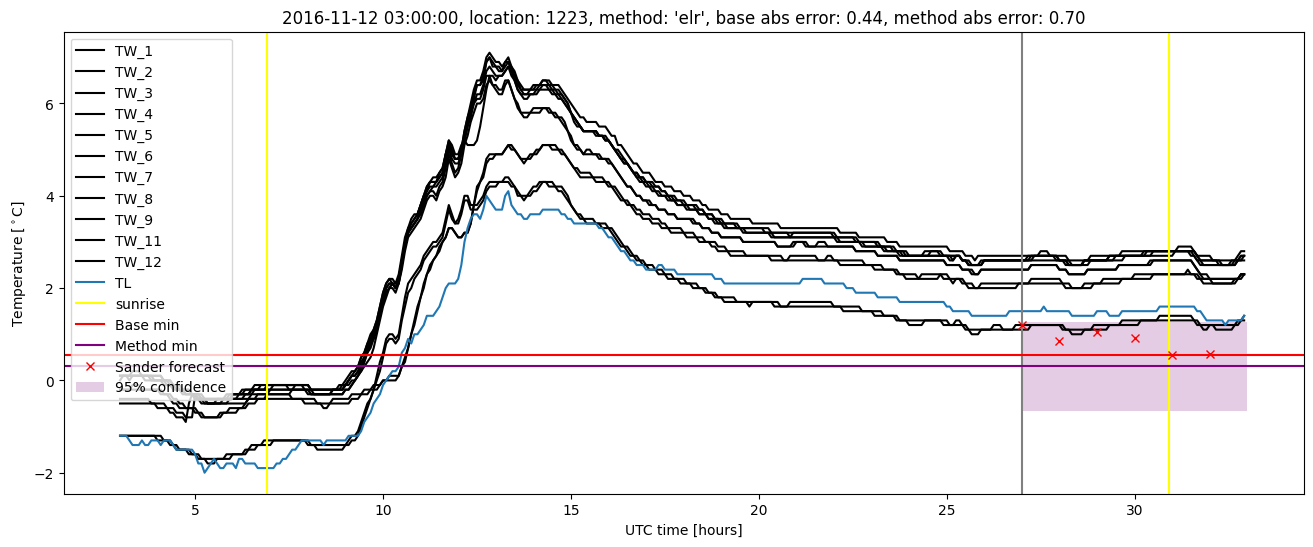
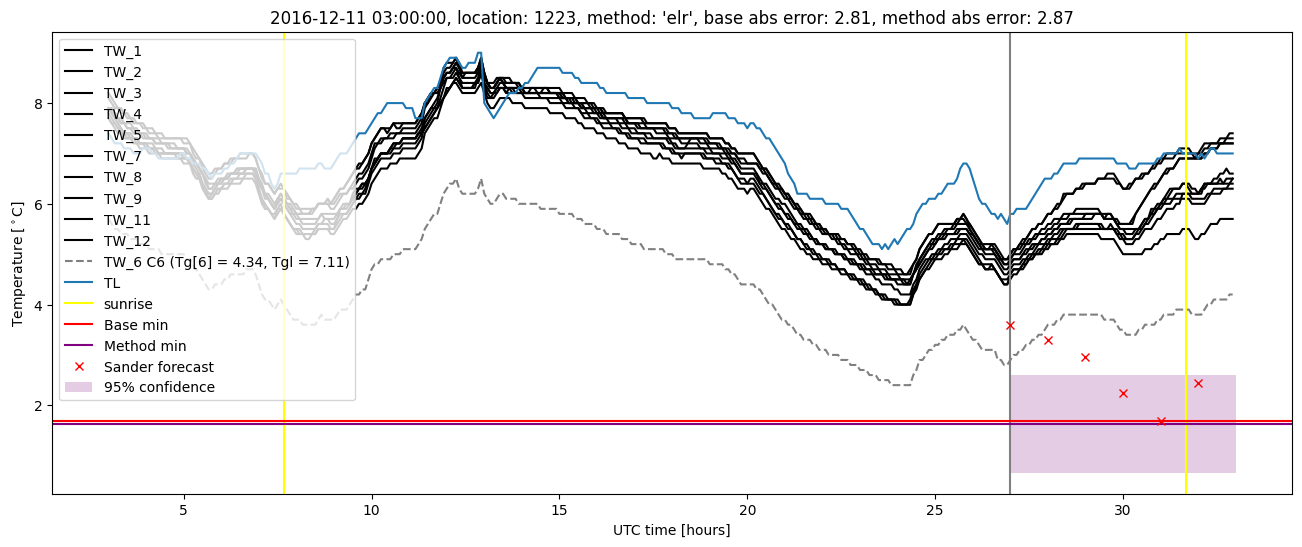
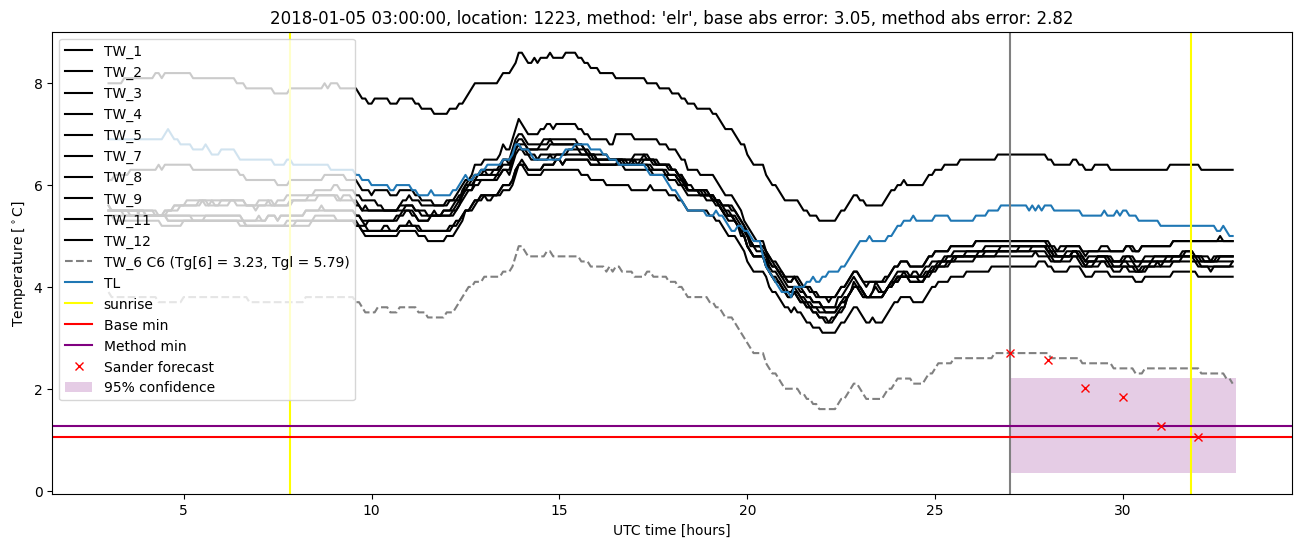
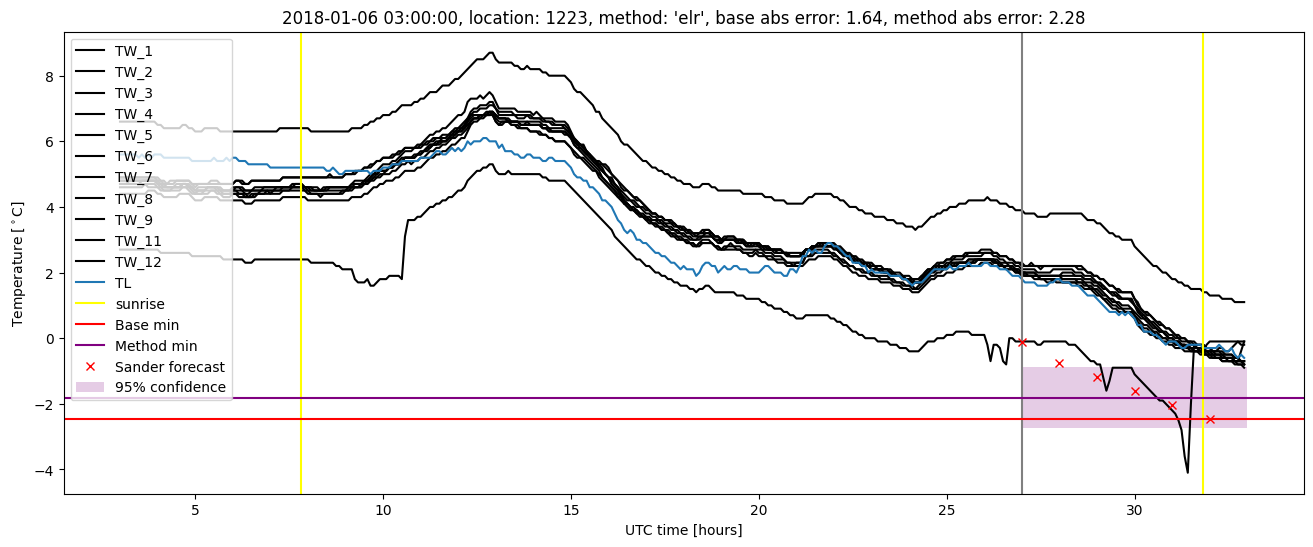
Extended logistic regression results
| names |
period |
power |
significance |
meanSquareError |
absError |
maxError |
CRPS |
IGN |
| baseline |
winter 2016 |
0.994 |
0.097 |
0.356 |
0.448 |
2.011 |
NaN |
NaN |
| elr |
winter 2016 |
0.989 |
0.065 |
0.336 |
0.447 |
1.982 |
0.540 |
2.608 |
| baseline |
winter 2017 |
0.965 |
0.128 |
0.499 |
0.505 |
2.806 |
NaN |
NaN |
| elr |
winter 2017 |
0.956 |
0.077 |
0.440 |
0.484 |
2.866 |
0.533 |
3.045 |
| baseline |
winter 2018 |
0.991 |
0.077 |
0.430 |
0.451 |
3.047 |
NaN |
NaN |
| elr |
winter 2018 |
0.983 |
0.115 |
0.440 |
0.489 |
2.822 |
0.559 |
3.794 |
| baseline |
winter 2019 |
0.982 |
0.083 |
0.357 |
0.434 |
2.093 |
NaN |
NaN |
| elr |
winter 2019 |
0.982 |
0.083 |
0.397 |
0.479 |
2.223 |
0.491 |
2.569 |
| baseline |
all |
0.984 |
0.102 |
0.408 |
0.460 |
3.047 |
NaN |
NaN |
| elr |
all |
0.979 |
0.083 |
0.397 |
0.472 |
2.866 |
0.533 |
2.976 |
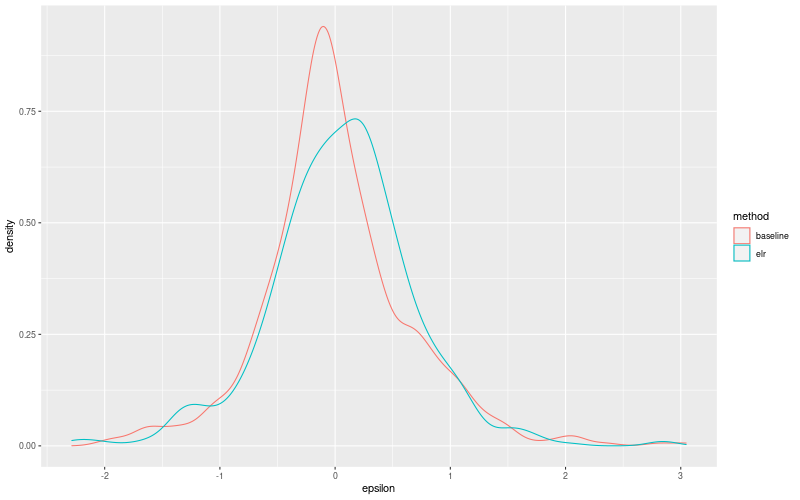
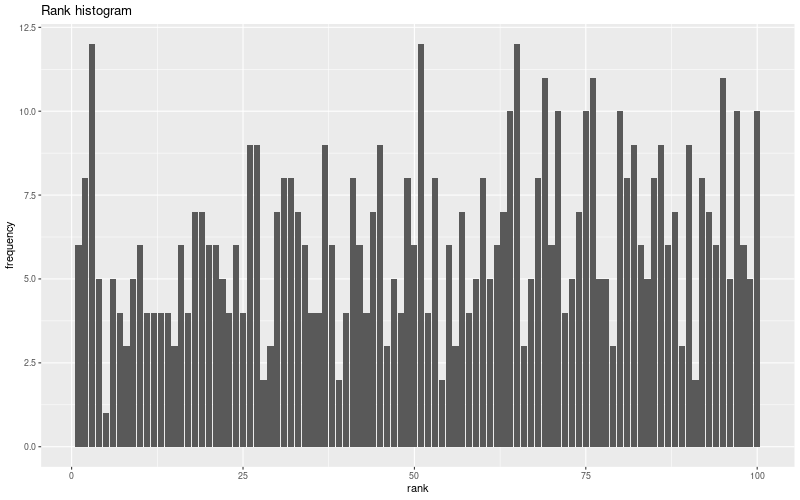
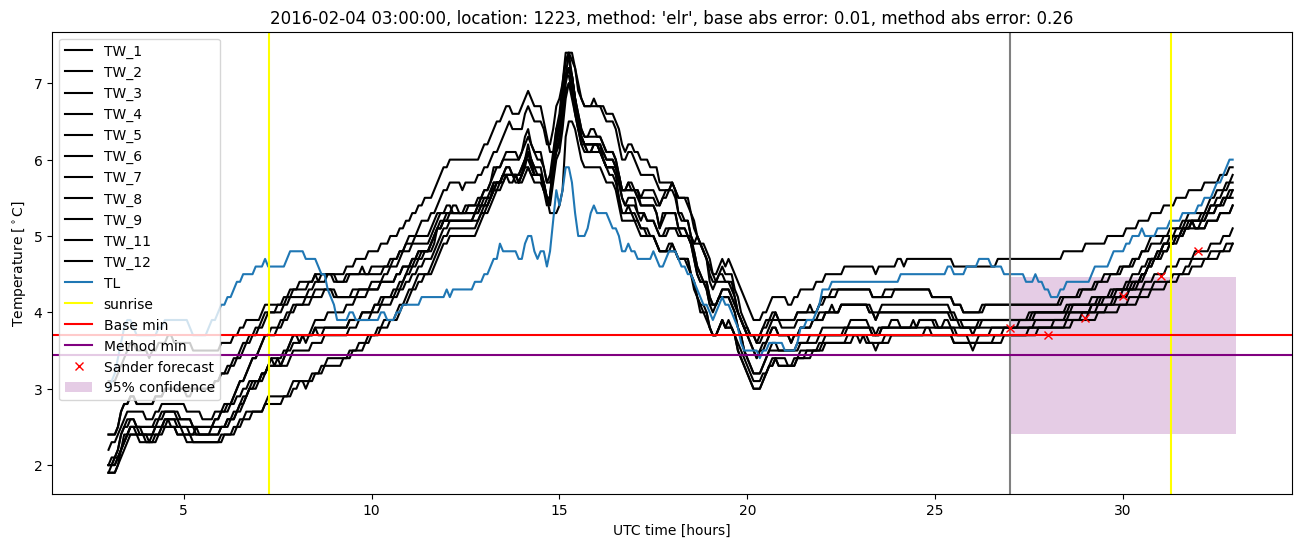
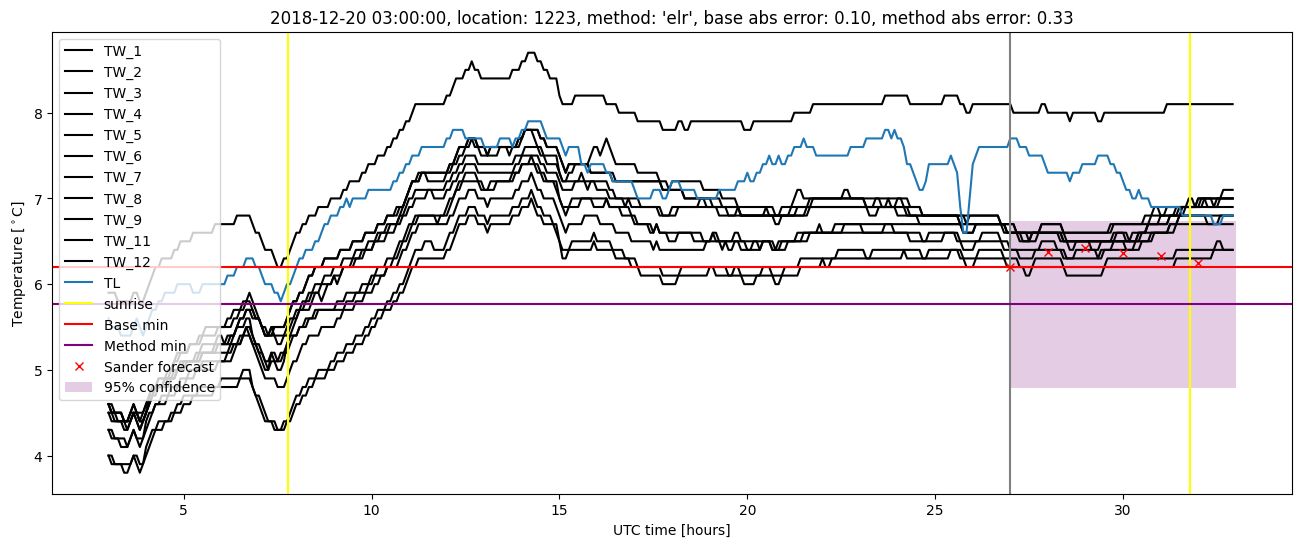
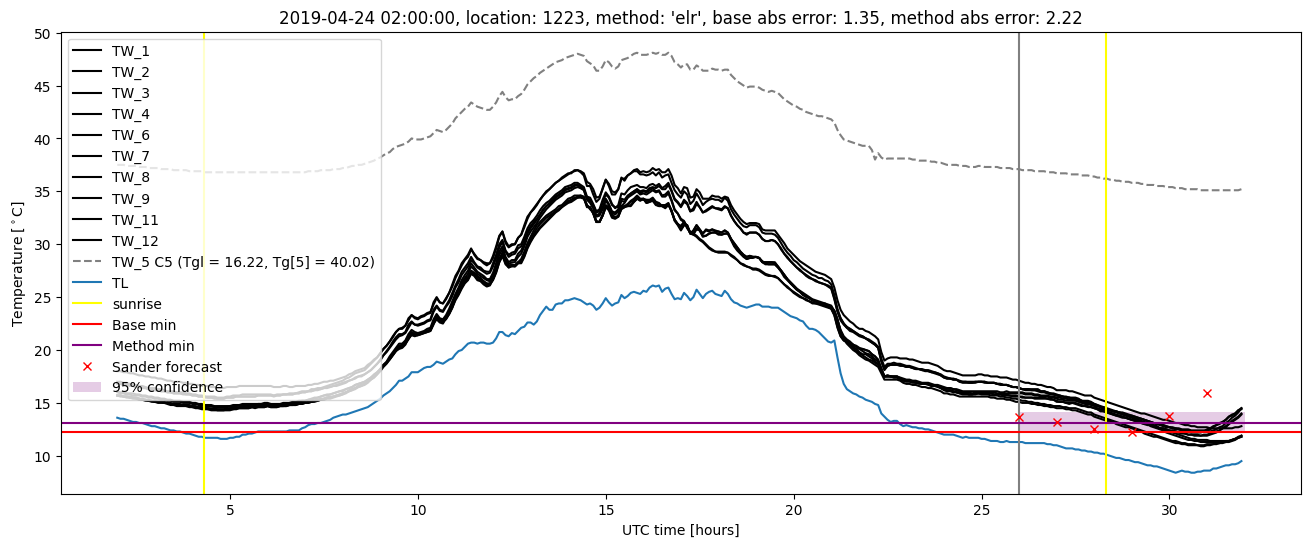
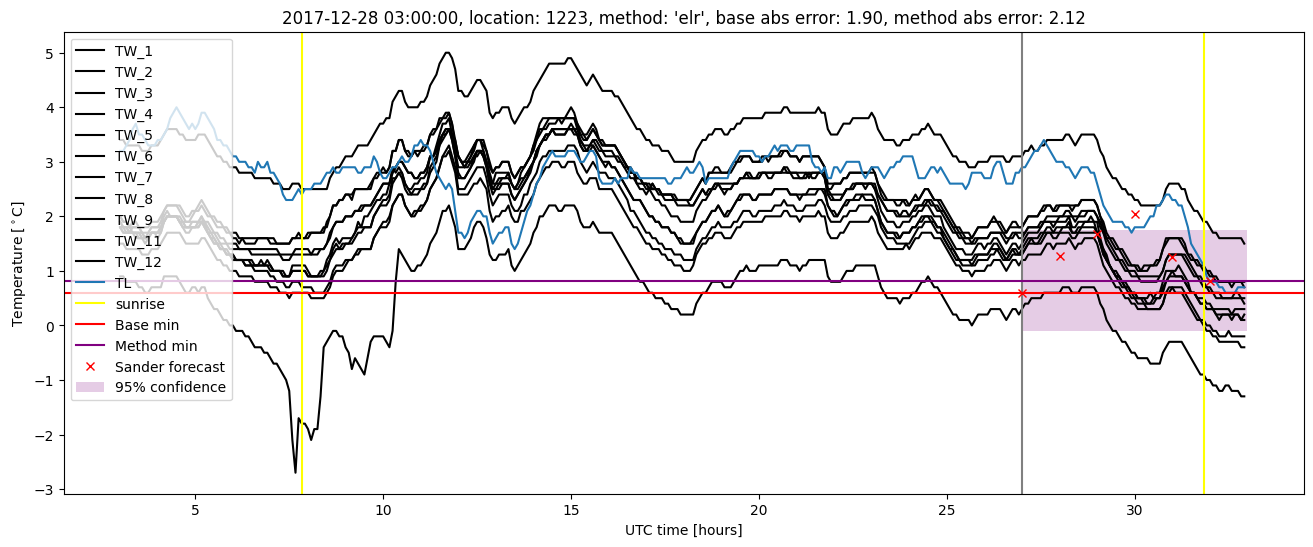
Extended logistic regression plots