GMS location: 1222
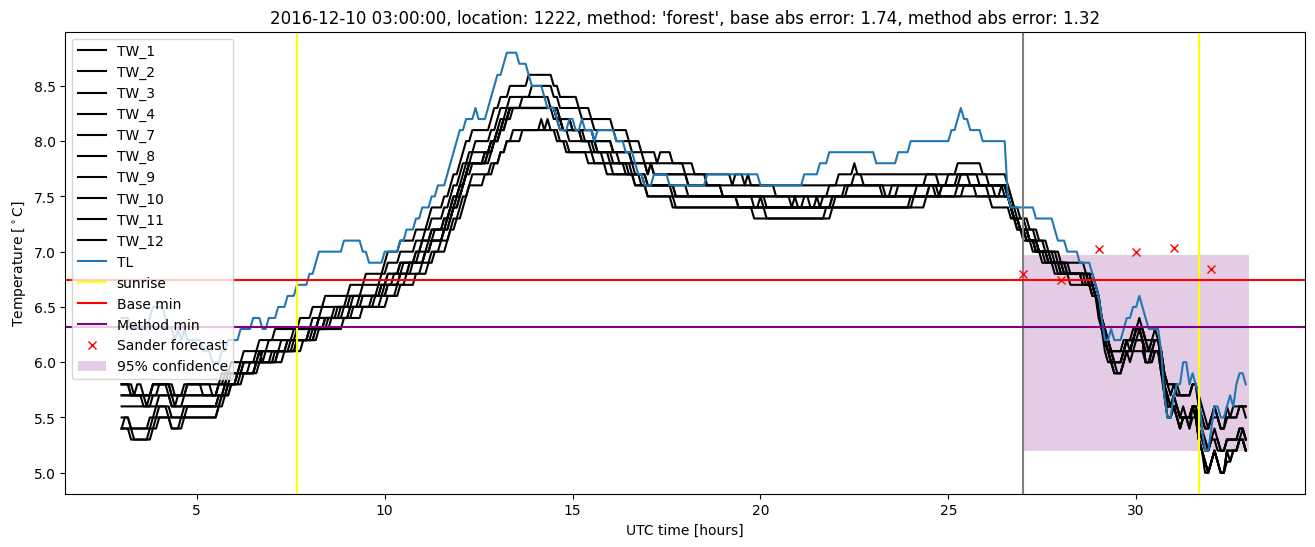
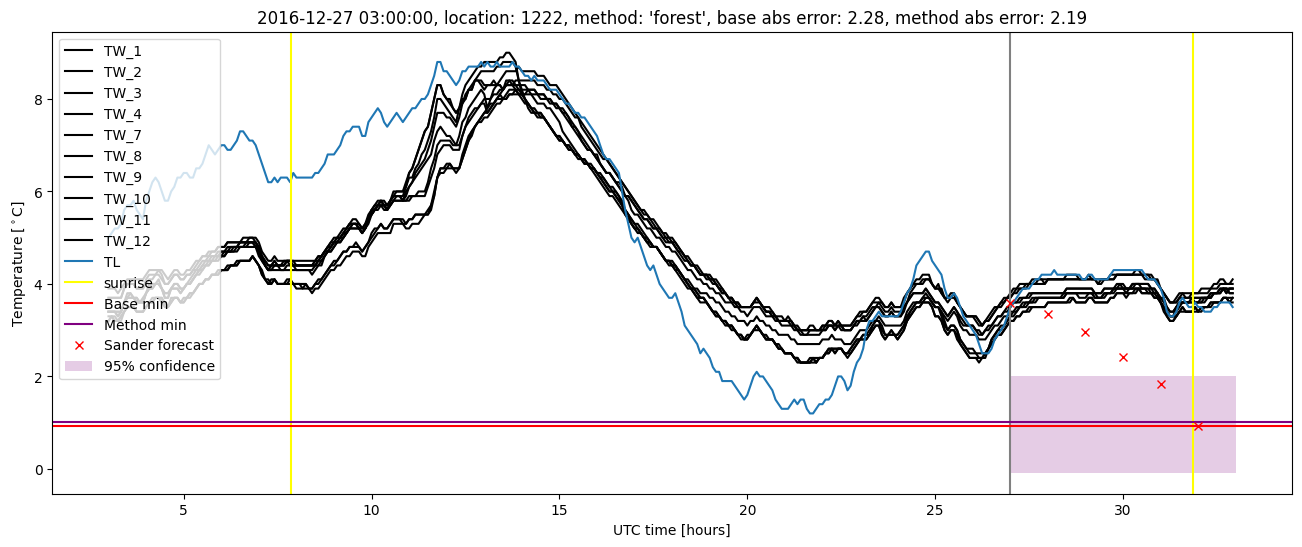
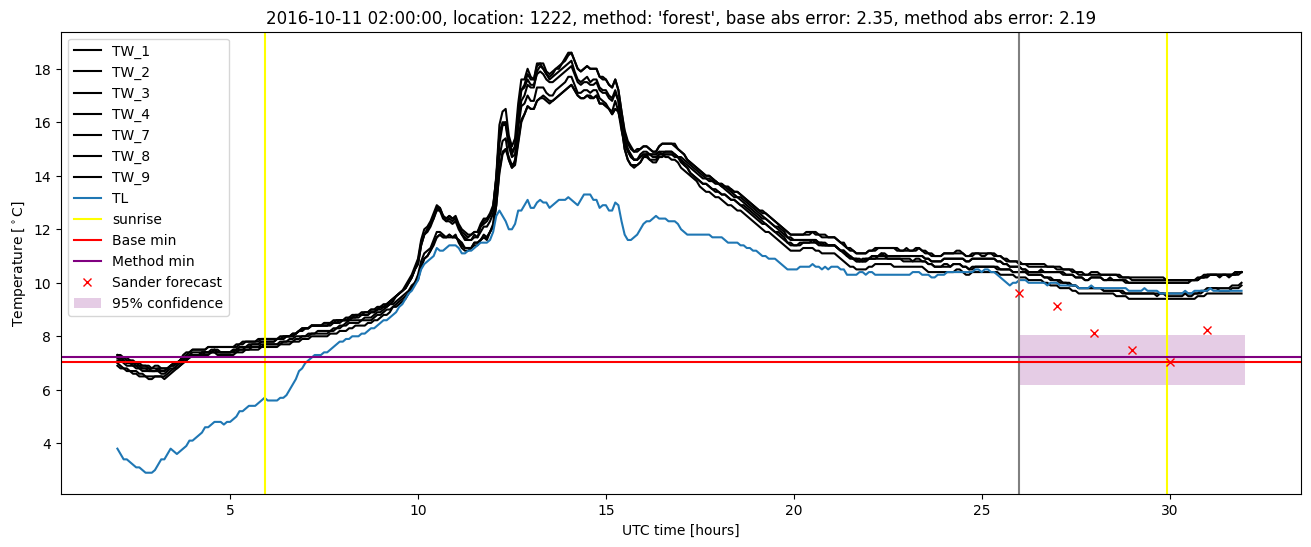
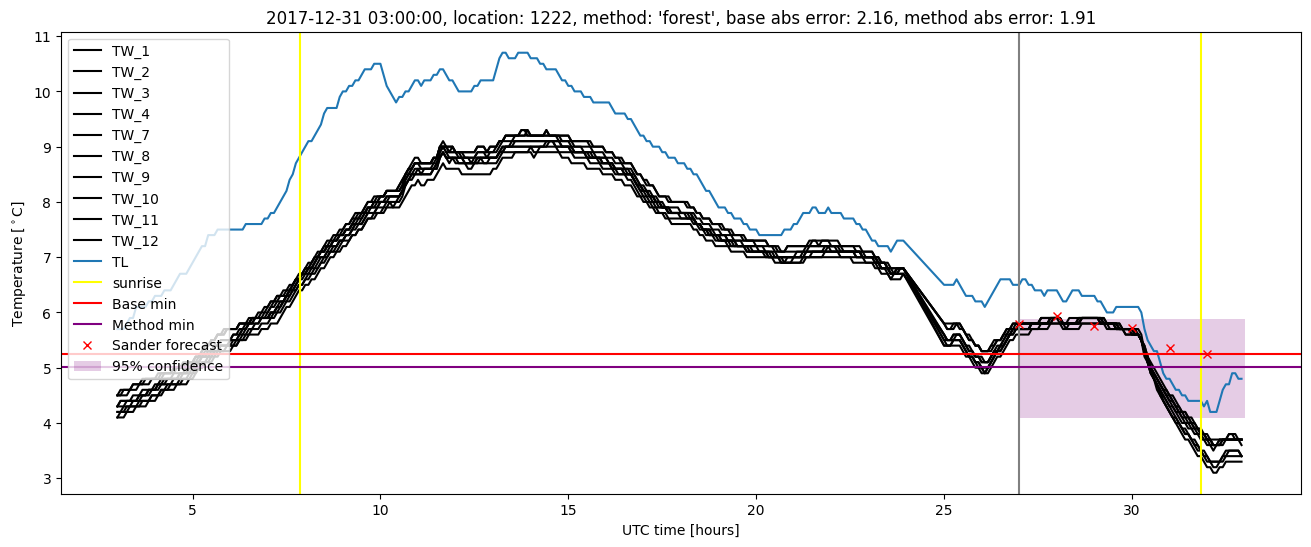
Random forest results
| names |
period |
power |
significance |
meanSquareError |
absError |
maxError |
CRPS |
IGN |
| baseline |
winter 2016 |
0.988 |
0.000e+00 |
0.340 |
0.429 |
2.047 |
NaN |
NaN |
| forest |
winter 2016 |
0.976 |
0.000e+00 |
0.258 |
0.367 |
1.832 |
0.525 |
3.190 |
| baseline |
winter 2017 |
0.982 |
0.075 |
0.536 |
0.514 |
2.448 |
NaN |
NaN |
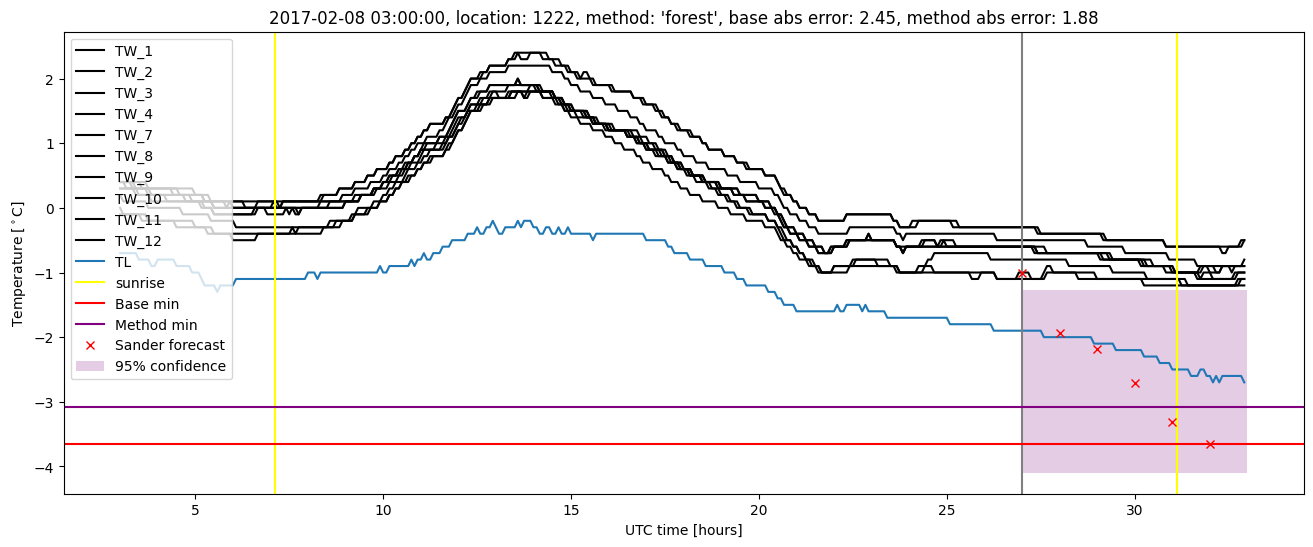
| forest |
winter 2017 |
0.974 |
0.075 |
0.397 |
0.452 |
2.194 |
0.520 |
4.329 |
| baseline |
winter 2018 |
0.992 |
0.077 |
0.399 |
0.462 |
2.383 |
NaN |
NaN |
| forest |
winter 2018 |
0.992 |
0.077 |
0.343 |
0.437 |
1.926 |
0.497 |
2.846 |
| baseline |
winter 2019 |
0.985 |
0.000e+00 |
0.288 |
0.389 |
1.671 |
NaN |
NaN |
| forest |
winter 2019 |
0.985 |
0.000e+00 |
0.223 |
0.349 |
1.451 |
0.499 |
2.999 |
| baseline |
all |
0.987 |
0.045 |
0.389 |
0.448 |
2.448 |
NaN |
NaN |
| forest |
all |
0.981 |
0.045 |
0.303 |
0.399 |
2.194 |
0.512 |
3.344 |
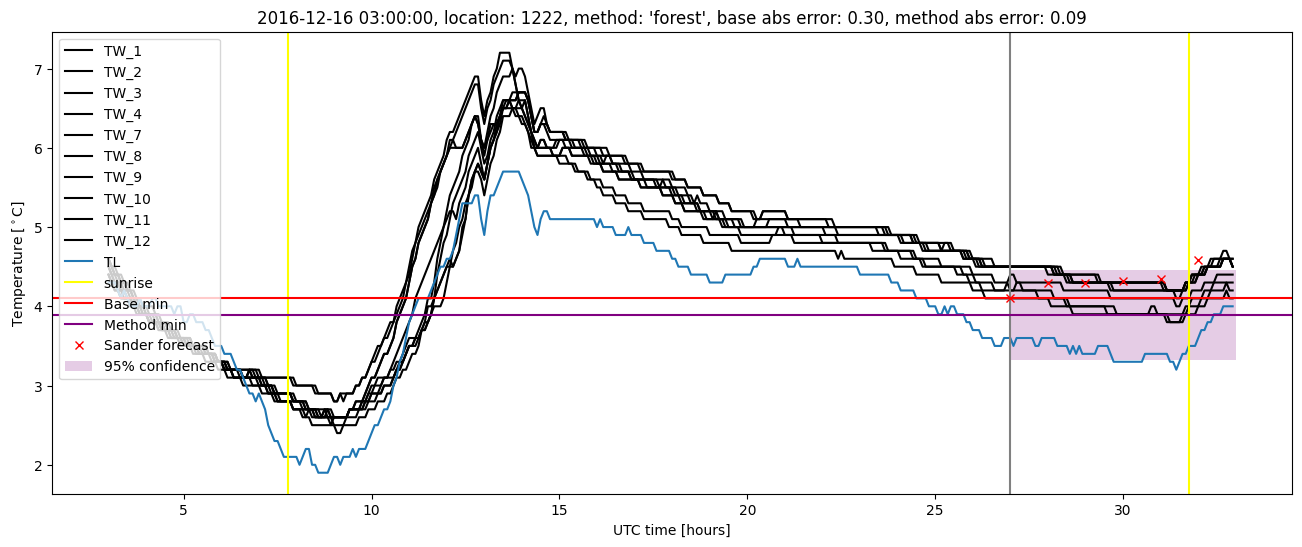
Random forest plots


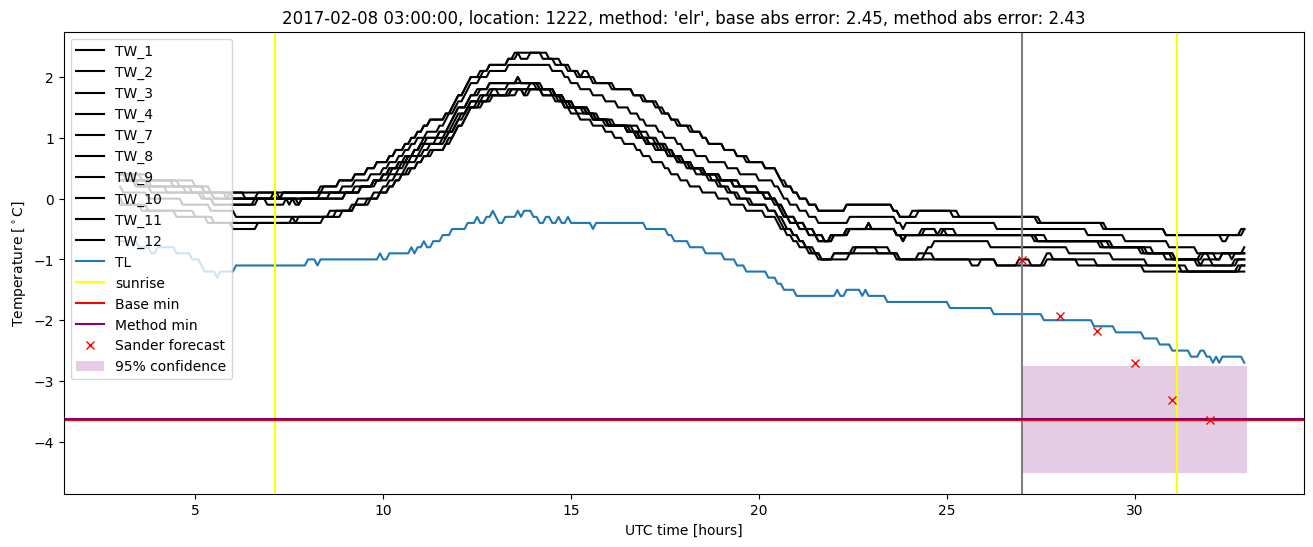
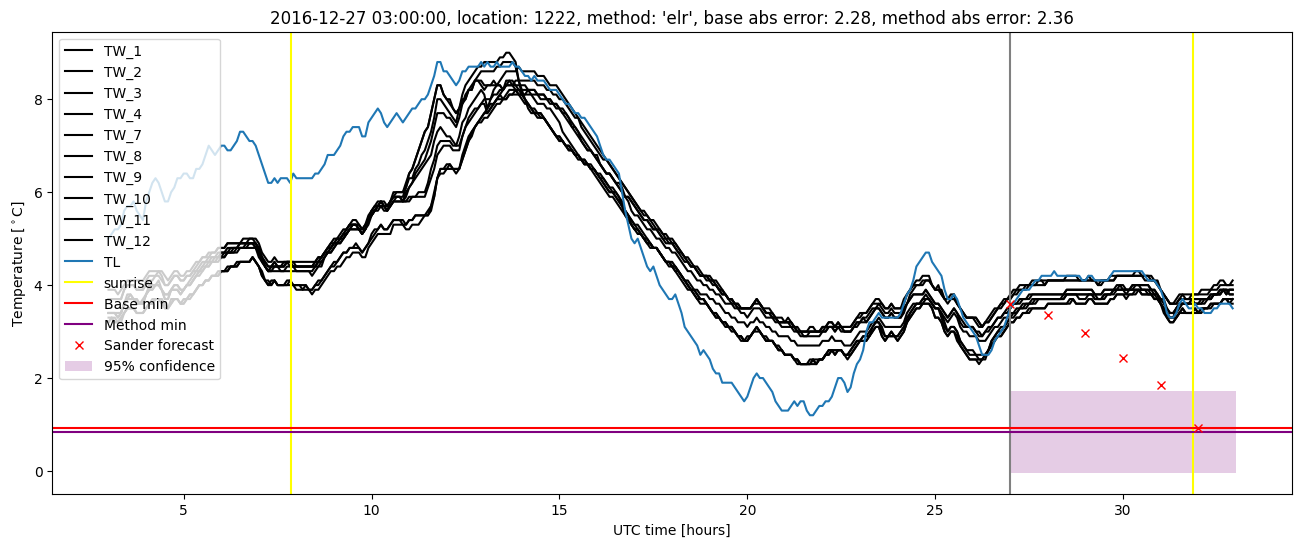
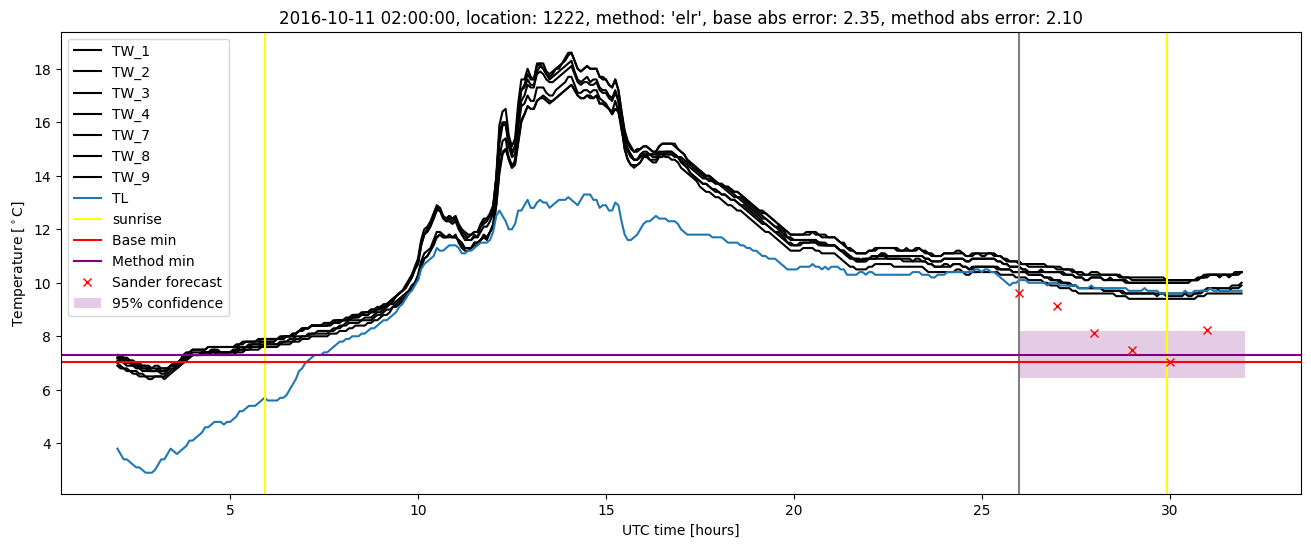
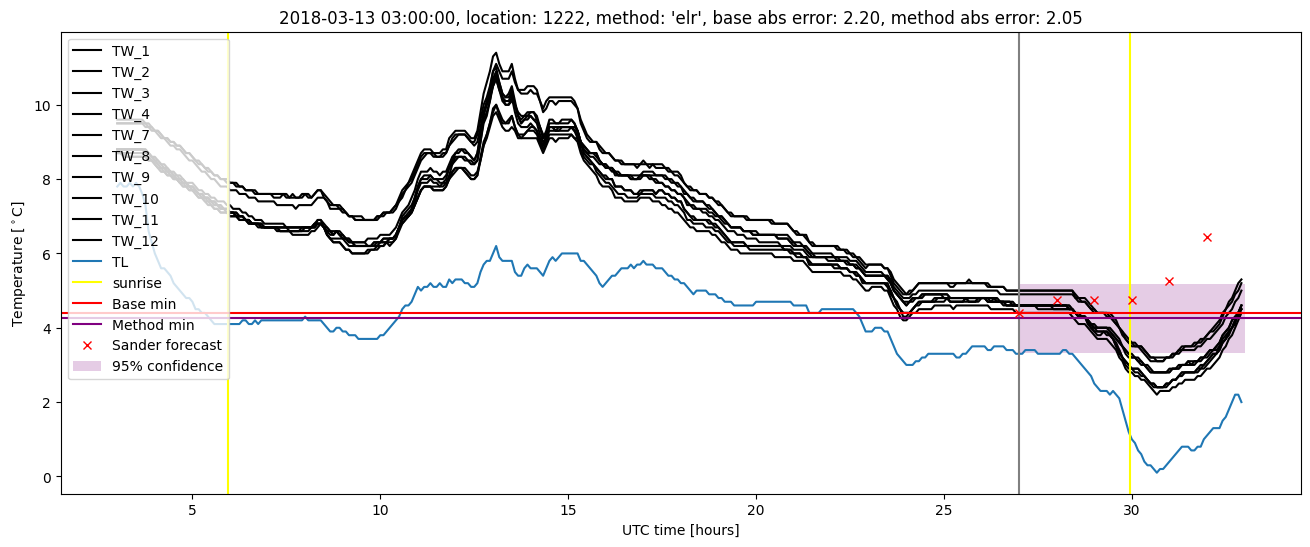
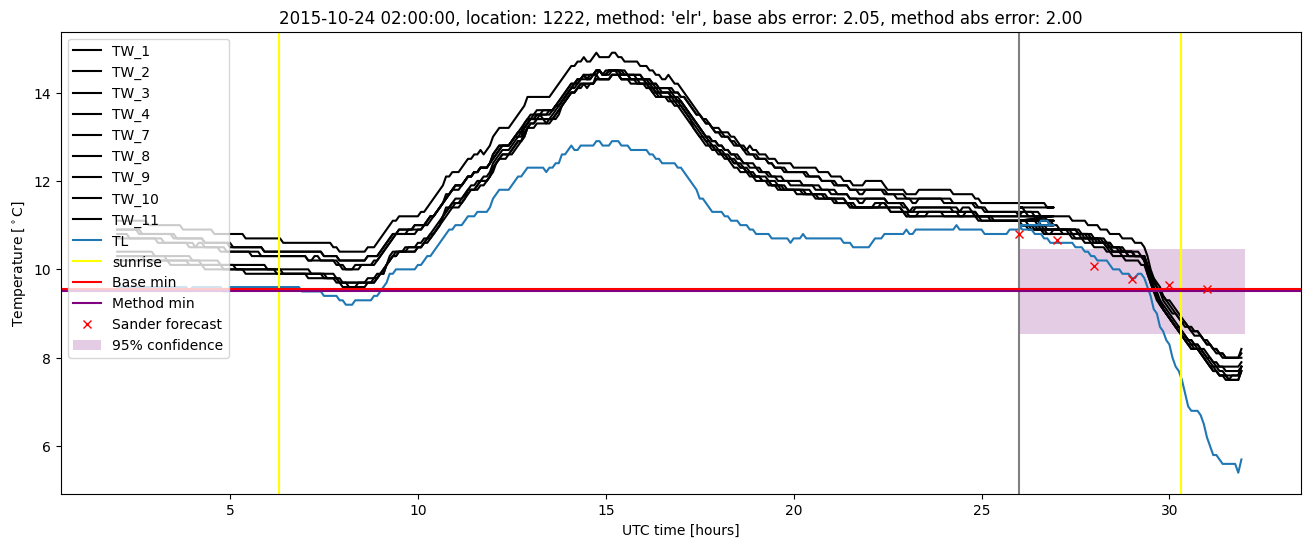
Extended logistic regression results
| names |
period |
power |
significance |
meanSquareError |
absError |
maxError |
CRPS |
IGN |
| baseline |
winter 2016 |
0.988 |
0.000e+00 |
0.340 |
0.429 |
2.047 |
NaN |
NaN |
| elr |
winter 2016 |
0.963 |
0.000e+00 |
0.339 |
0.462 |
2.004 |
0.607 |
3.900 |
| baseline |
winter 2017 |
0.982 |
0.075 |
0.536 |
0.514 |
2.448 |
NaN |
NaN |
| elr |
winter 2017 |
0.974 |
0.075 |
0.490 |
0.495 |
2.433 |
0.553 |
4.622 |
| baseline |
winter 2018 |
0.992 |
0.077 |
0.399 |
0.462 |
2.383 |
NaN |
NaN |
| elr |
winter 2018 |
0.992 |
0.077 |
0.380 |
0.474 |
2.052 |
0.600 |
4.442 |
| baseline |
winter 2019 |
0.985 |
0.000e+00 |
0.288 |
0.389 |
1.671 |
NaN |
NaN |
| elr |
winter 2019 |
0.985 |
0.000e+00 |
0.301 |
0.421 |
1.444 |
0.537 |
3.023 |
| baseline |
all |
0.987 |
0.045 |
0.389 |
0.448 |
2.448 |
NaN |
NaN |
| elr |
all |
0.977 |
0.045 |
0.376 |
0.463 |
2.433 |
0.577 |
3.997 |
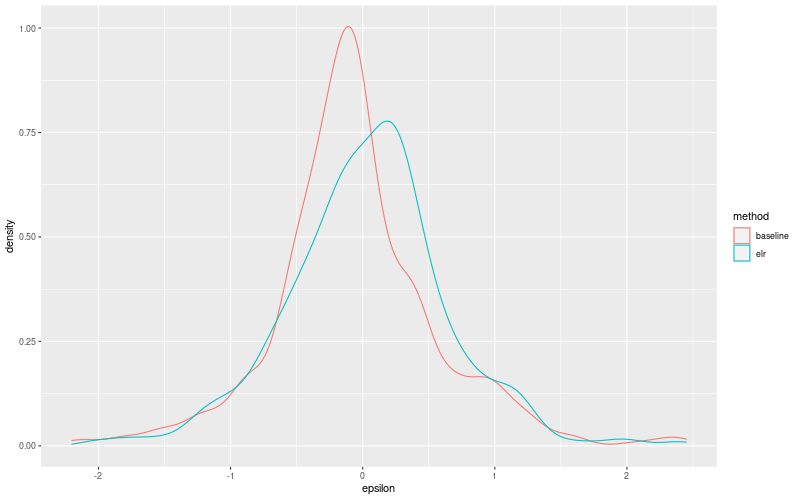
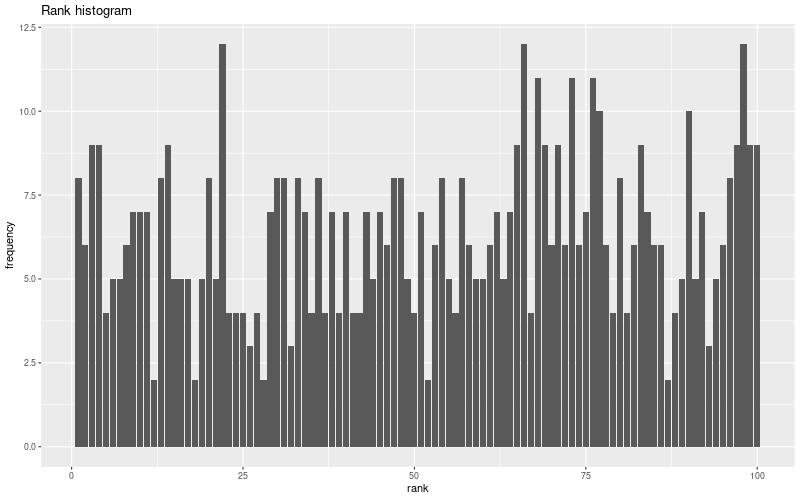
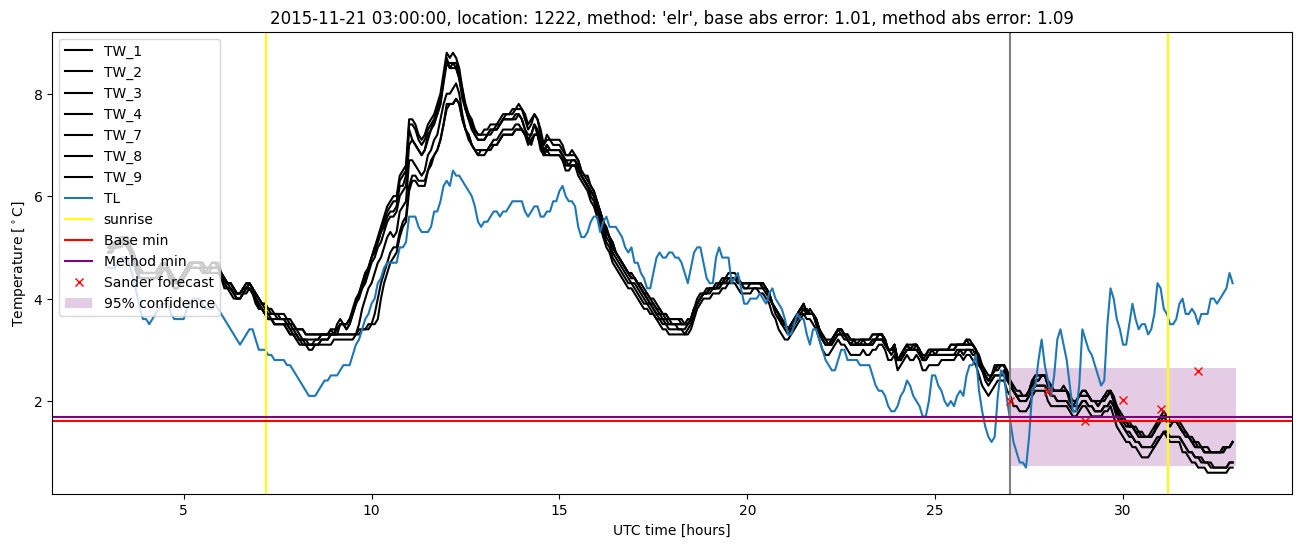
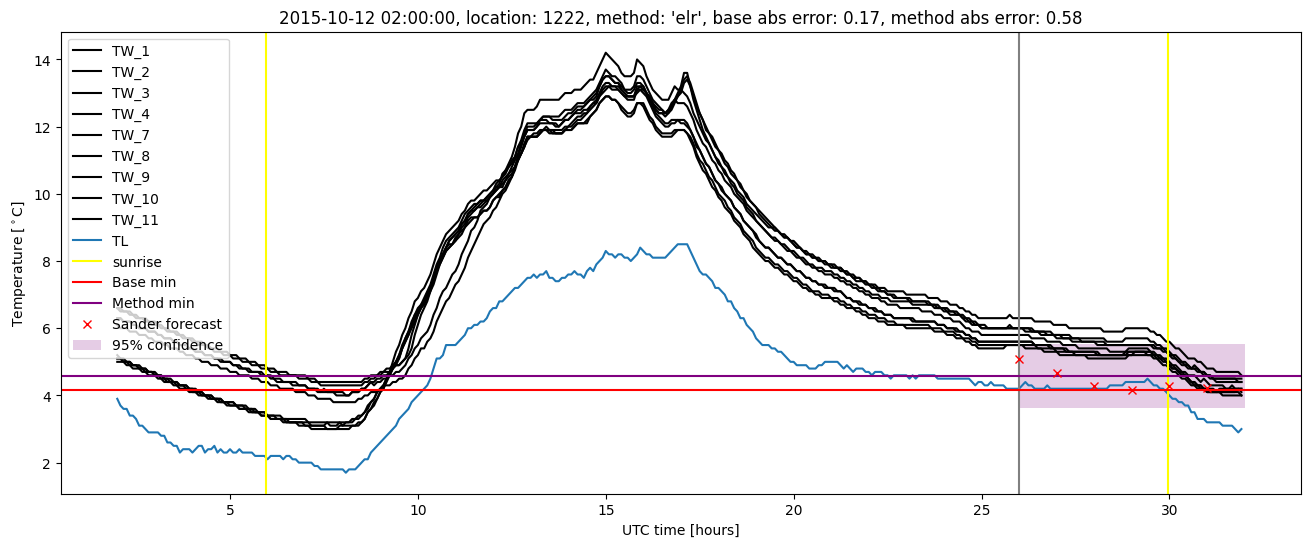
Extended logistic regression plots