GMS location: 1221
Random forest results
| names |
period |
power |
significance |
meanSquareError |
absError |
maxError |
CRPS |
IGN |
| baseline |
winter 2016 |
0.975 |
0.091 |
0.335 |
0.441 |
1.944 |
NaN |
NaN |
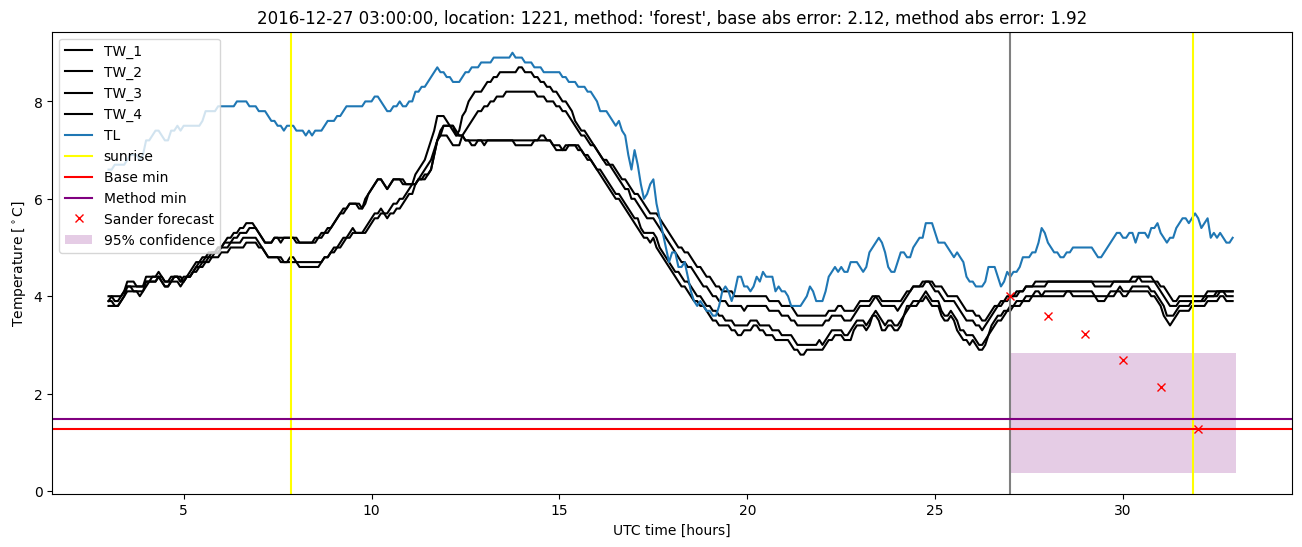
| forest |
winter 2016 |
0.982 |
0.091 |
0.244 |
0.377 |
1.897 |
0.504 |
3.006 |
| baseline |
winter 2017 |
0.974 |
0.086 |
0.587 |
0.543 |
2.667 |
NaN |
NaN |
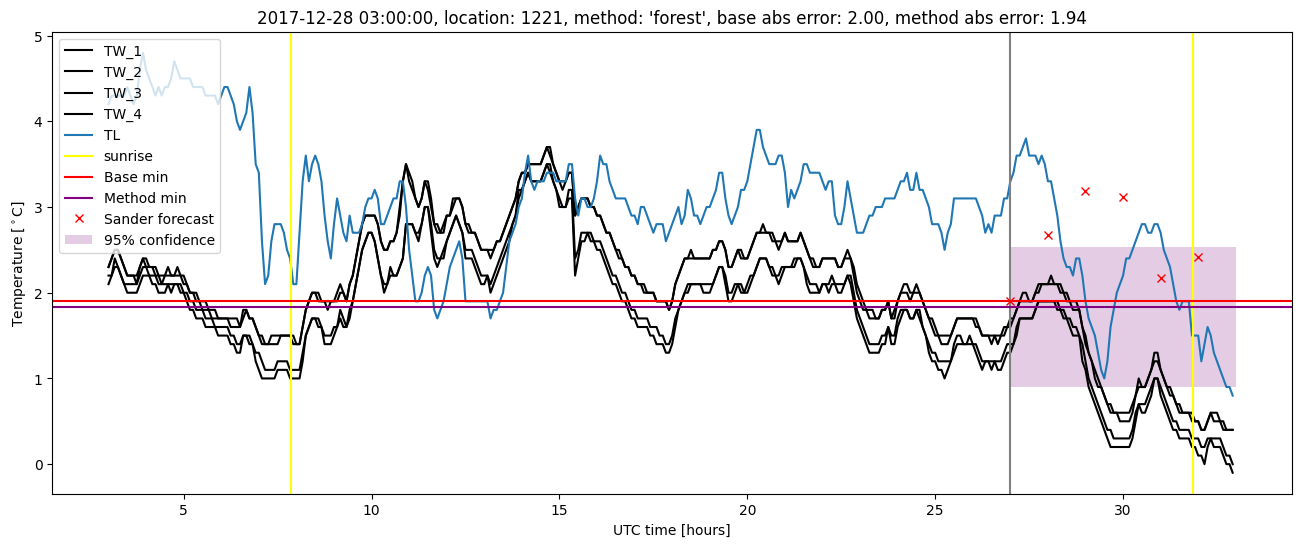
| forest |
winter 2017 |
1.000 |
0.086 |
0.423 |
0.469 |
2.420 |
0.503 |
4.075 |
| baseline |
winter 2018 |
0.986 |
0.108 |
0.432 |
0.470 |
2.379 |
NaN |
NaN |
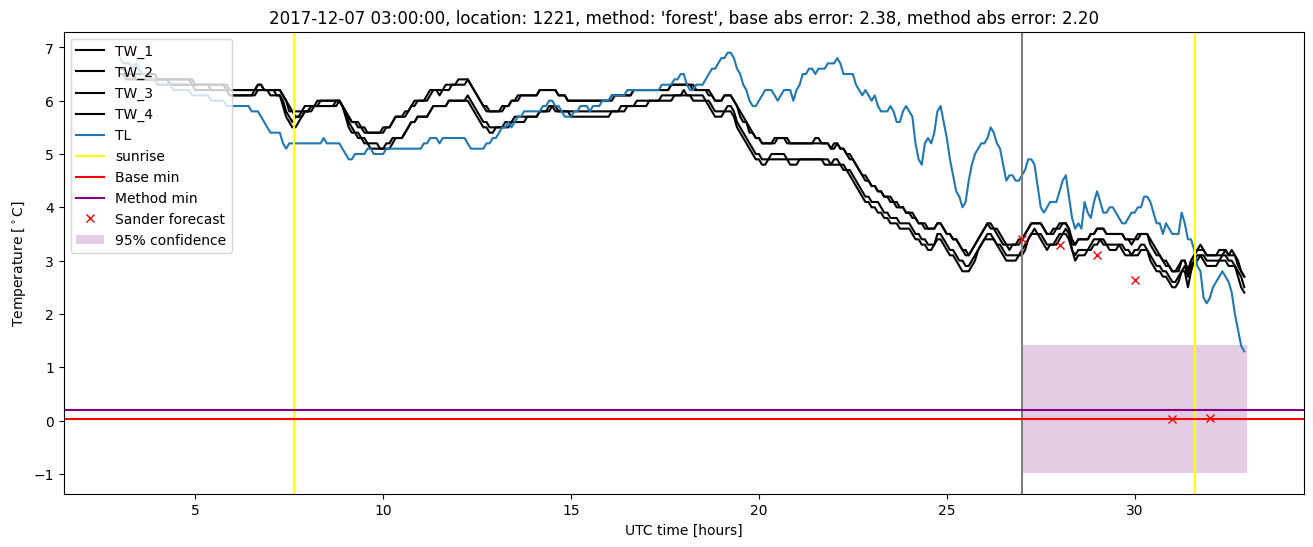
| forest |
winter 2018 |
0.993 |
0.108 |
0.386 |
0.443 |
2.200 |
0.497 |
2.891 |
| baseline |
winter 2019 |
0.988 |
0.000e+00 |
0.303 |
0.403 |
1.786 |
NaN |
NaN |
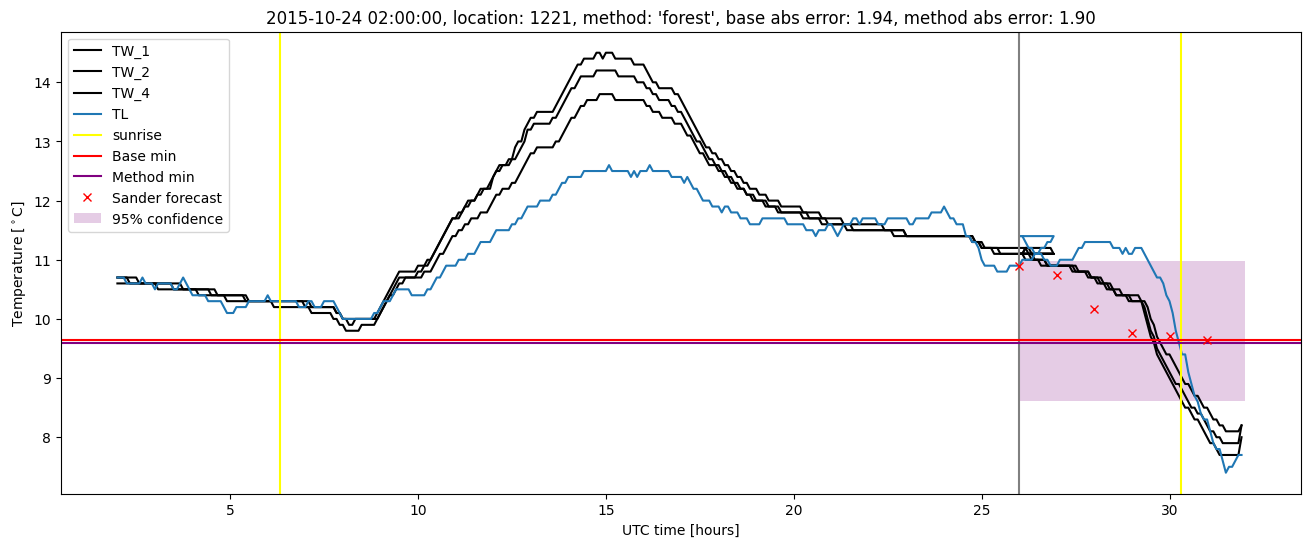
| forest |
winter 2019 |
0.994 |
0.000e+00 |
0.255 |
0.369 |
1.676 |
0.488 |
2.885 |
| baseline |
all |
0.981 |
0.085 |
0.406 |
0.461 |
2.667 |
NaN |
NaN |
| forest |
all |
0.991 |
0.085 |
0.322 |
0.412 |
2.420 |
0.498 |
3.178 |
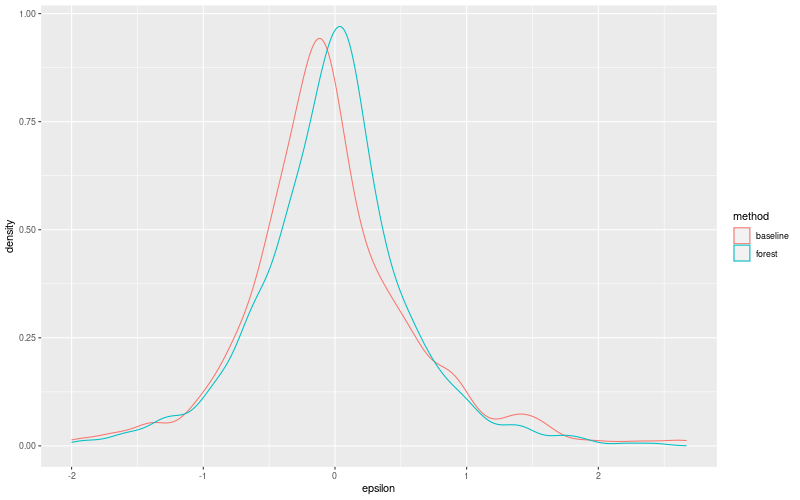
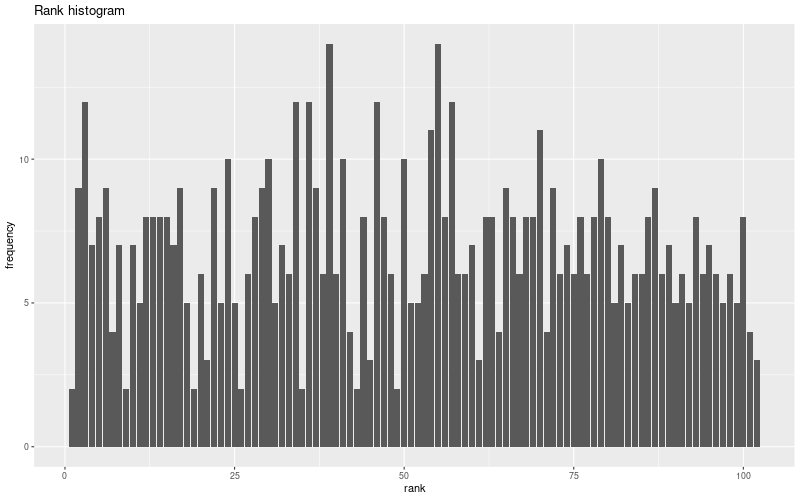
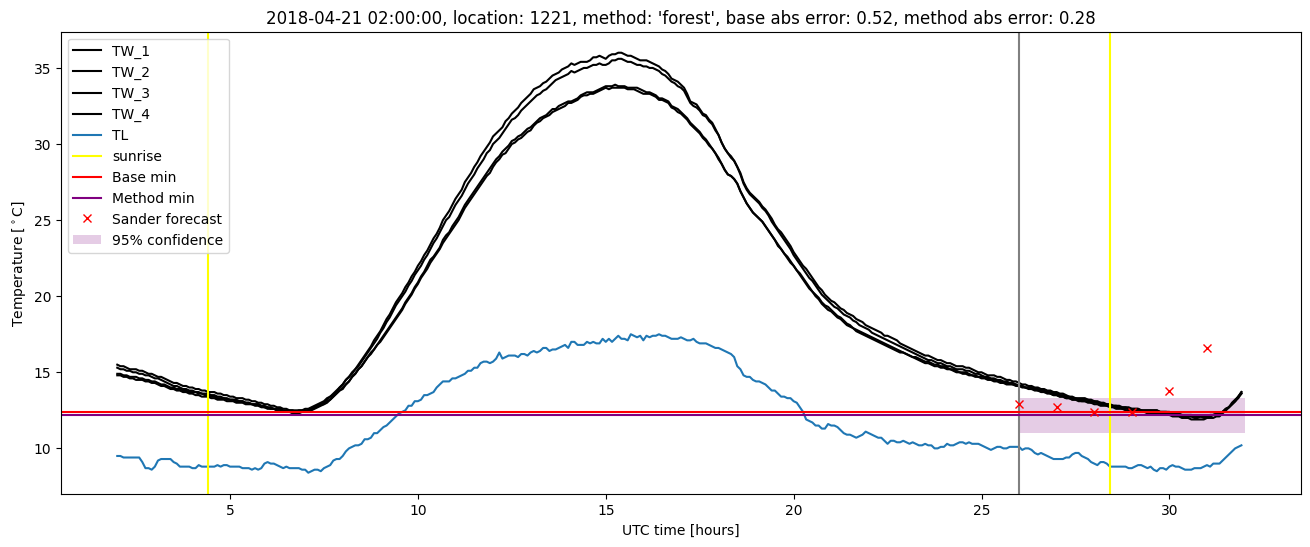
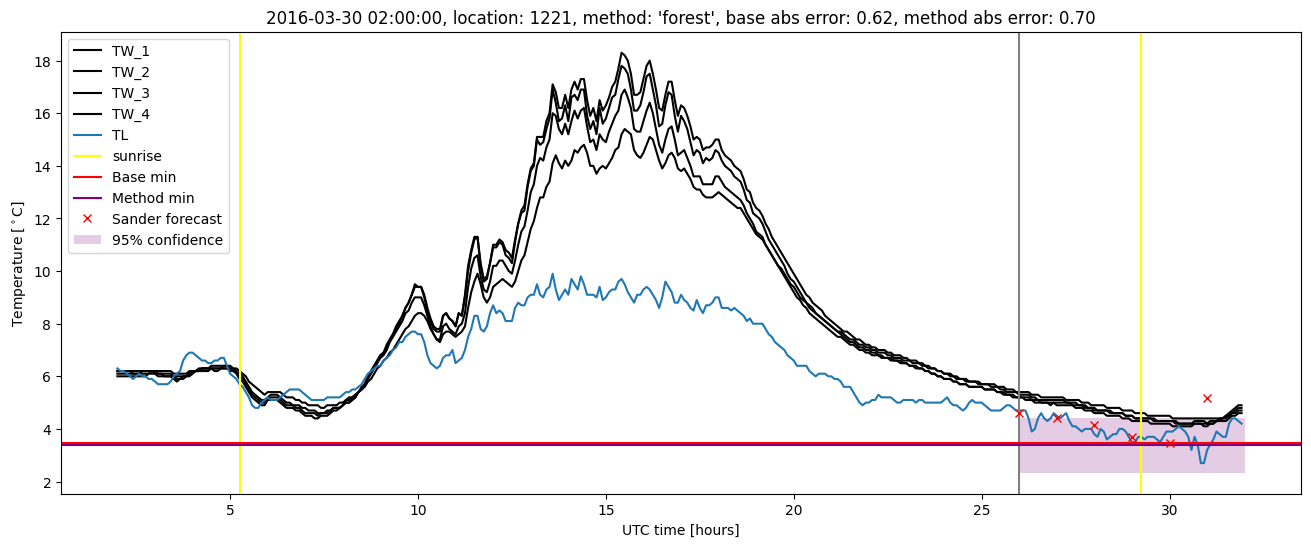
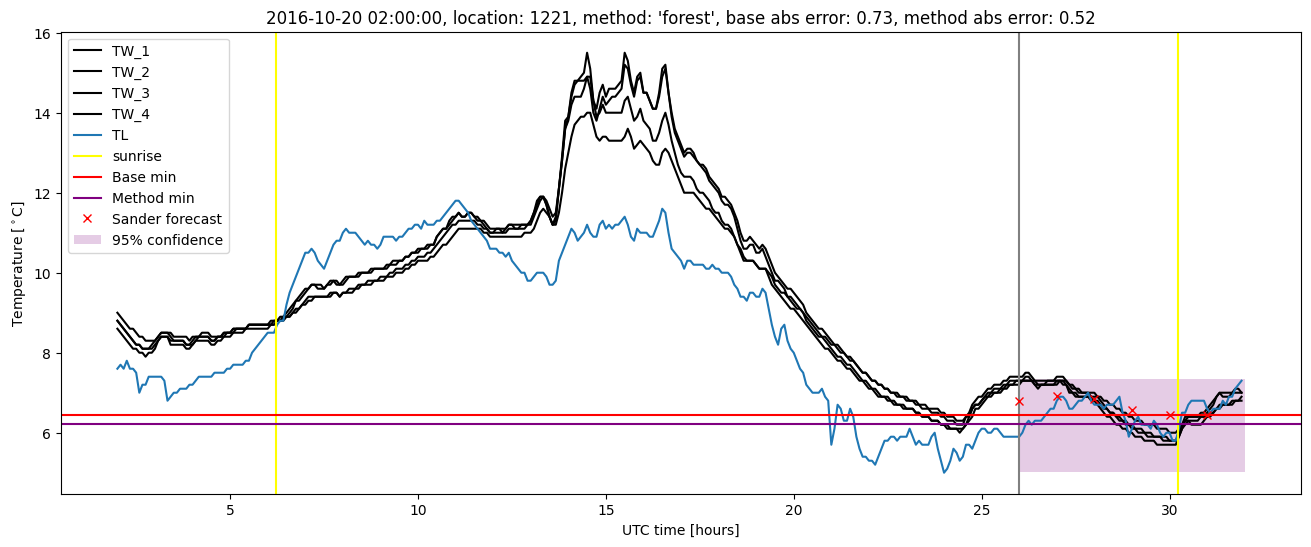
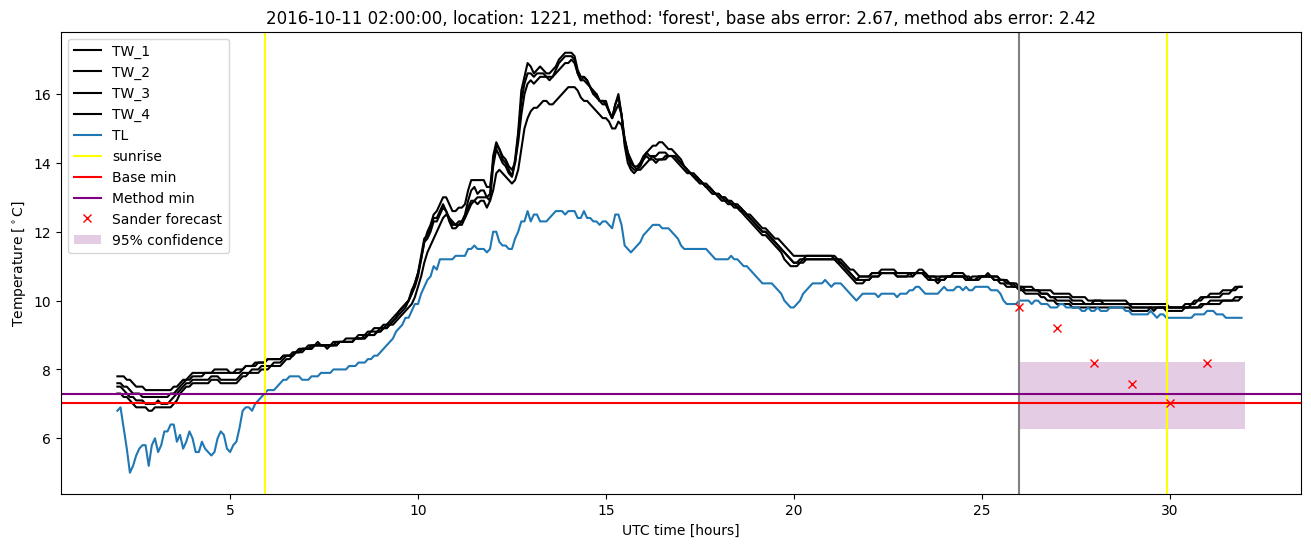
Random forest plots
Extended logistic regression results
| names |
period |
power |
significance |
meanSquareError |
absError |
maxError |
CRPS |
IGN |
| baseline |
winter 2016 |
0.975 |
0.091 |
0.335 |
0.441 |
1.944 |
NaN |
NaN |
| elr |
winter 2016 |
0.982 |
0.091 |
0.304 |
0.431 |
1.971 |
0.602 |
4.530 |
| baseline |
winter 2017 |
0.974 |
0.086 |
0.587 |
0.543 |
2.667 |
NaN |
NaN |
| elr |
winter 2017 |
0.983 |
0.086 |
0.537 |
0.535 |
2.540 |
0.573 |
5.343 |
| baseline |
winter 2018 |
0.986 |
0.108 |
0.432 |
0.470 |
2.379 |
NaN |
NaN |
| elr |
winter 2018 |
0.986 |
0.081 |
0.445 |
0.485 |
2.352 |
0.582 |
4.549 |
| baseline |
winter 2019 |
0.988 |
0.000e+00 |
0.303 |
0.403 |
1.786 |
NaN |
NaN |
| elr |
winter 2019 |
0.994 |
0.000e+00 |
0.343 |
0.442 |
2.417 |
0.551 |
3.557 |
| baseline |
all |
0.981 |
0.085 |
0.406 |
0.461 |
2.667 |
NaN |
NaN |
| elr |
all |
0.986 |
0.076 |
0.401 |
0.470 |
2.540 |
0.578 |
4.470 |
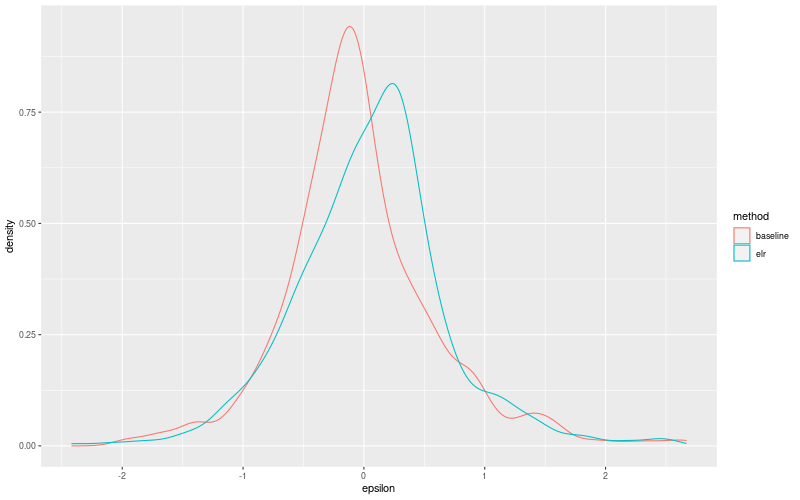
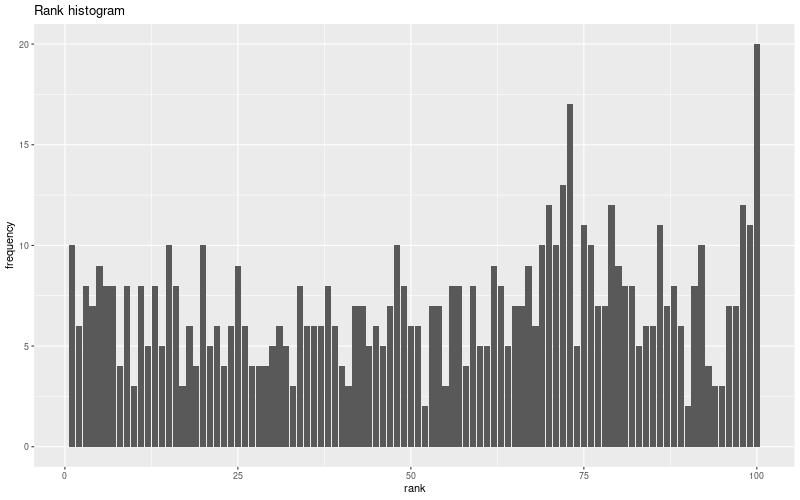
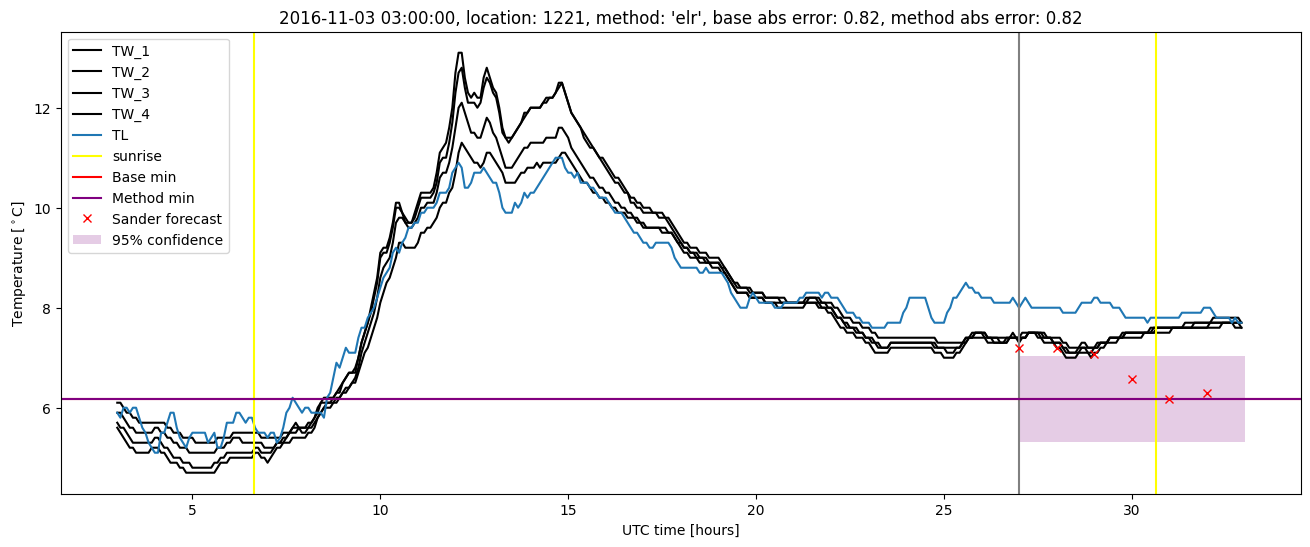
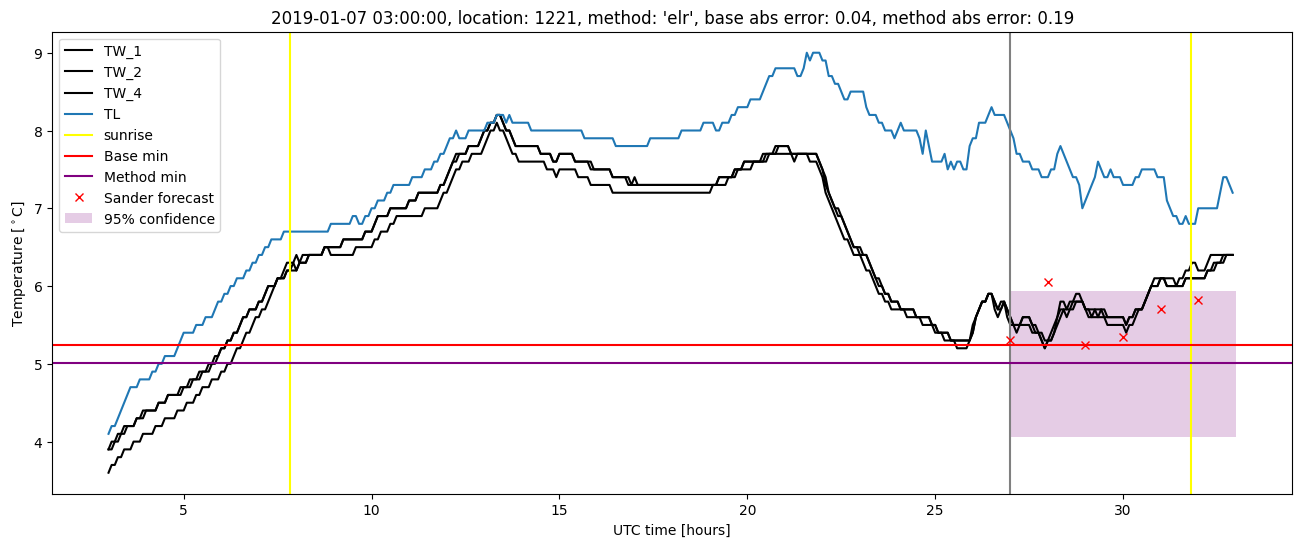
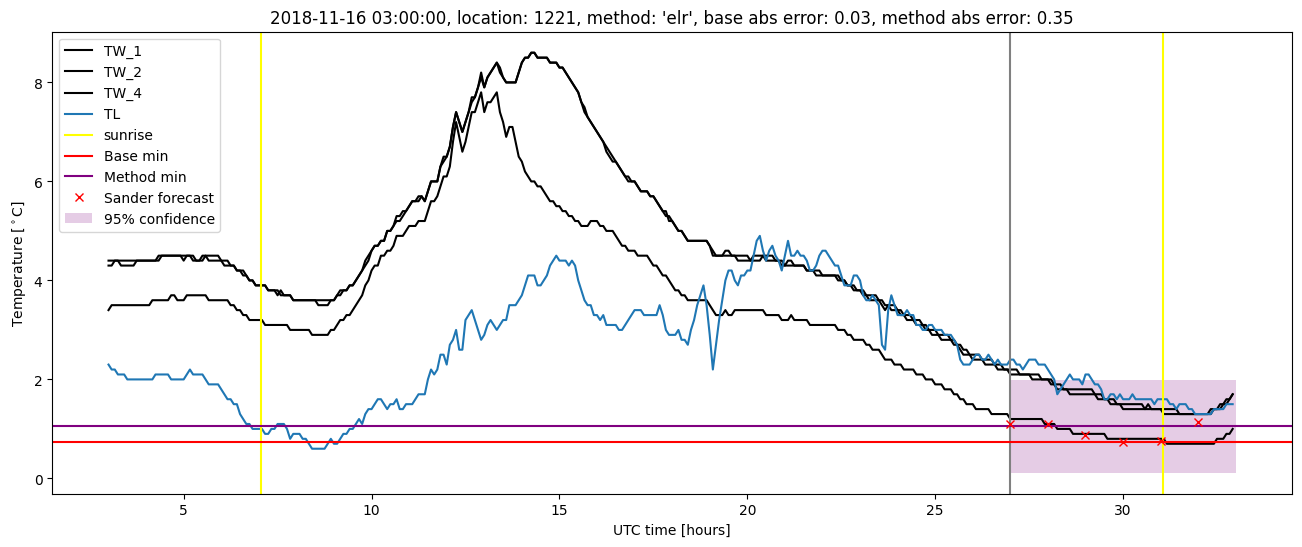
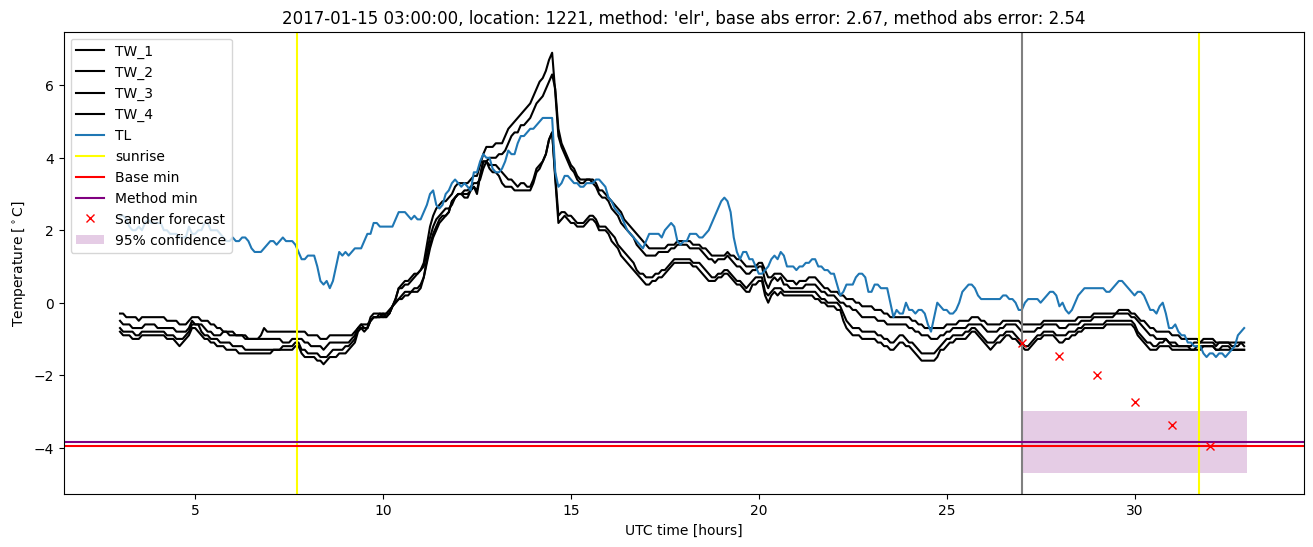
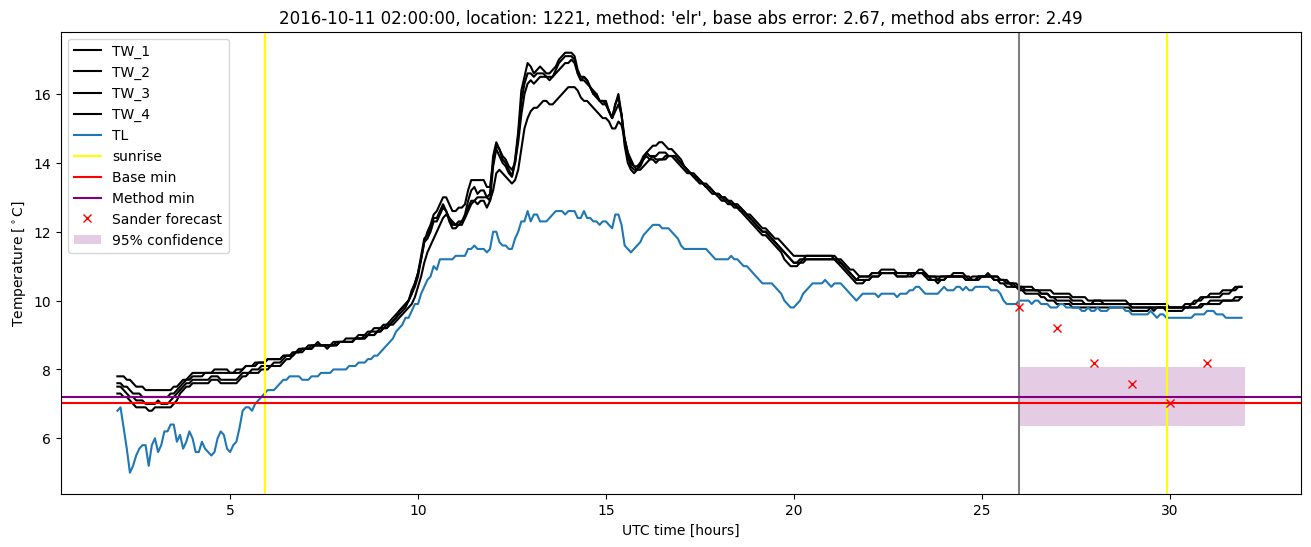
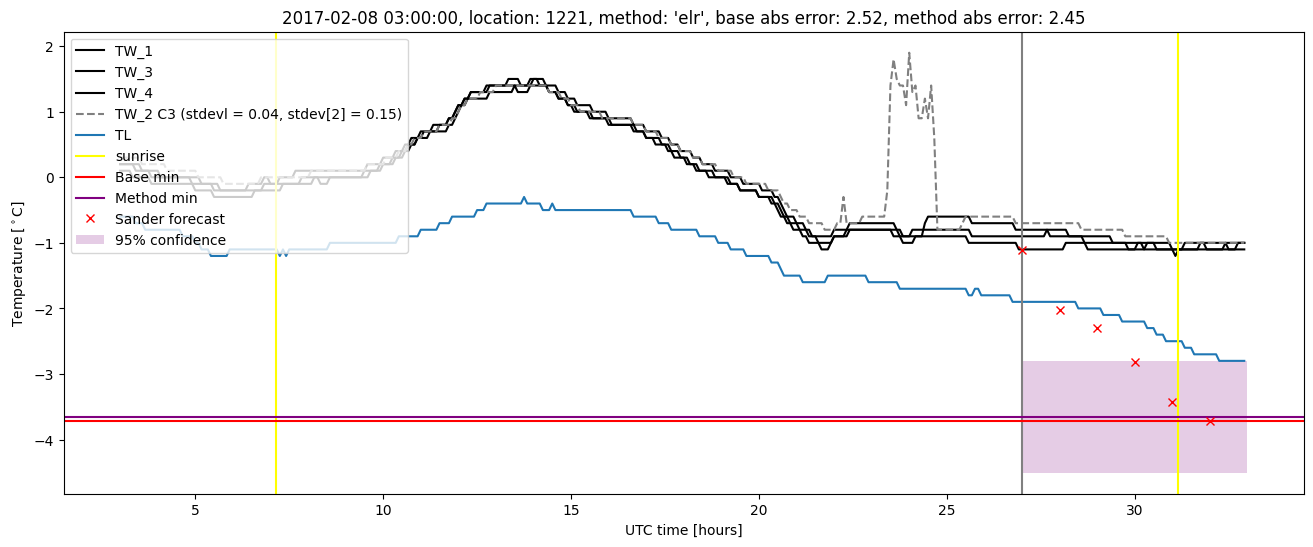
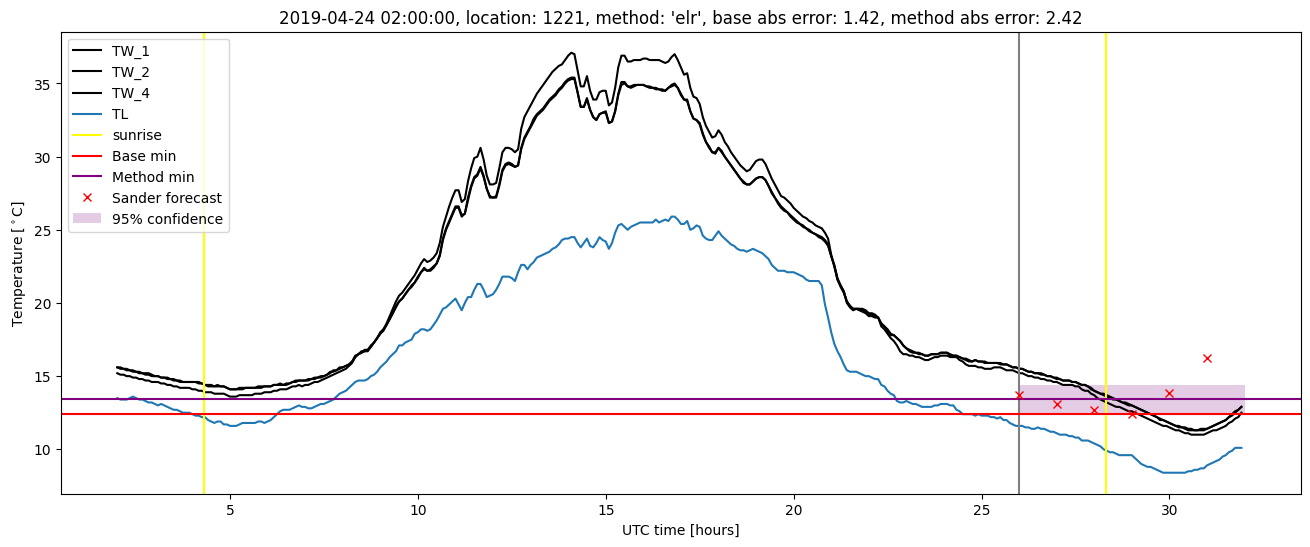
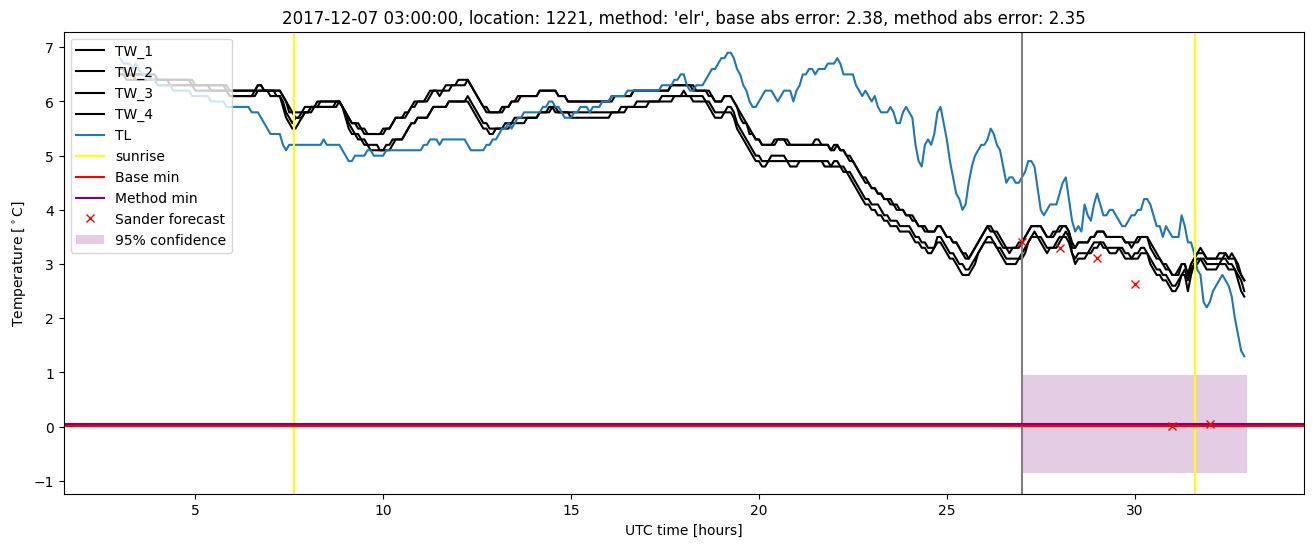
Extended logistic regression plots