GMS location: 1217
Random forest results
| names |
period |
power |
significance |
meanSquareError |
absError |
maxError |
CRPS |
IGN |
| baseline |
winter 2016 |
0.987 |
0.065 |
0.389 |
0.464 |
2.414 |
NaN |
NaN |
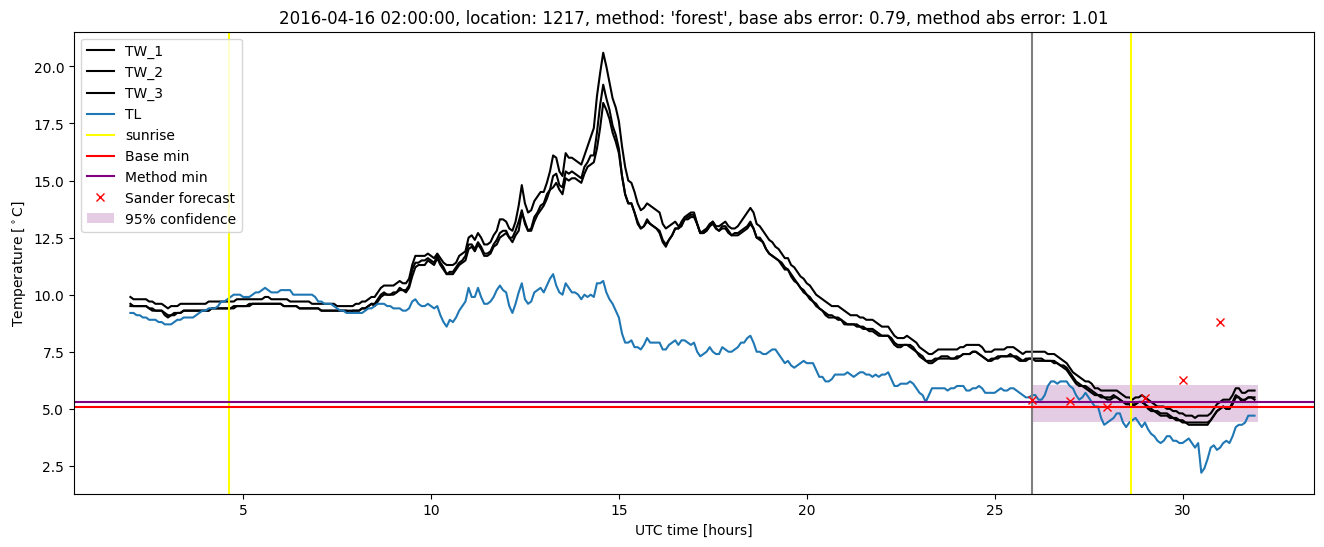
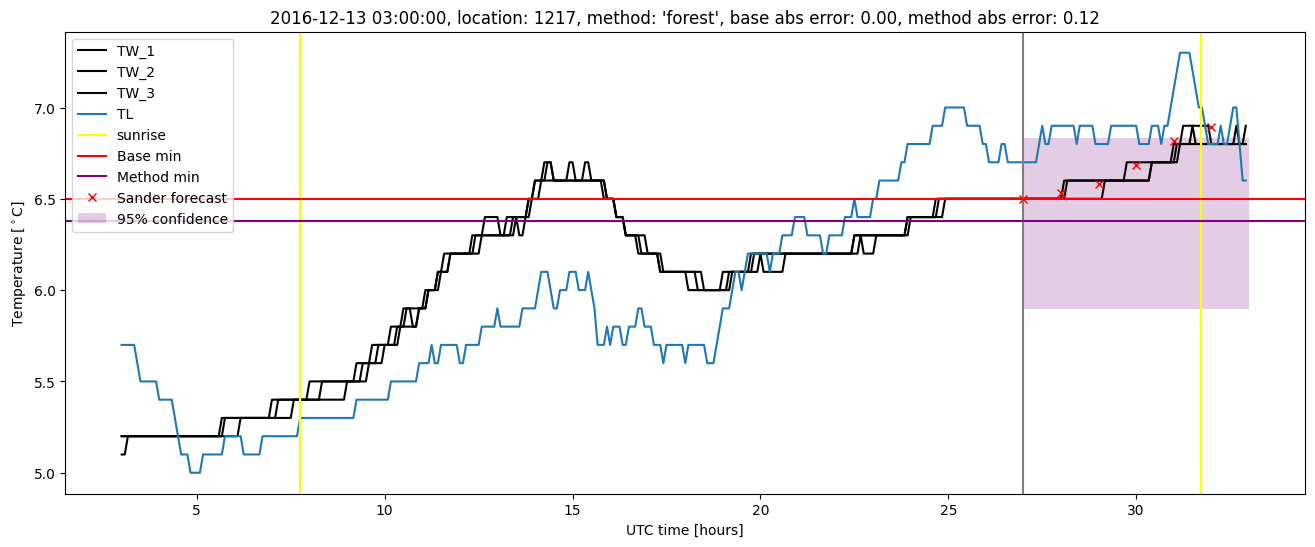
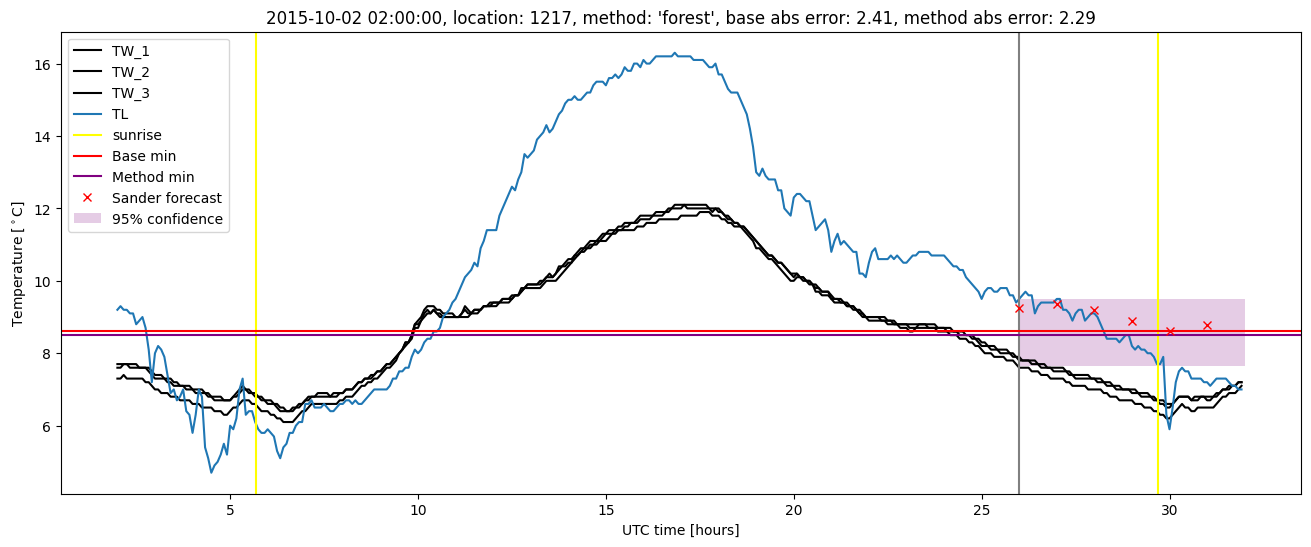
| forest |
winter 2016 |
0.987 |
0.129 |
0.308 |
0.419 |
2.292 |
0.482 |
3.763 |
| baseline |
winter 2017 |
0.974 |
0.000e+00 |
0.476 |
0.488 |
2.377 |
NaN |
NaN |
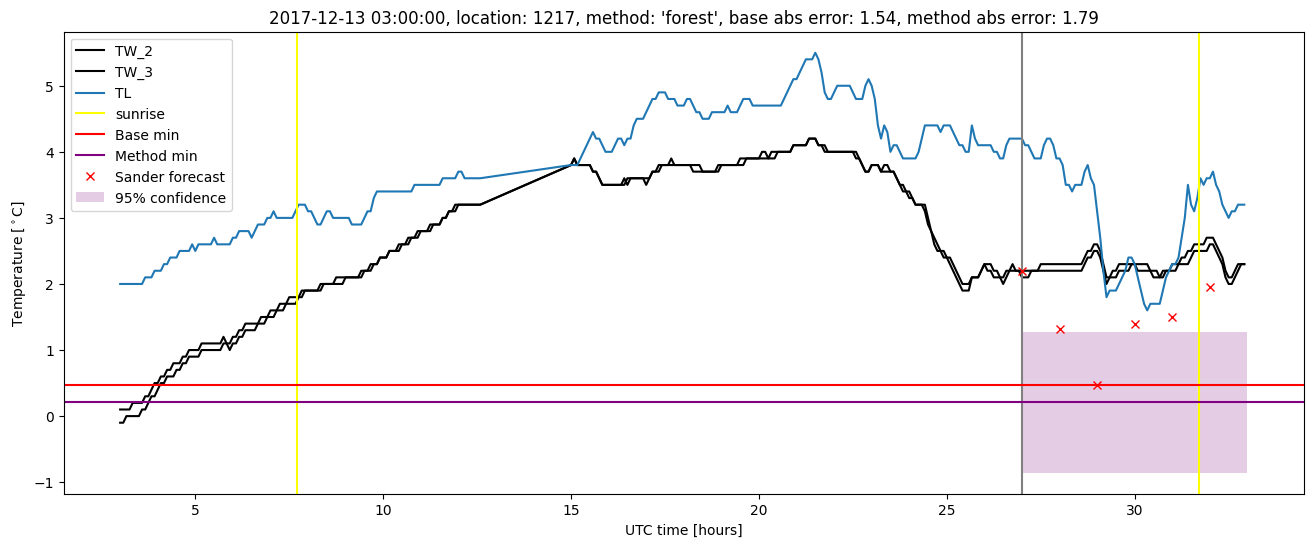
| forest |
winter 2017 |
0.991 |
0.000e+00 |
0.338 |
0.416 |
1.785 |
0.473 |
3.739 |
| baseline |
winter 2018 |
0.993 |
0.086 |
0.368 |
0.464 |
2.320 |
NaN |
NaN |
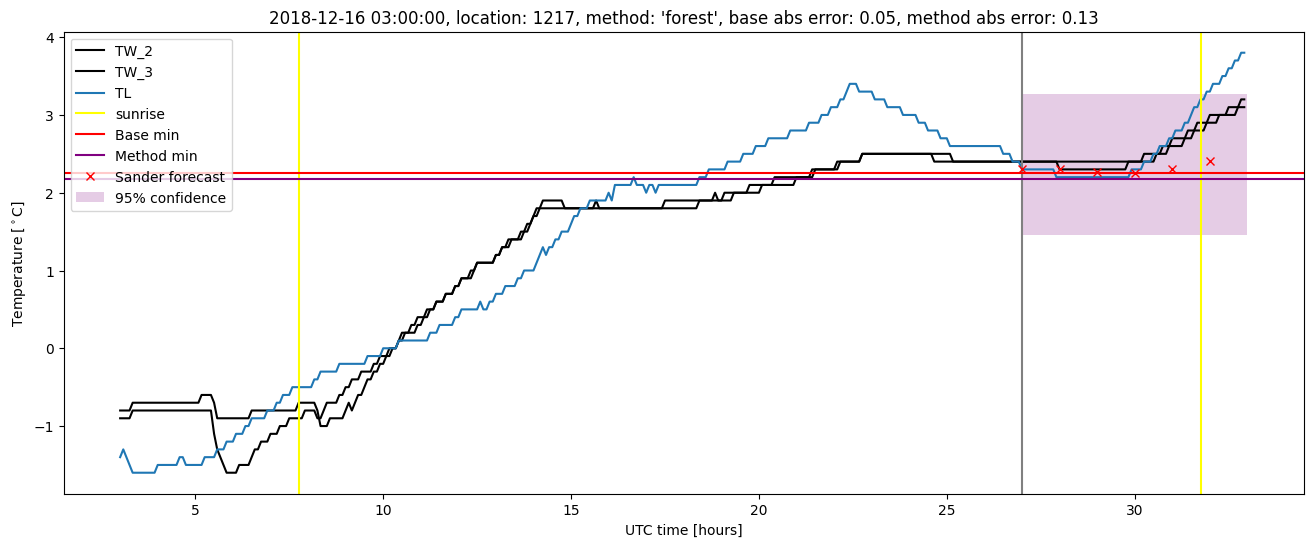
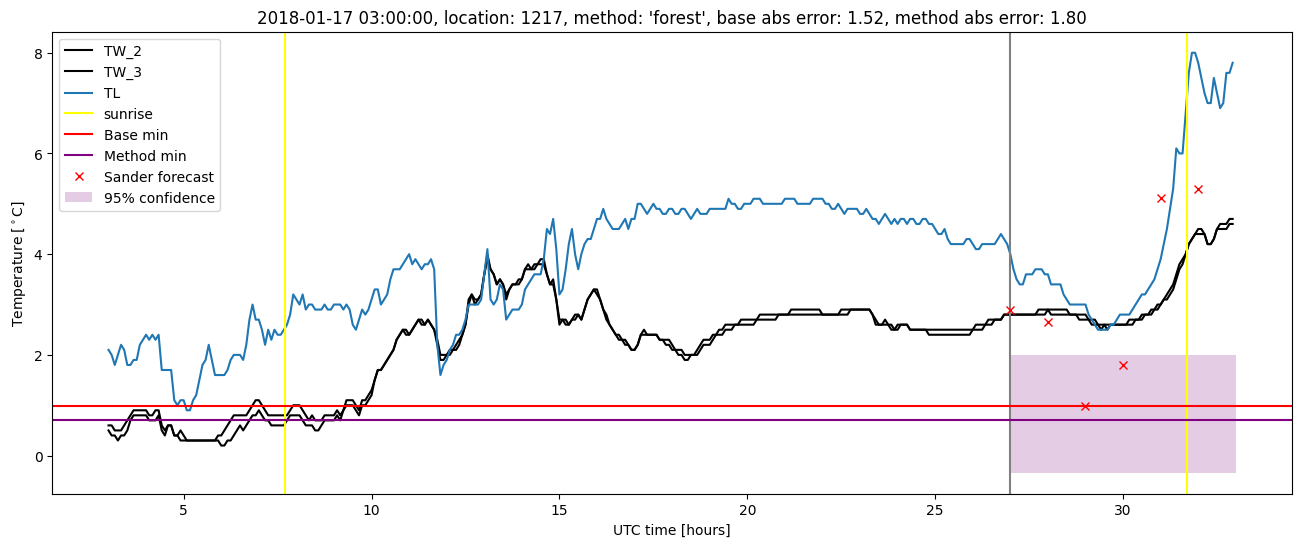
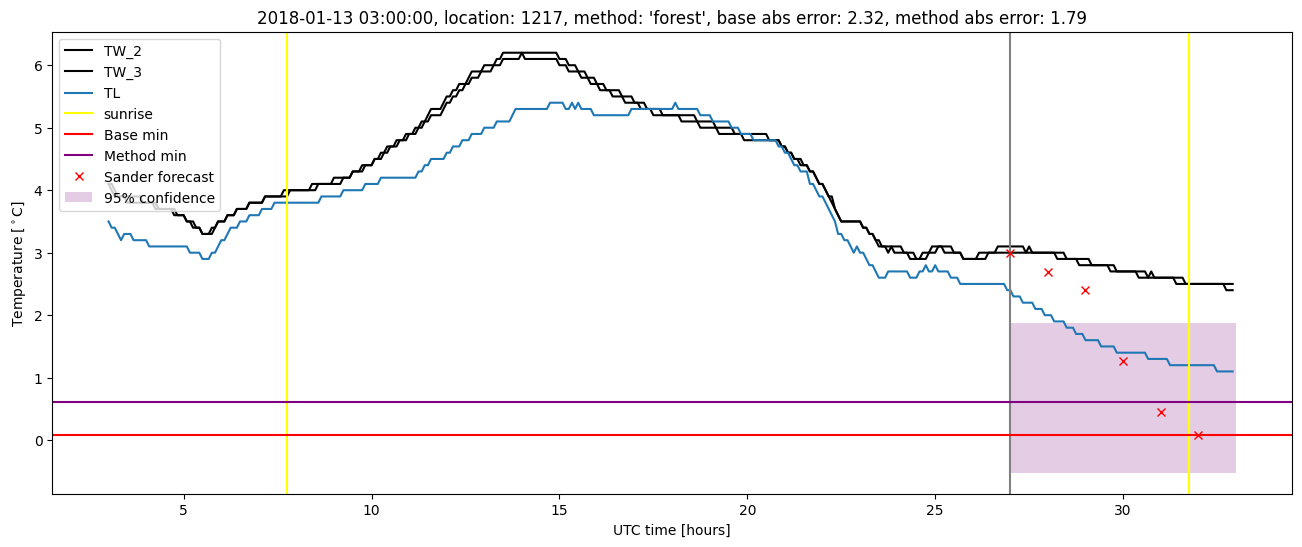
| forest |
winter 2018 |
0.986 |
0.029 |
0.328 |
0.429 |
1.799 |
0.490 |
2.683 |
| baseline |
winter 2019 |
1.000 |
0.071 |
0.350 |
0.413 |
2.722 |
NaN |
NaN |
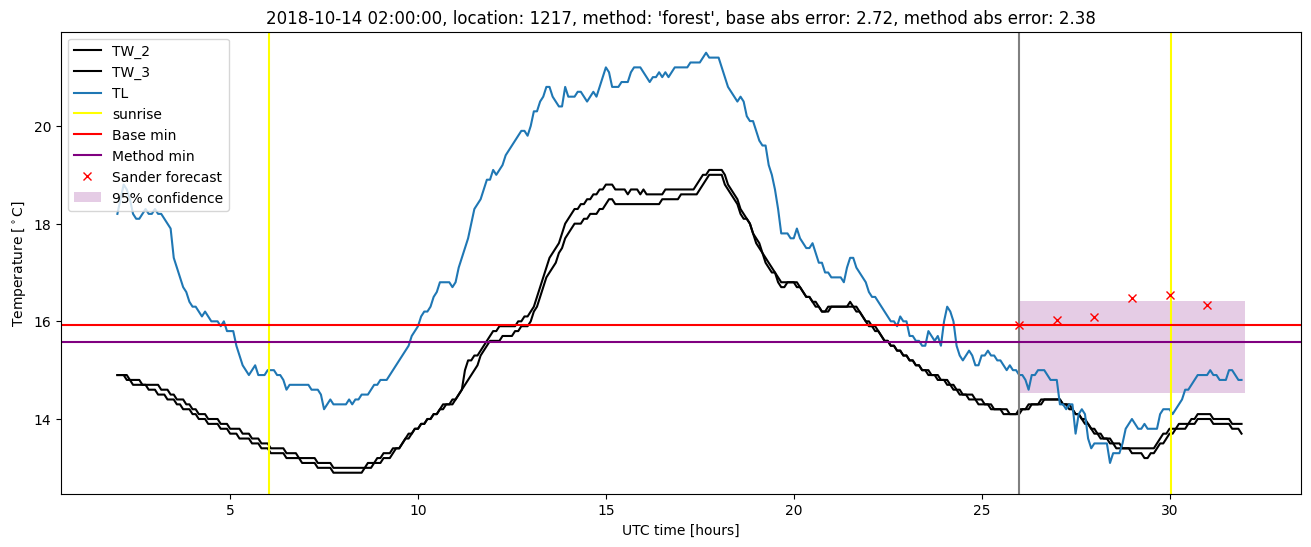
| forest |
winter 2019 |
1.000 |
0.071 |
0.252 |
0.352 |
2.380 |
0.470 |
2.553 |
| baseline |
all |
0.989 |
0.053 |
0.393 |
0.458 |
2.722 |
NaN |
NaN |
| forest |
all |
0.991 |
0.053 |
0.307 |
0.406 |
2.380 |
0.479 |
3.183 |
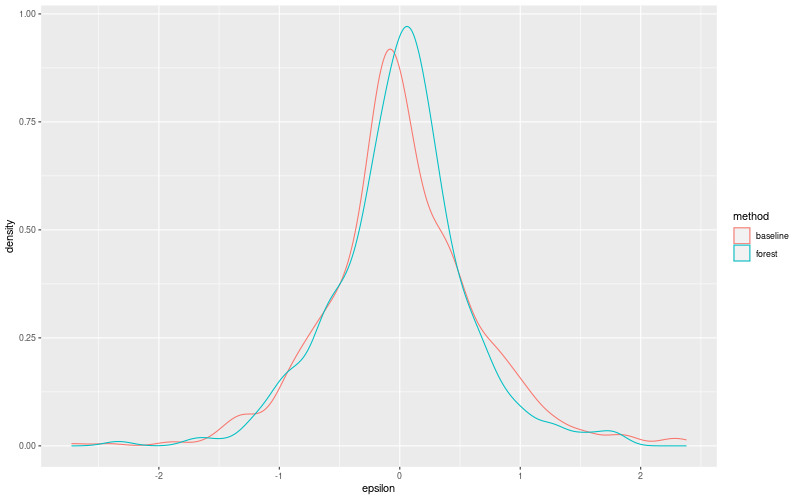
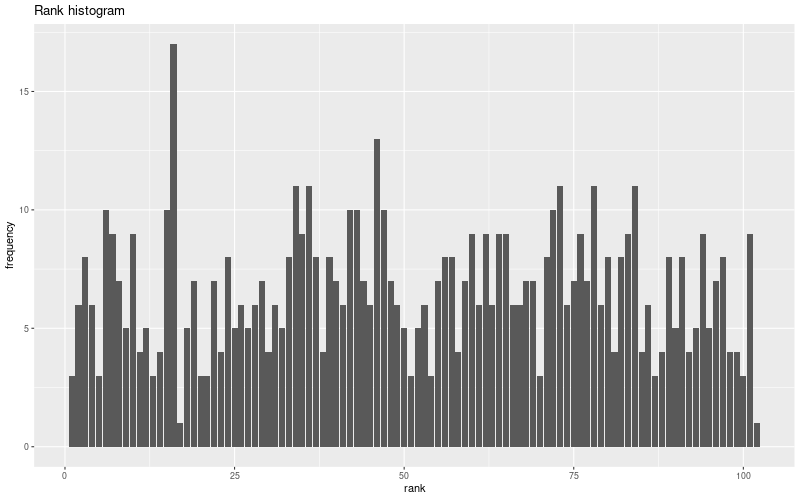
Random forest plots
Extended logistic regression results
| names |
period |
power |
significance |
meanSquareError |
absError |
maxError |
CRPS |
IGN |
| baseline |
winter 2016 |
0.987 |
0.065 |
0.389 |
0.464 |
2.414 |
NaN |
NaN |
| elr |
winter 2016 |
0.987 |
0.161 |
0.319 |
0.442 |
2.204 |
0.546 |
4.188 |
| baseline |
winter 2017 |
0.974 |
0.000e+00 |
0.476 |
0.488 |
2.377 |
NaN |
NaN |
| elr |
winter 2017 |
0.991 |
0.000e+00 |
0.383 |
0.461 |
1.895 |
0.542 |
4.477 |
| baseline |
winter 2018 |
0.993 |
0.086 |
0.368 |
0.464 |
2.320 |
NaN |
NaN |
| elr |
winter 2018 |
0.986 |
0.029 |
0.355 |
0.463 |
2.086 |
0.555 |
4.276 |
| baseline |
winter 2019 |
1.000 |
0.071 |
0.350 |
0.413 |
2.722 |
NaN |
NaN |
| elr |
winter 2019 |
1.000 |
0.071 |
0.307 |
0.414 |
2.543 |
0.535 |
3.912 |
| baseline |
all |
0.989 |
0.053 |
0.393 |
0.458 |
2.722 |
NaN |
NaN |
| elr |
all |
0.991 |
0.061 |
0.340 |
0.445 |
2.543 |
0.545 |
4.210 |
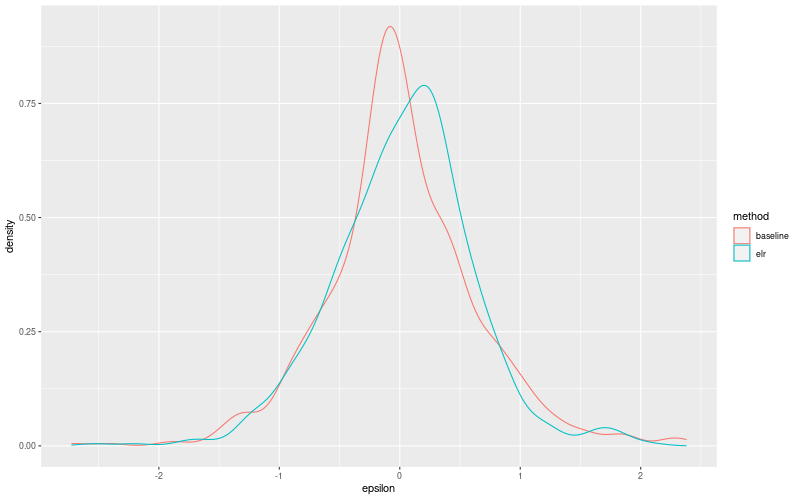
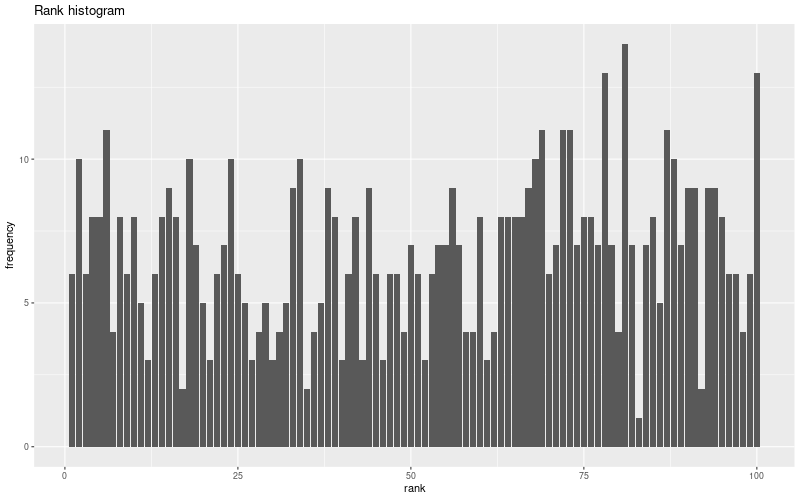
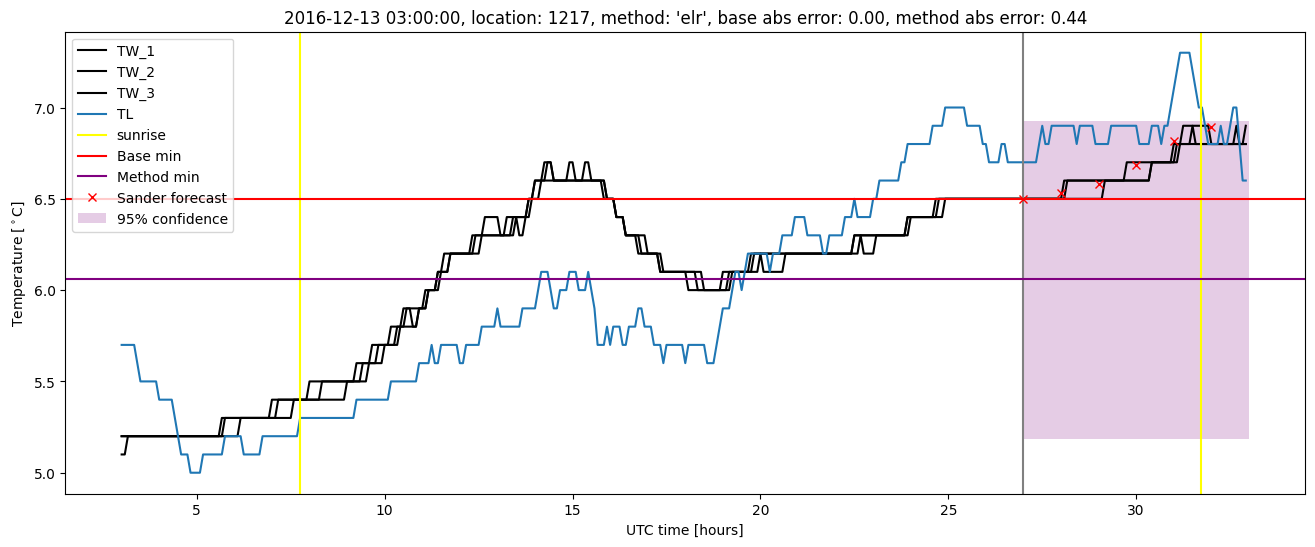
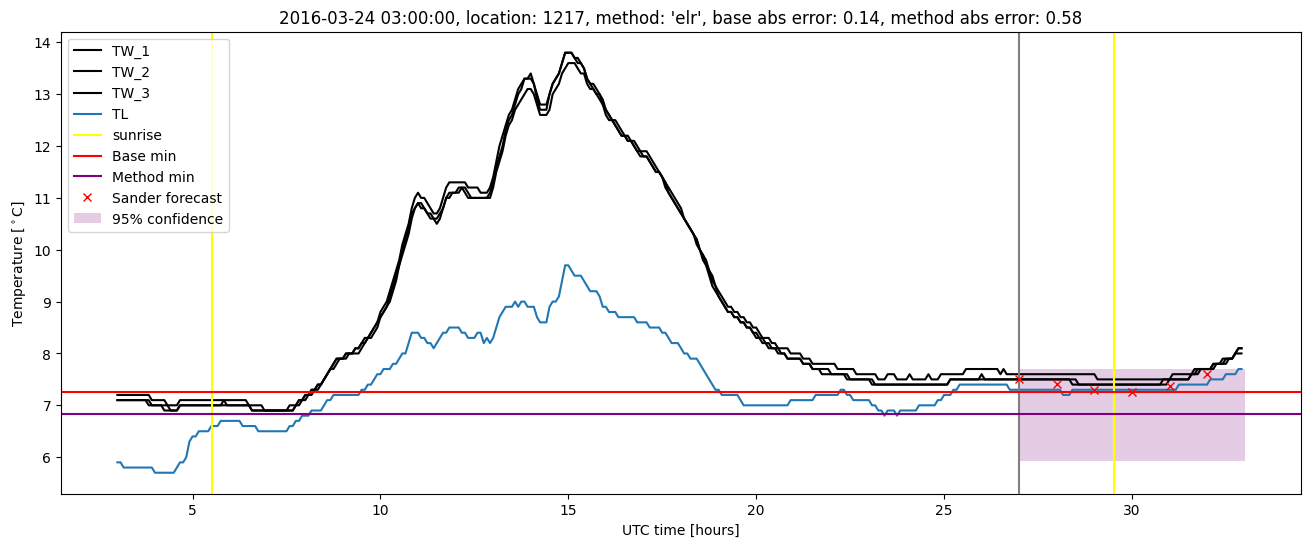
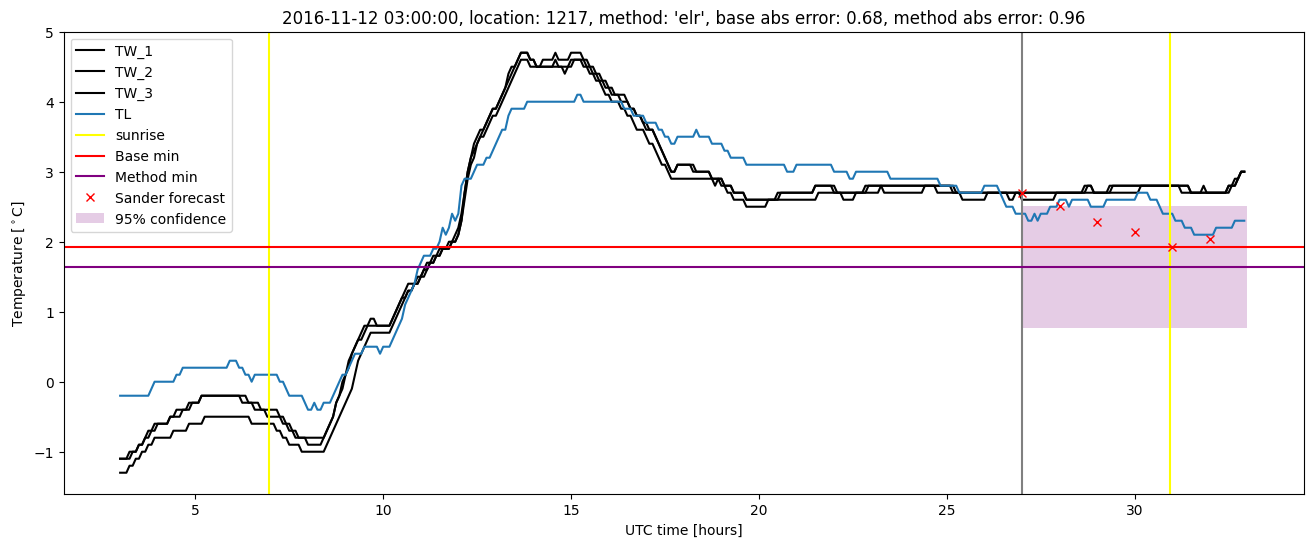
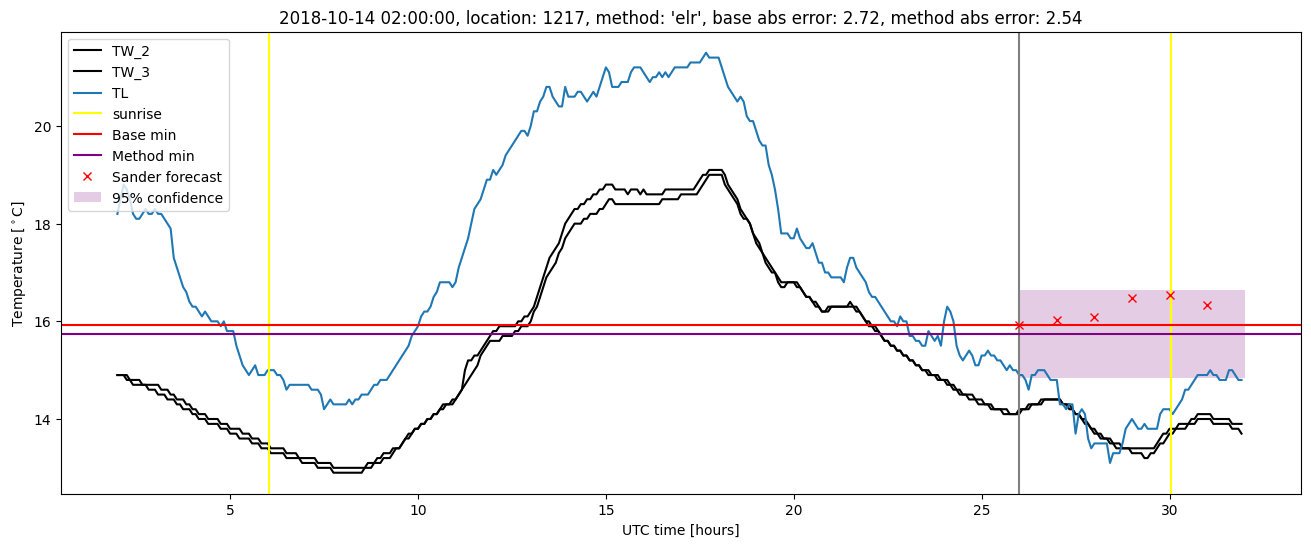
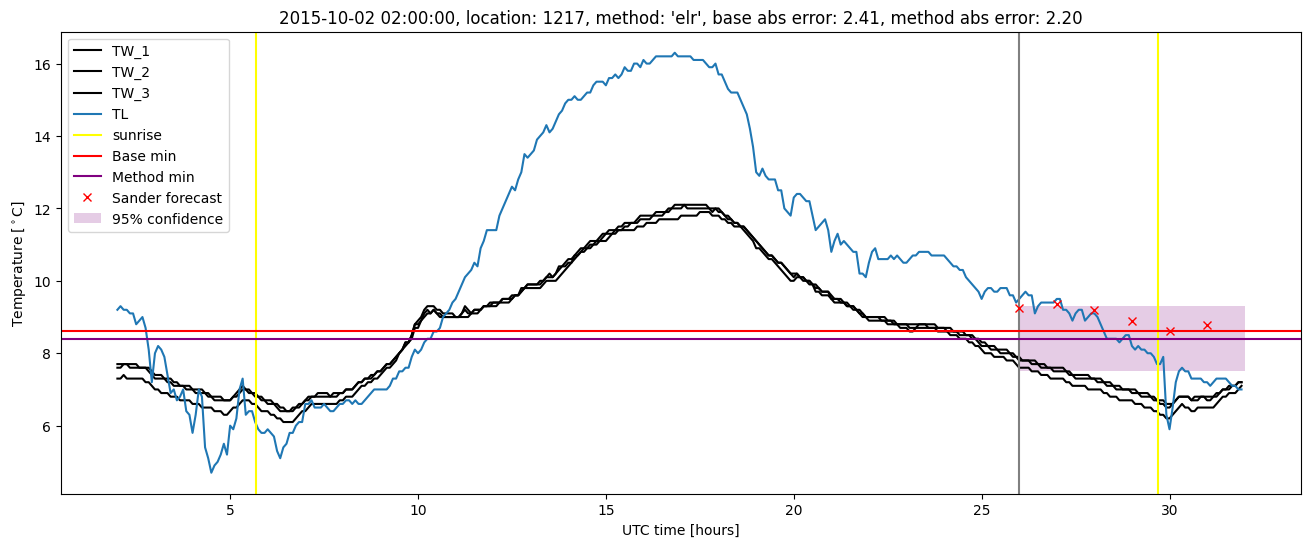
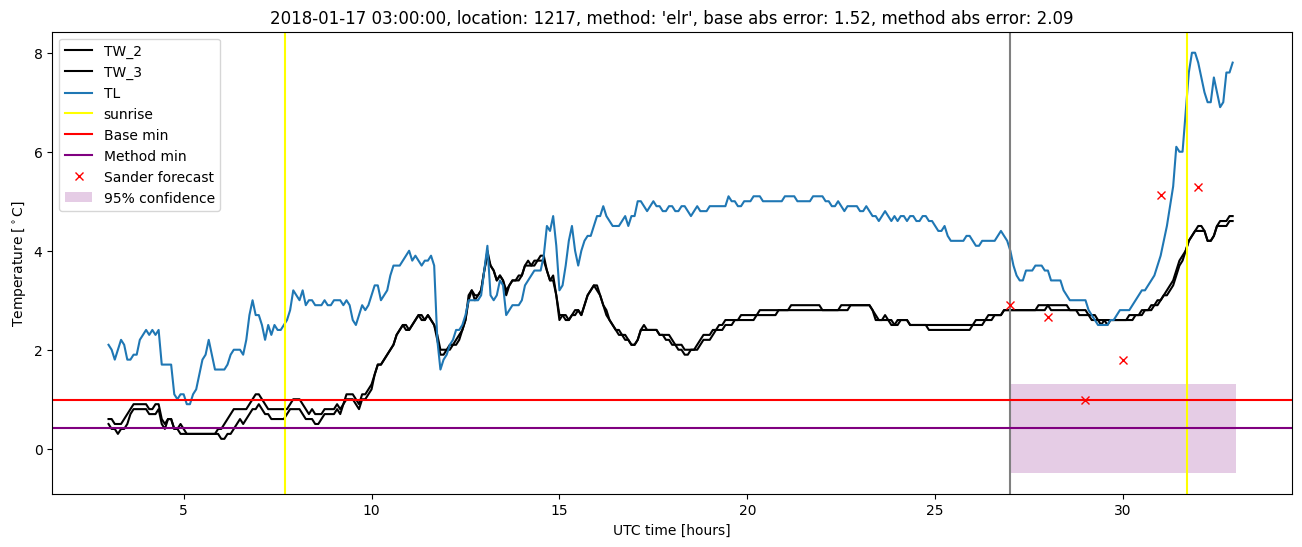
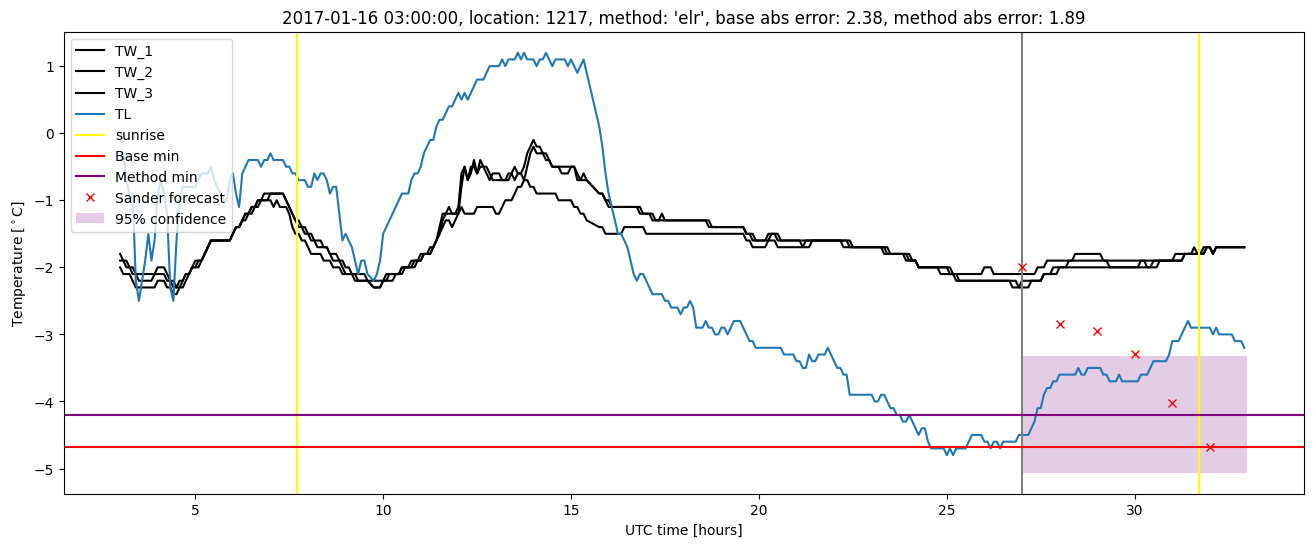
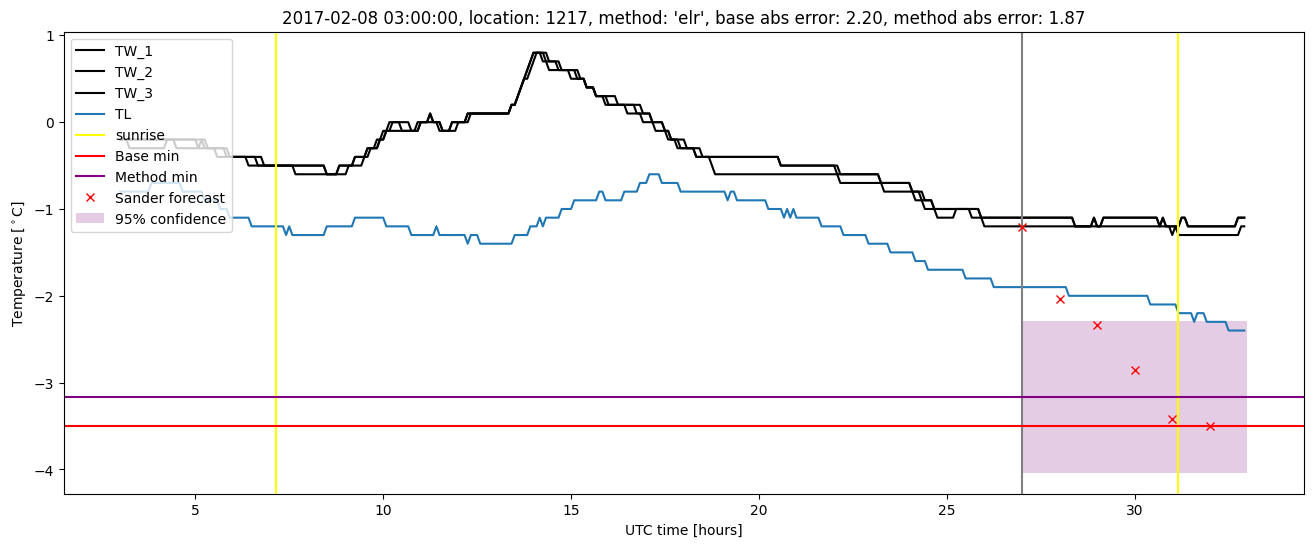
Extended logistic regression plots