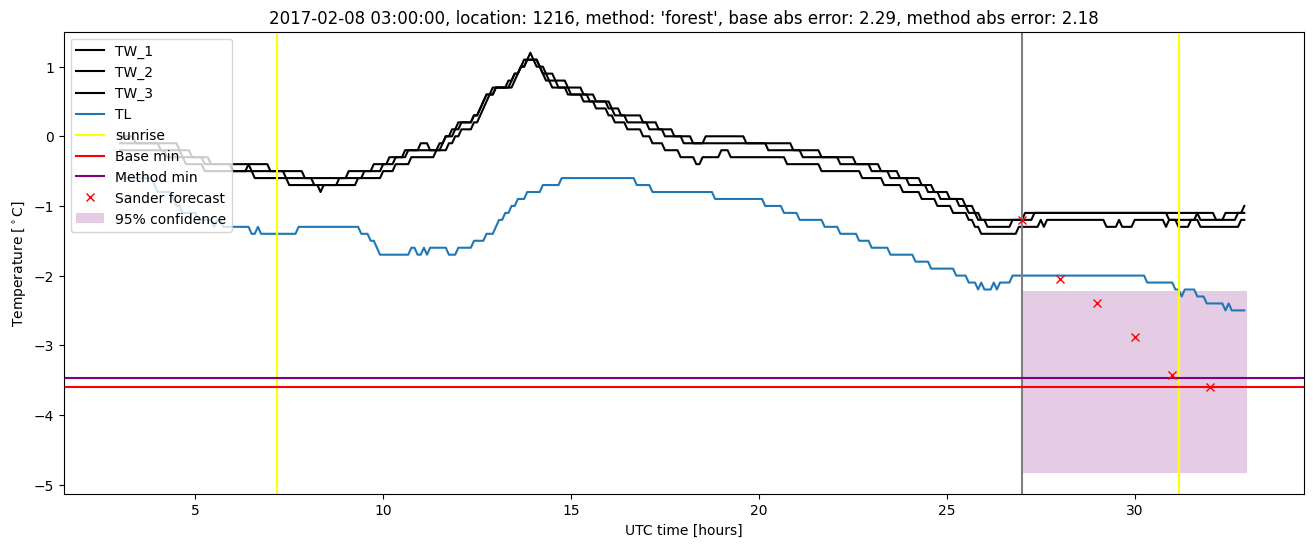
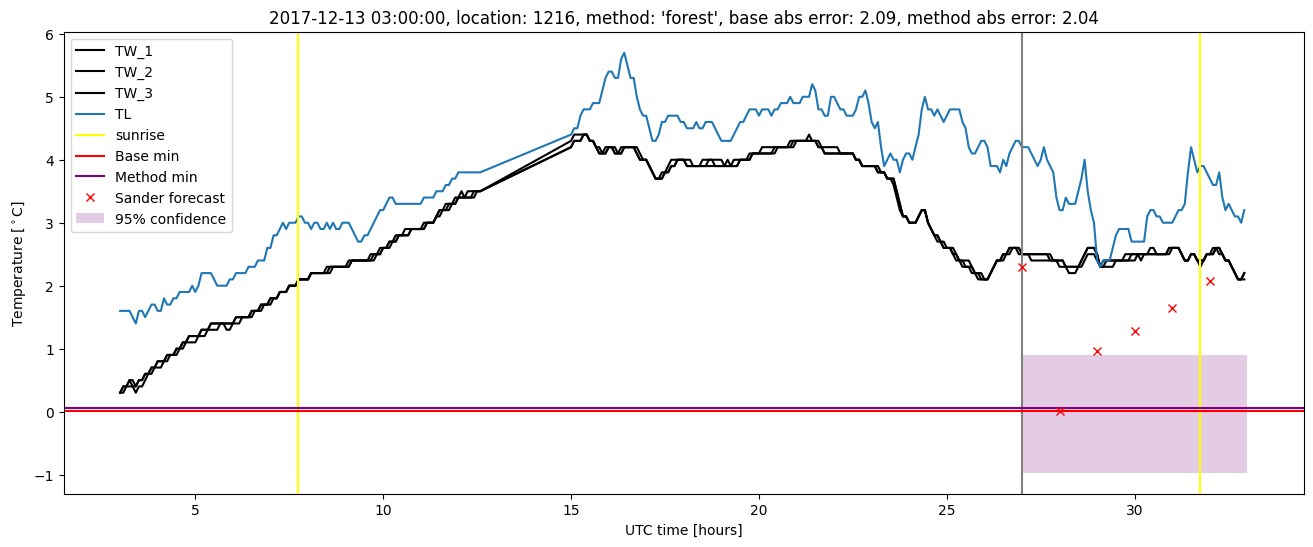
GMS location: 1216
Random forest results
| names |
period |
power |
significance |
meanSquareError |
absError |
maxError |
CRPS |
IGN |
| baseline |
winter 2016 |
0.988 |
0.083 |
0.332 |
0.428 |
2.125 |
NaN |
NaN |
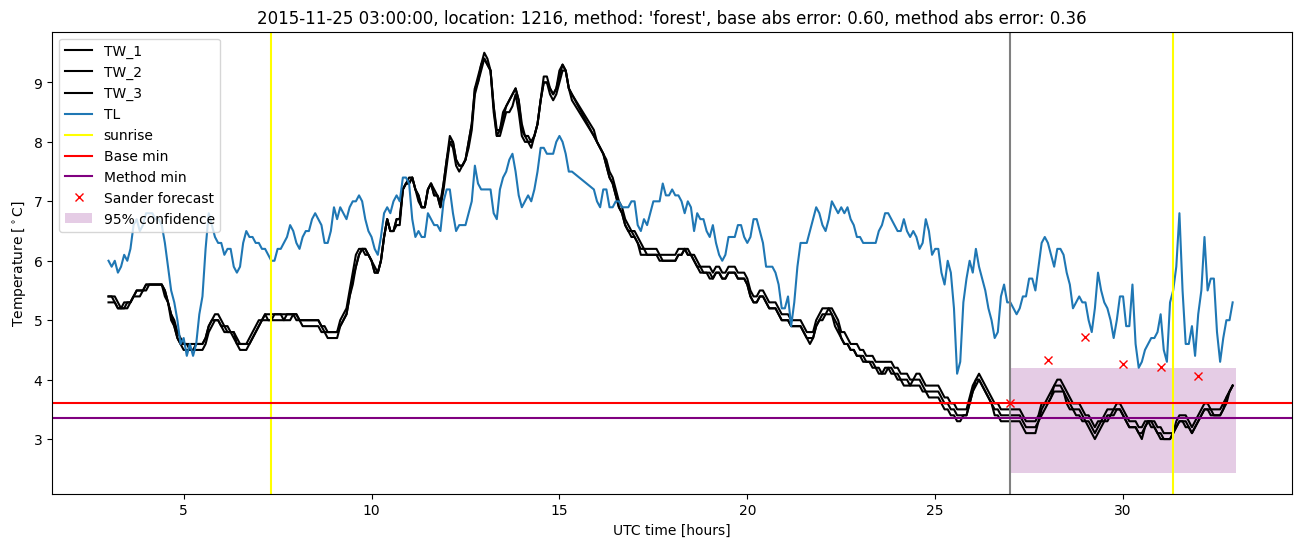
| forest |
winter 2016 |
0.994 |
0.042 |
0.260 |
0.383 |
1.742 |
0.566 |
3.253 |
| baseline |
winter 2017 |
0.992 |
0.057 |
0.604 |
0.555 |
2.304 |
NaN |
NaN |
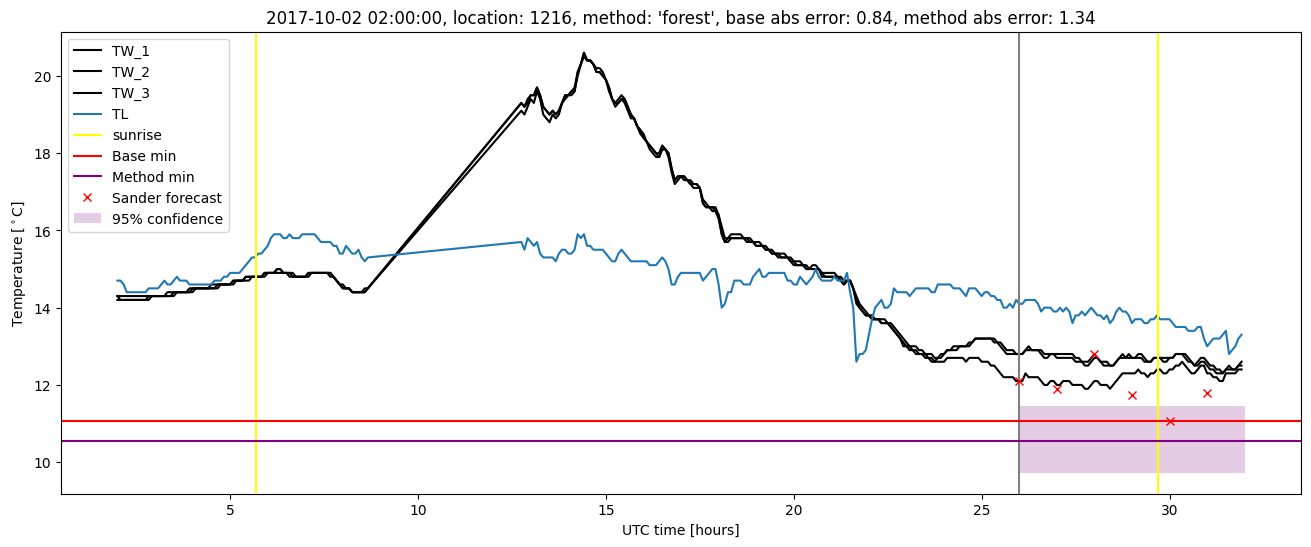
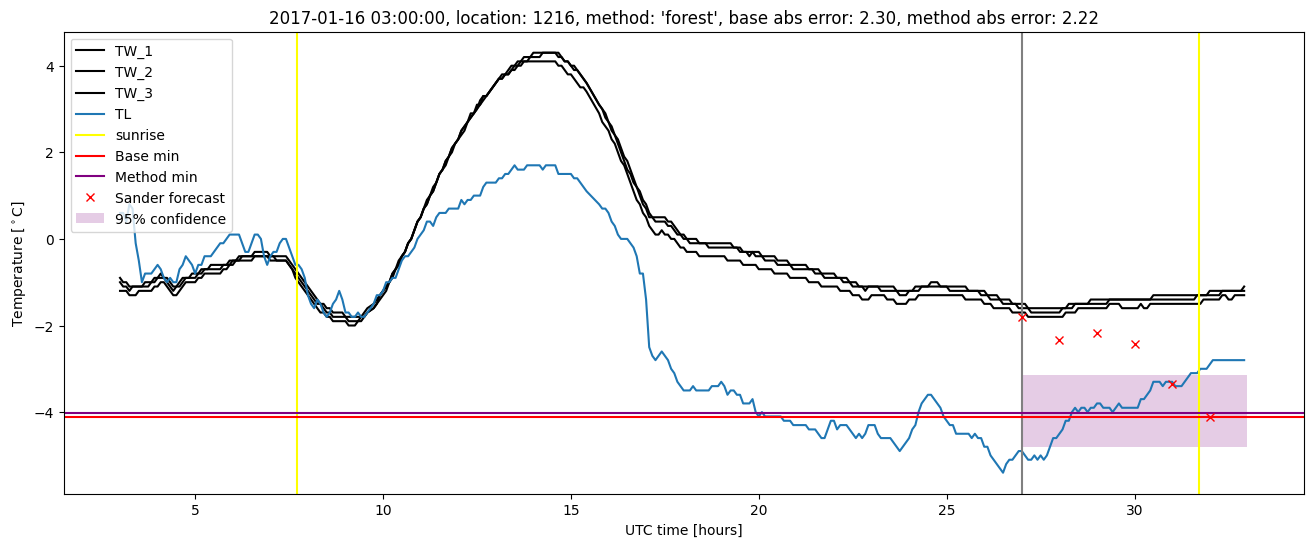
| forest |
winter 2017 |
0.992 |
0.000e+00 |
0.497 |
0.490 |
2.233 |
0.551 |
4.480 |
| baseline |
winter 2018 |
0.973 |
0.143 |
0.398 |
0.434 |
2.915 |
NaN |
NaN |
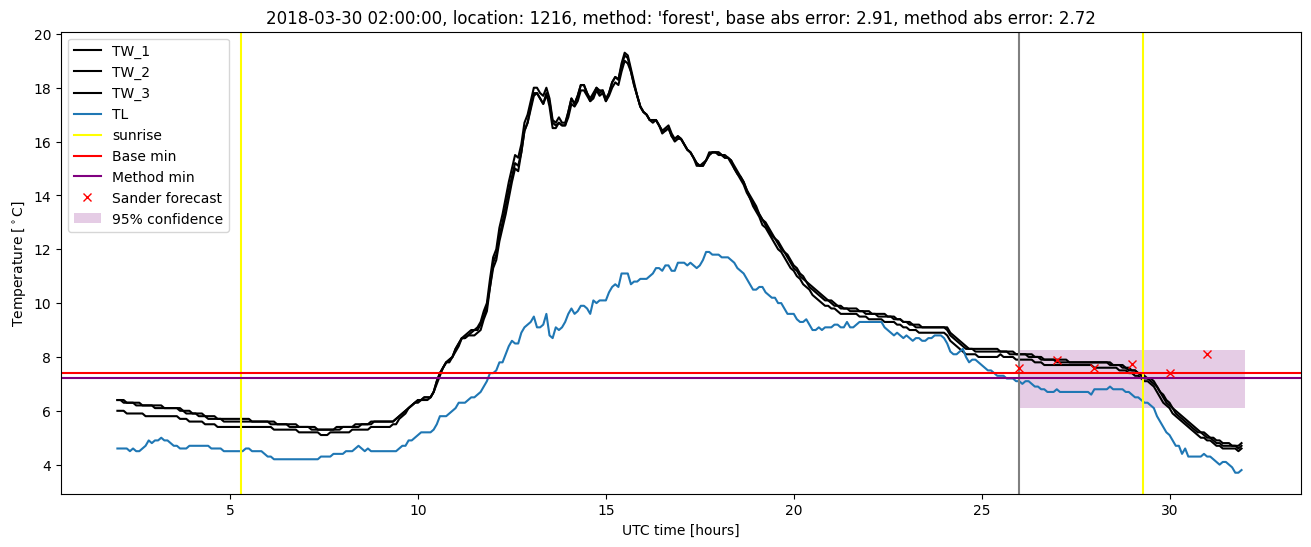
| forest |
winter 2018 |
0.980 |
0.071 |
0.383 |
0.437 |
2.720 |
0.579 |
3.449 |
| baseline |
winter 2019 |
1.000 |
0.071 |
0.261 |
0.390 |
1.596 |
NaN |
NaN |
| forest |
winter 2019 |
1.000 |
0.071 |
0.213 |
0.351 |
1.627 |
0.557 |
2.835 |
| baseline |
all |
0.988 |
0.089 |
0.392 |
0.449 |
2.915 |
NaN |
NaN |
| forest |
all |
0.992 |
0.040 |
0.333 |
0.413 |
2.720 |
0.564 |
3.475 |
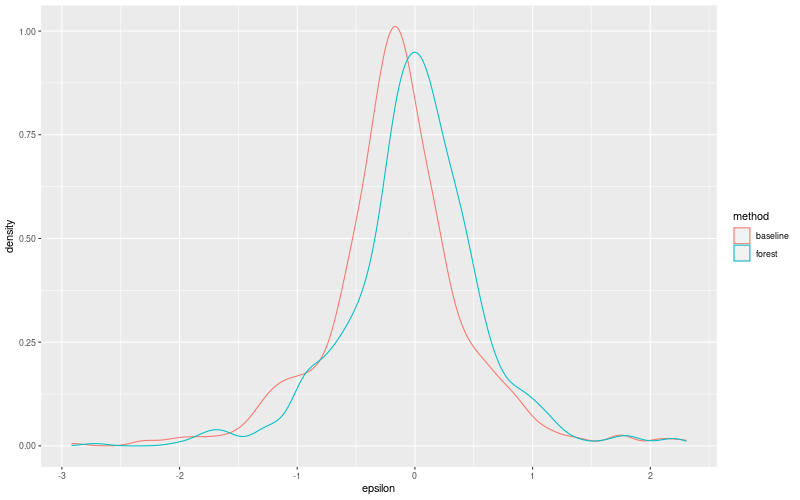
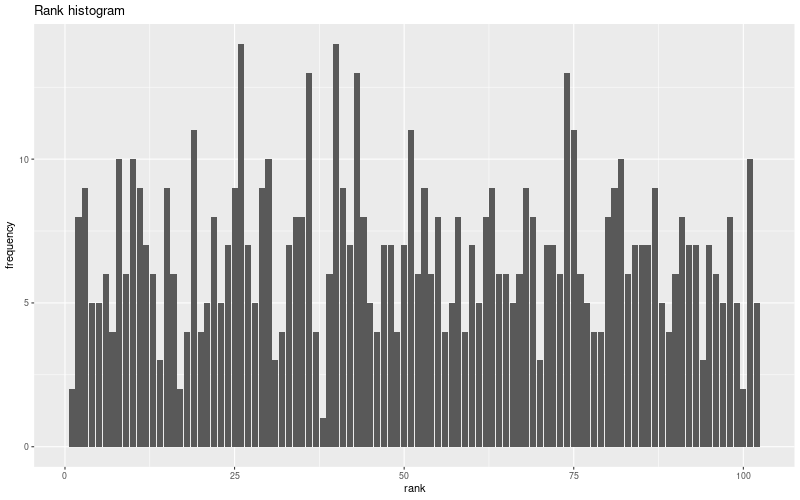
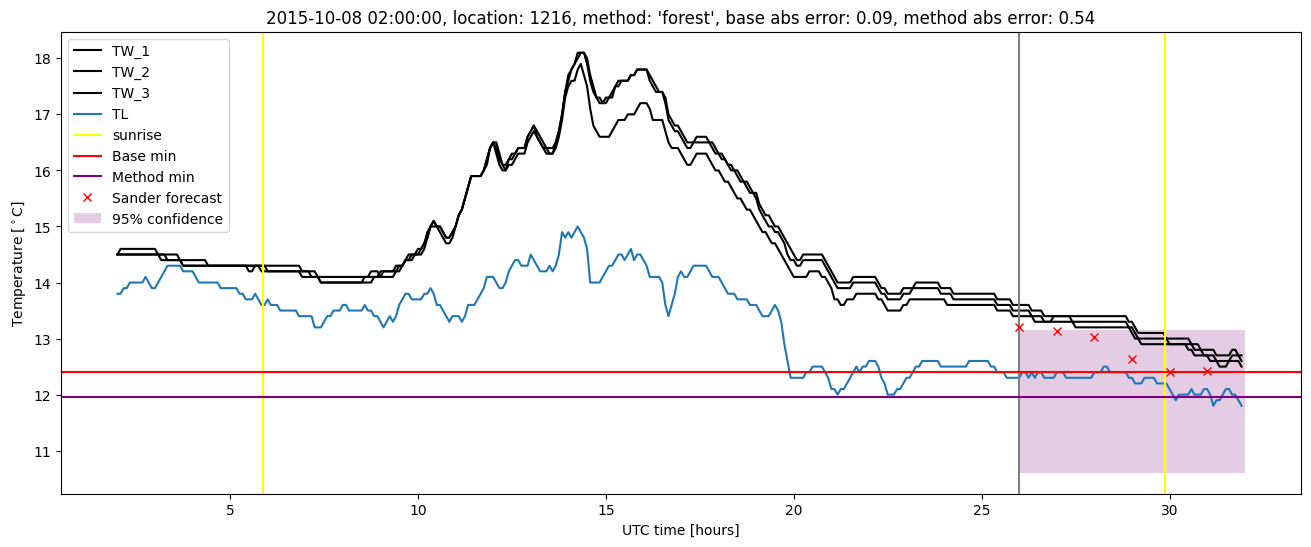
Random forest plots

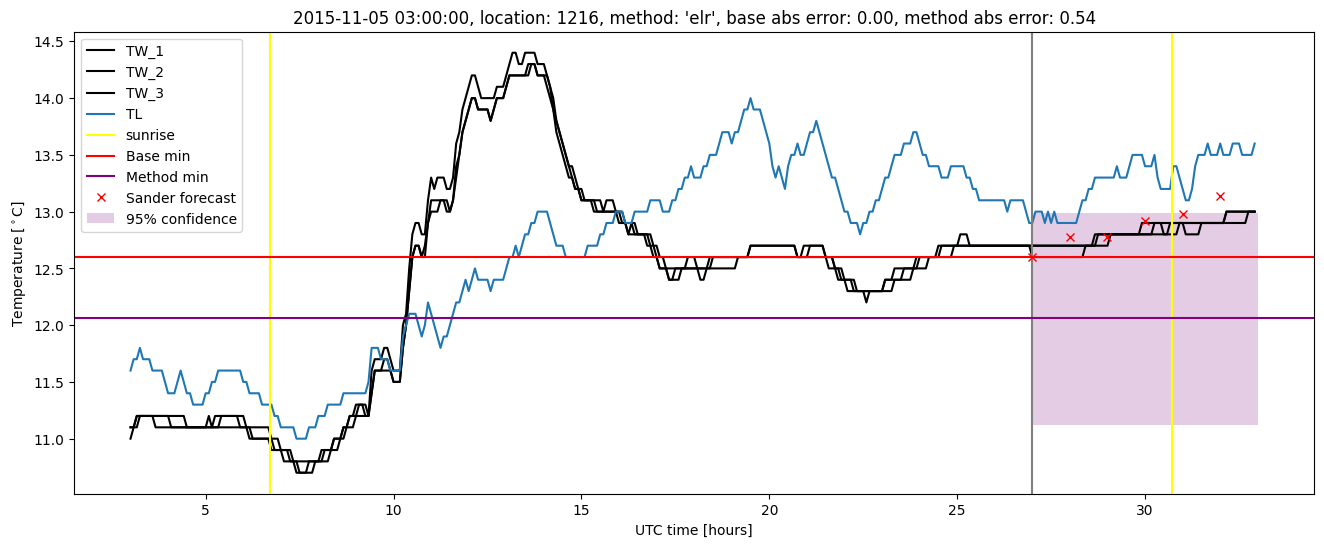
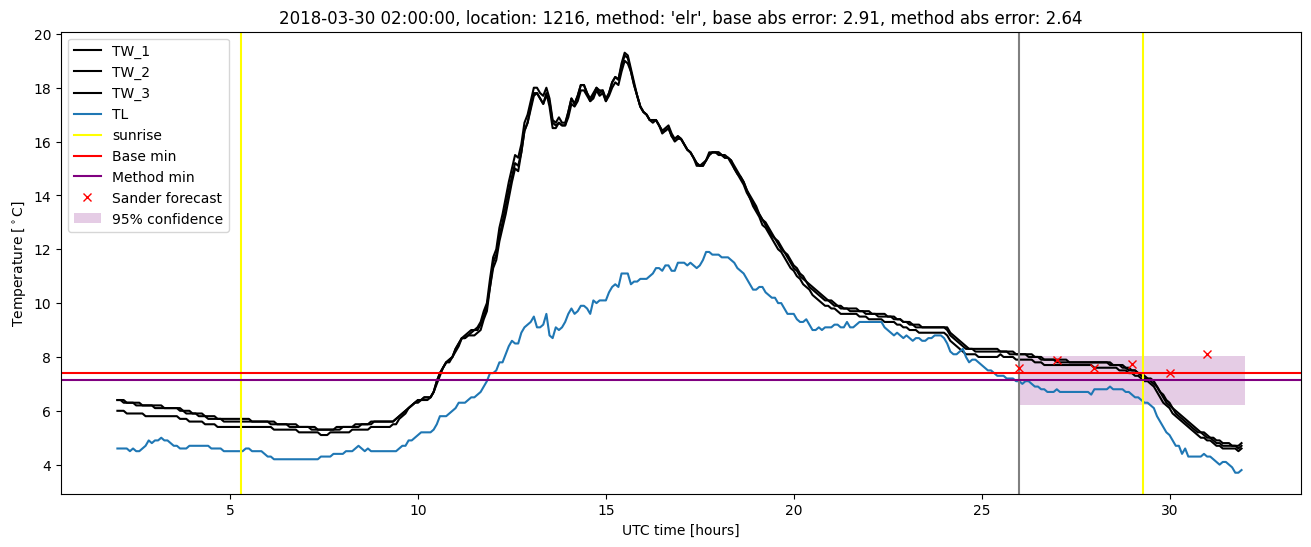
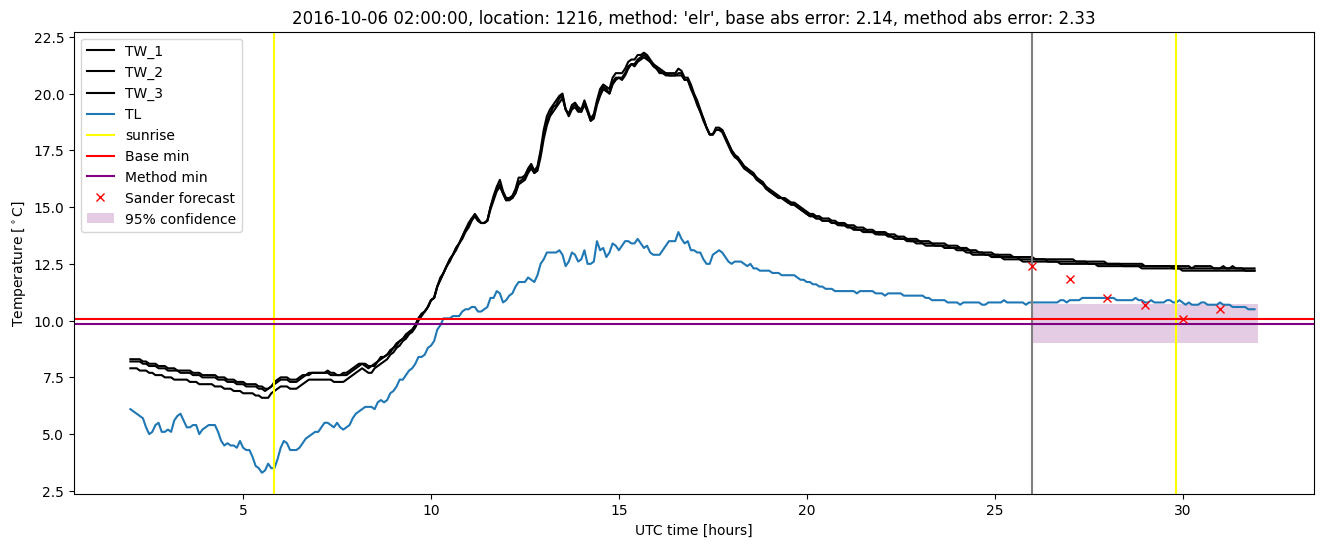
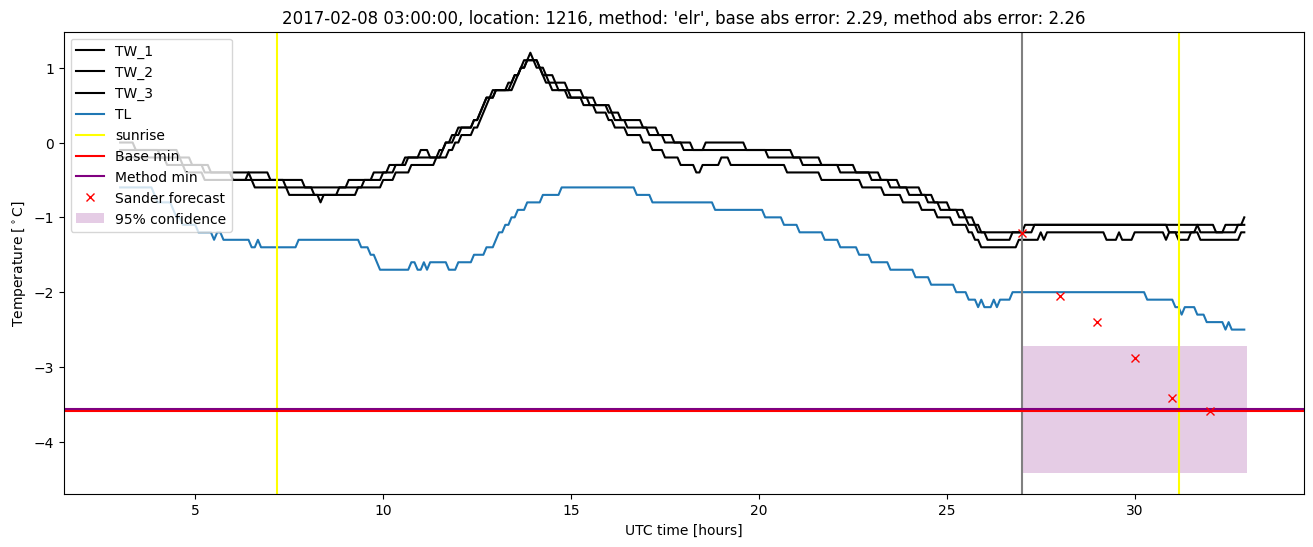
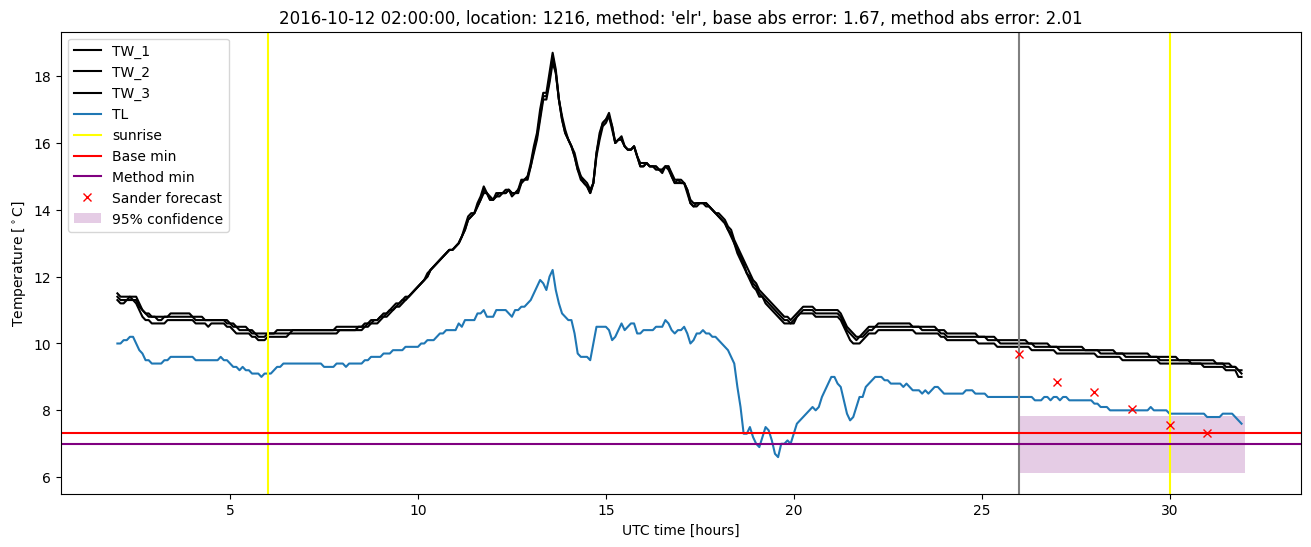
Extended logistic regression results
| names |
period |
power |
significance |
meanSquareError |
absError |
maxError |
CRPS |
IGN |
| baseline |
winter 2016 |
0.988 |
0.083 |
0.332 |
0.428 |
2.125 |
NaN |
NaN |
| elr |
winter 2016 |
0.988 |
0.000e+00 |
0.325 |
0.452 |
1.921 |
0.680 |
5.086 |
| baseline |
winter 2017 |
0.992 |
0.057 |
0.604 |
0.555 |
2.304 |
NaN |
NaN |
| elr |
winter 2017 |
0.992 |
0.029 |
0.541 |
0.528 |
2.333 |
0.626 |
6.288 |
| baseline |
winter 2018 |
0.973 |
0.143 |
0.398 |
0.434 |
2.915 |
NaN |
NaN |
| elr |
winter 2018 |
0.980 |
0.071 |
0.370 |
0.453 |
2.639 |
0.660 |
5.266 |
| baseline |
winter 2019 |
1.000 |
0.071 |
0.261 |
0.390 |
1.596 |
NaN |
NaN |
| elr |
winter 2019 |
1.000 |
0.071 |
0.277 |
0.411 |
1.727 |
0.604 |
4.140 |
| baseline |
all |
0.988 |
0.089 |
0.392 |
0.449 |
2.915 |
NaN |
NaN |
| elr |
all |
0.990 |
0.040 |
0.373 |
0.459 |
2.639 |
0.645 |
5.171 |
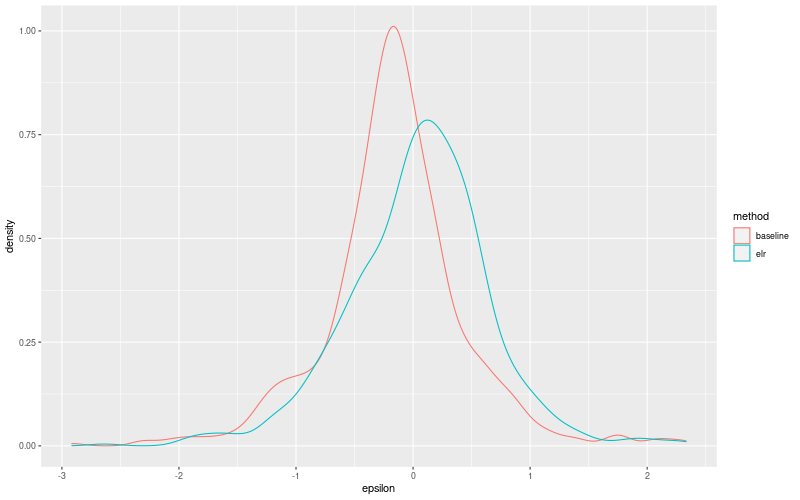
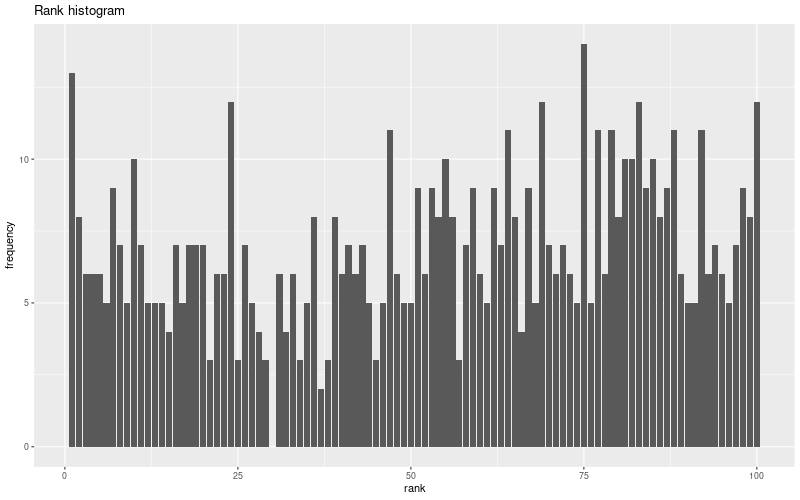
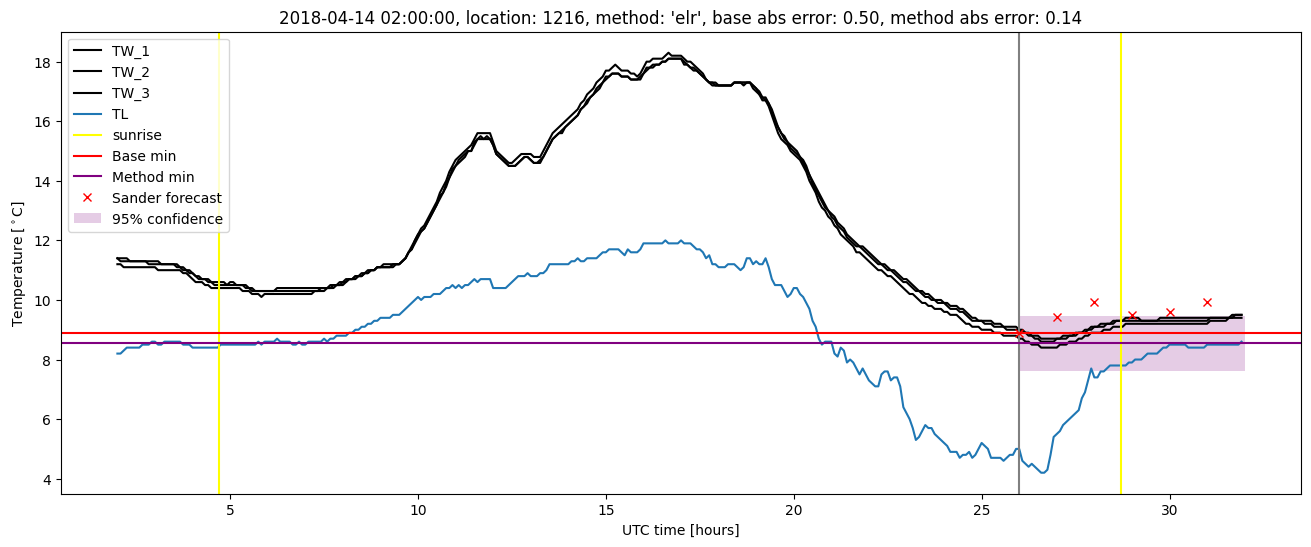
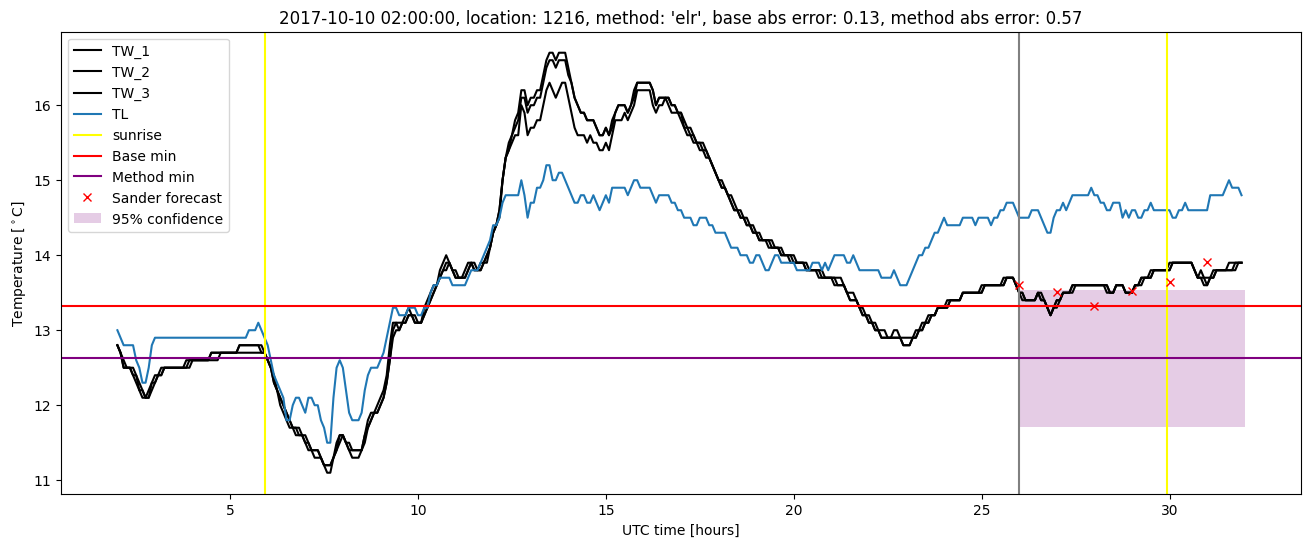
Extended logistic regression plots