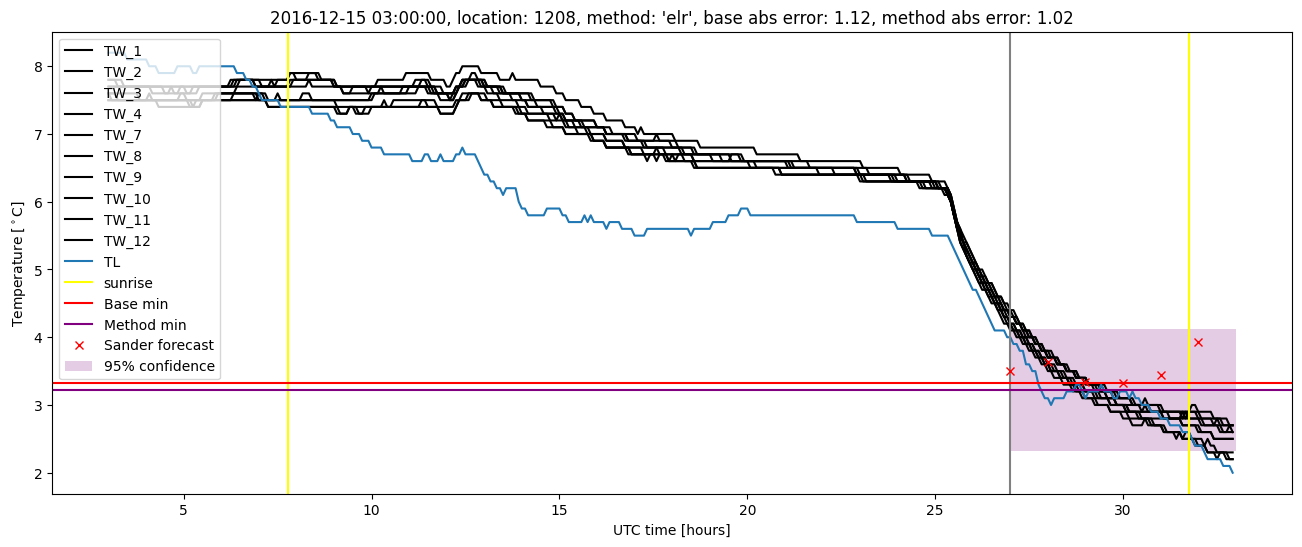
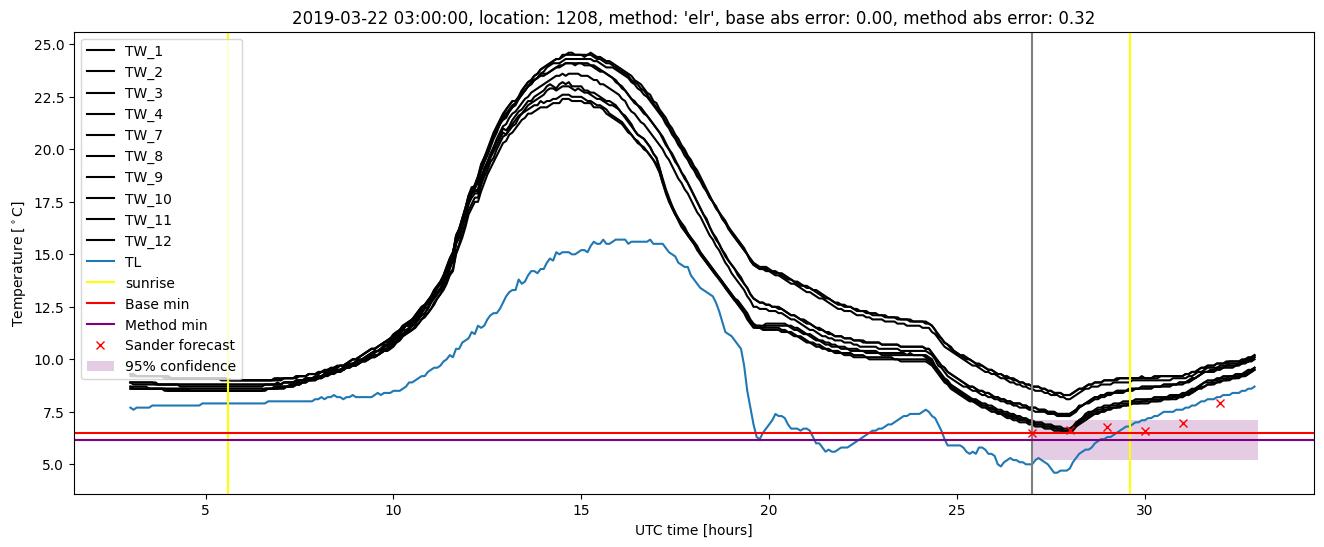
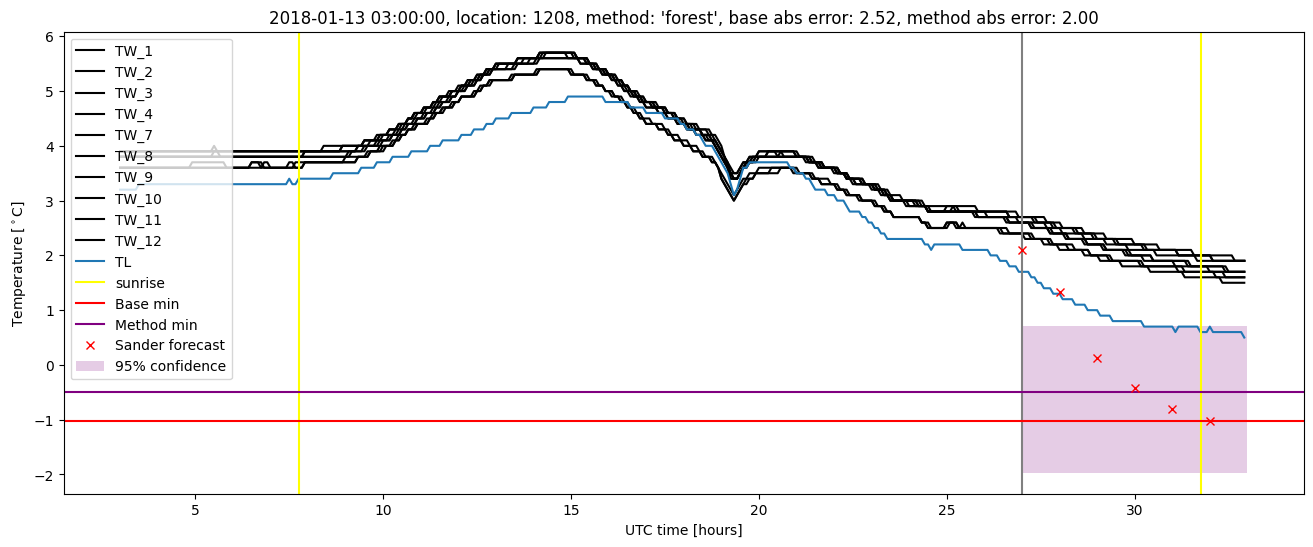
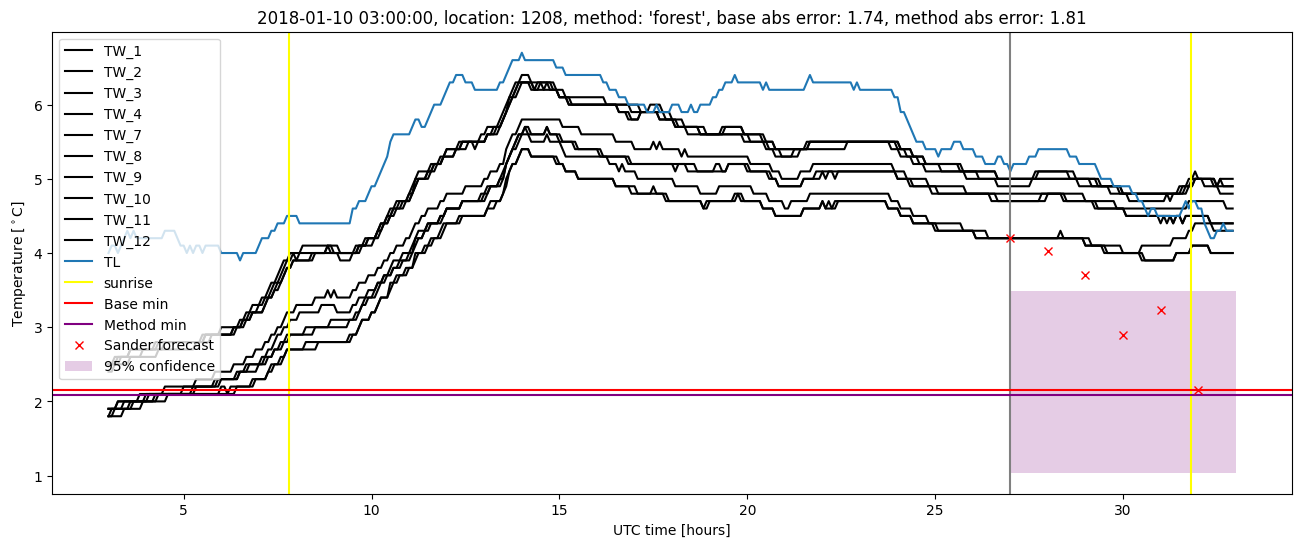
GMS location: 1208
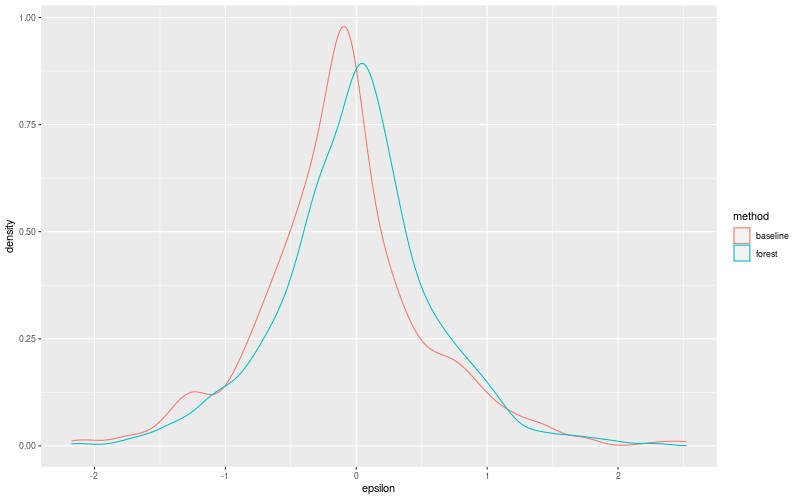
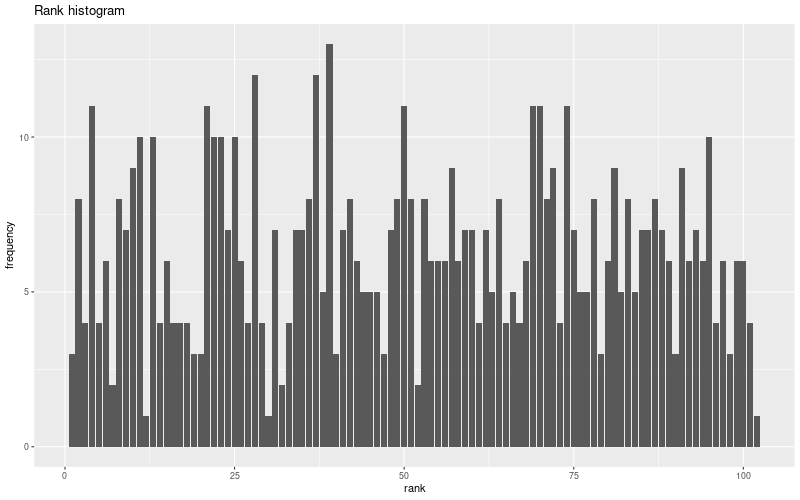
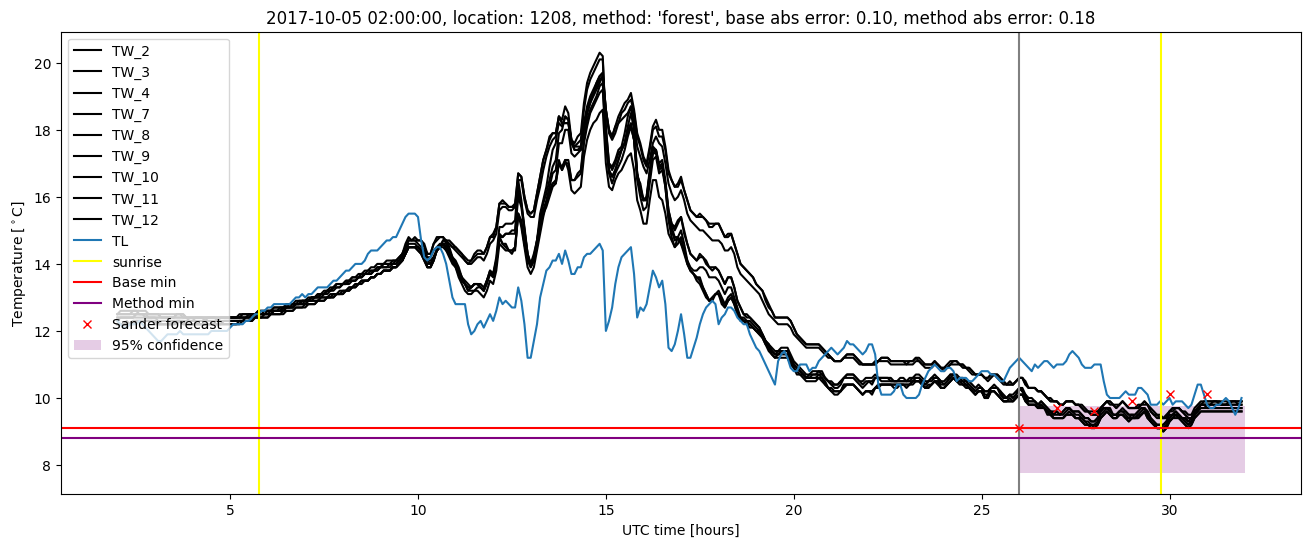
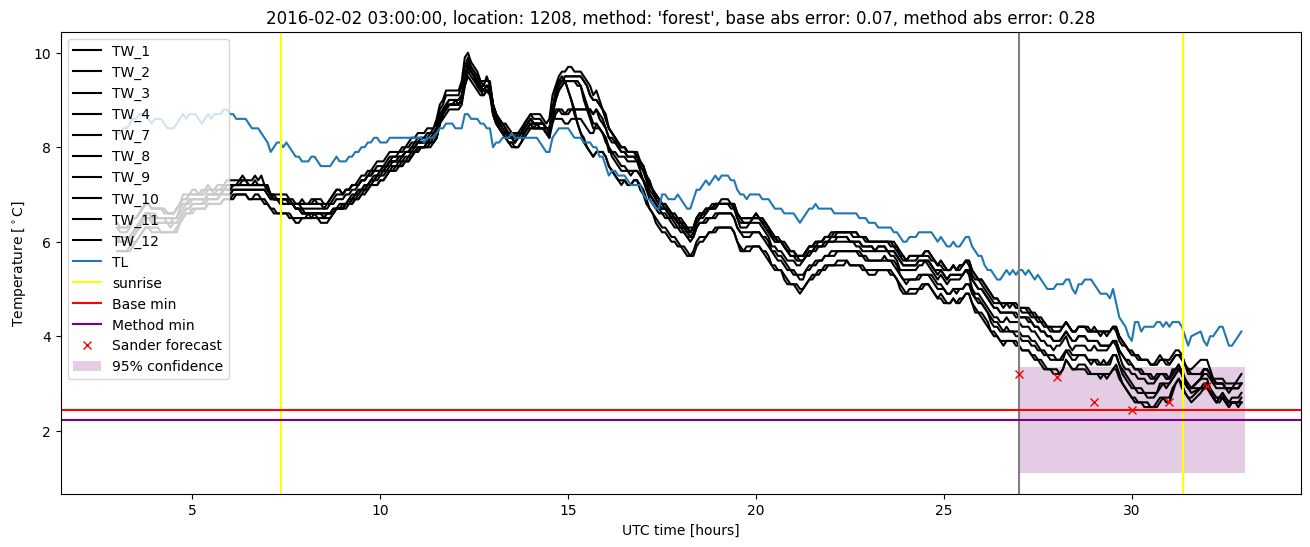
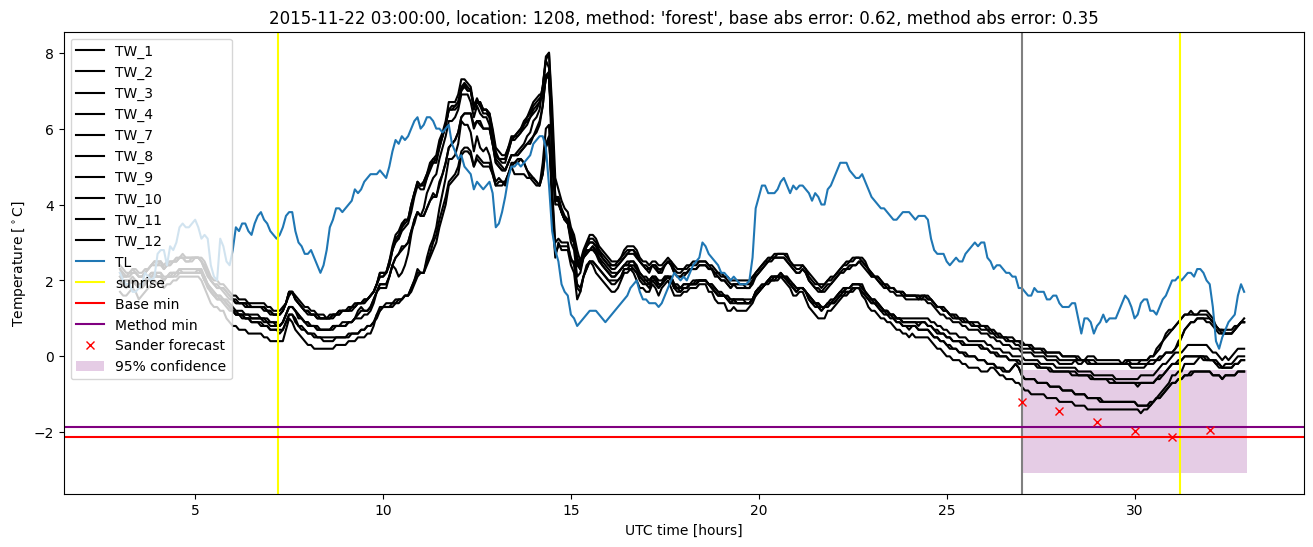
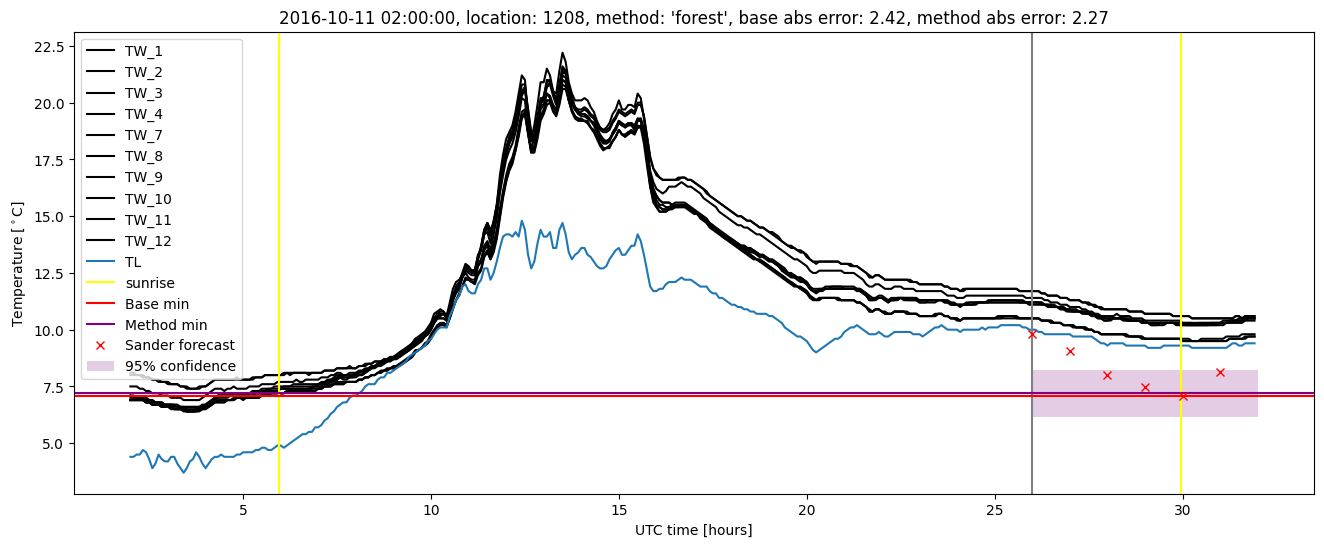
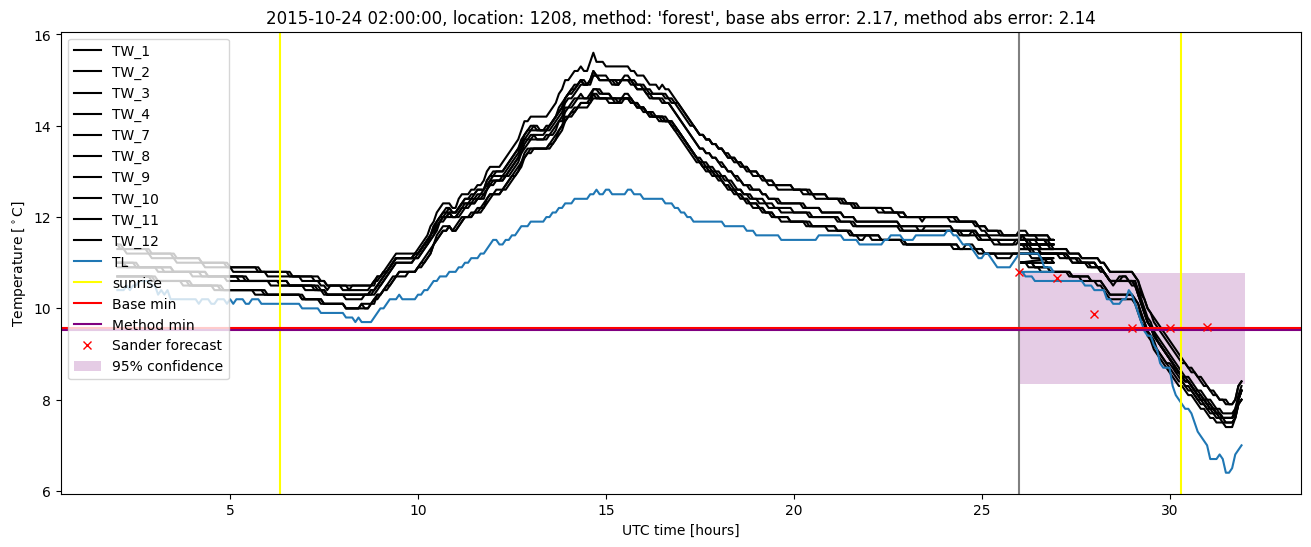
Random forest results
| names |
period |
power |
significance |
meanSquareError |
absError |
maxError |
CRPS |
IGN |
| baseline |
winter 2016 |
0.988 |
0.029 |
0.354 |
0.433 |
2.173 |
NaN |
NaN |
| forest |
winter 2016 |
0.988 |
0.029 |
0.279 |
0.384 |
2.135 |
0.528 |
2.682 |
| baseline |
winter 2017 |
0.982 |
0.098 |
0.545 |
0.529 |
2.416 |
NaN |
NaN |
| forest |
winter 2017 |
0.973 |
0.073 |
0.445 |
0.491 |
2.274 |
0.530 |
3.506 |
| baseline |
winter 2018 |
0.986 |
0.046 |
0.388 |
0.469 |
2.520 |
NaN |
NaN |
| forest |
winter 2018 |
0.979 |
0.023 |
0.353 |
0.448 |
2.000 |
0.527 |
2.662 |
| baseline |
winter 2019 |
1.000 |
0.071 |
0.323 |
0.433 |
1.448 |
NaN |
NaN |
| forest |
winter 2019 |
1.000 |
0.071 |
0.285 |
0.415 |
1.422 |
0.515 |
2.636 |
| baseline |
all |
0.988 |
0.060 |
0.404 |
0.466 |
2.520 |
NaN |
NaN |
| forest |
all |
0.985 |
0.045 |
0.341 |
0.433 |
2.274 |
0.526 |
2.863 |
Random forest plots
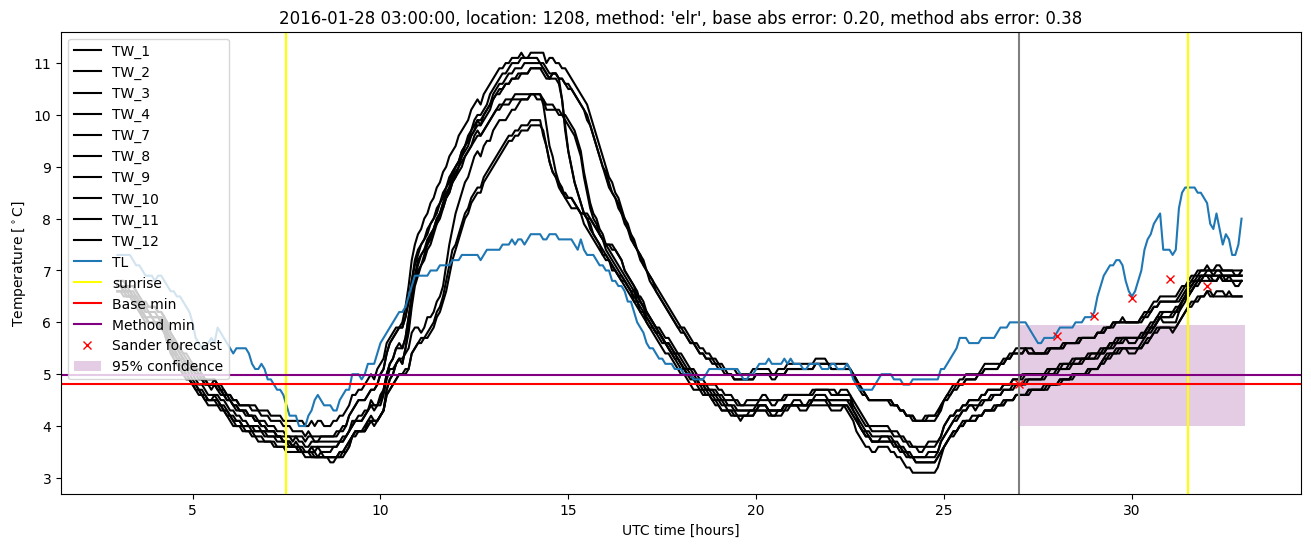
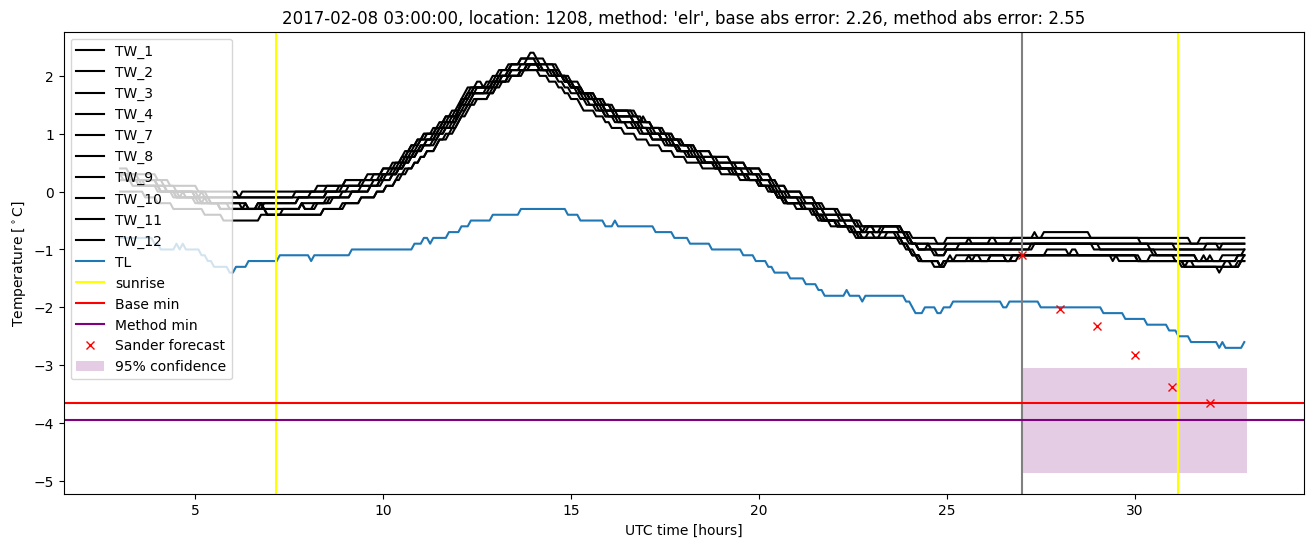
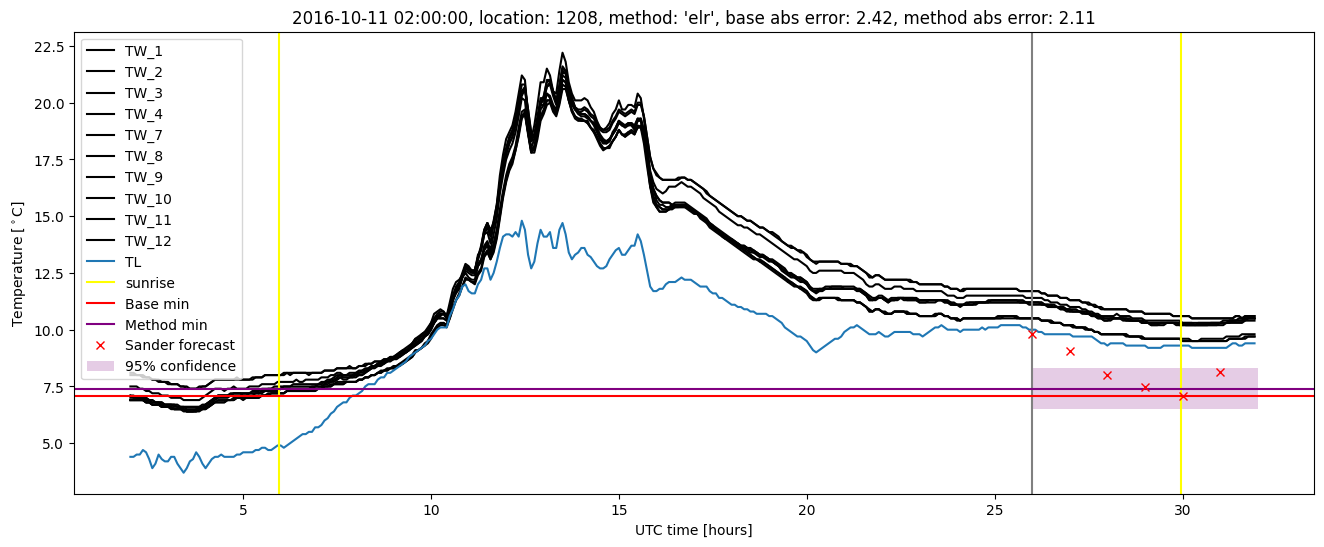
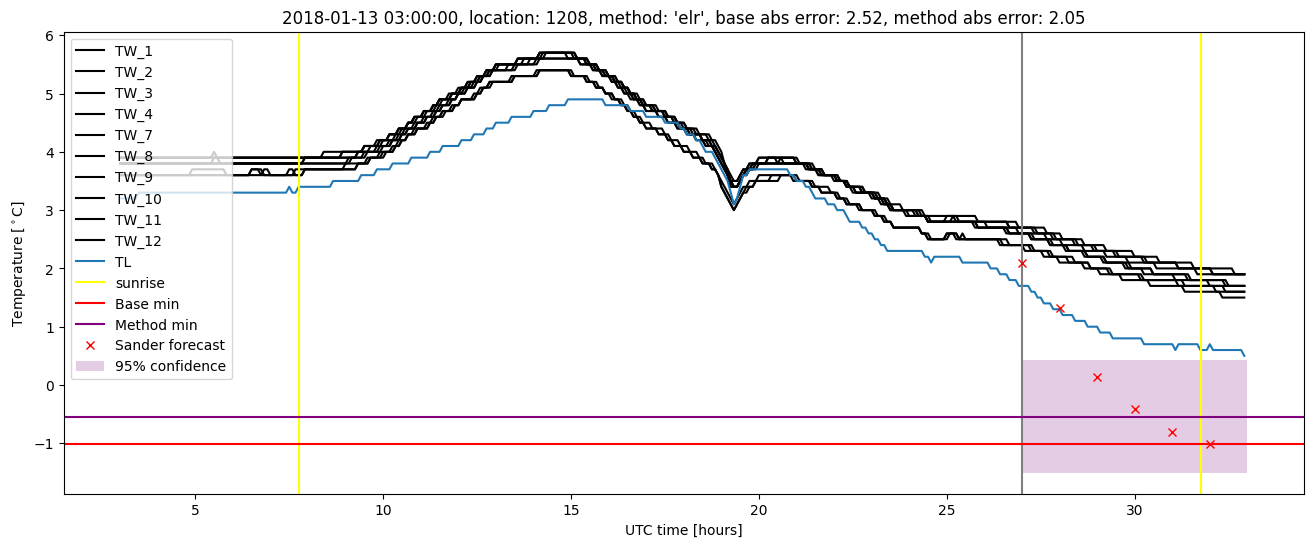
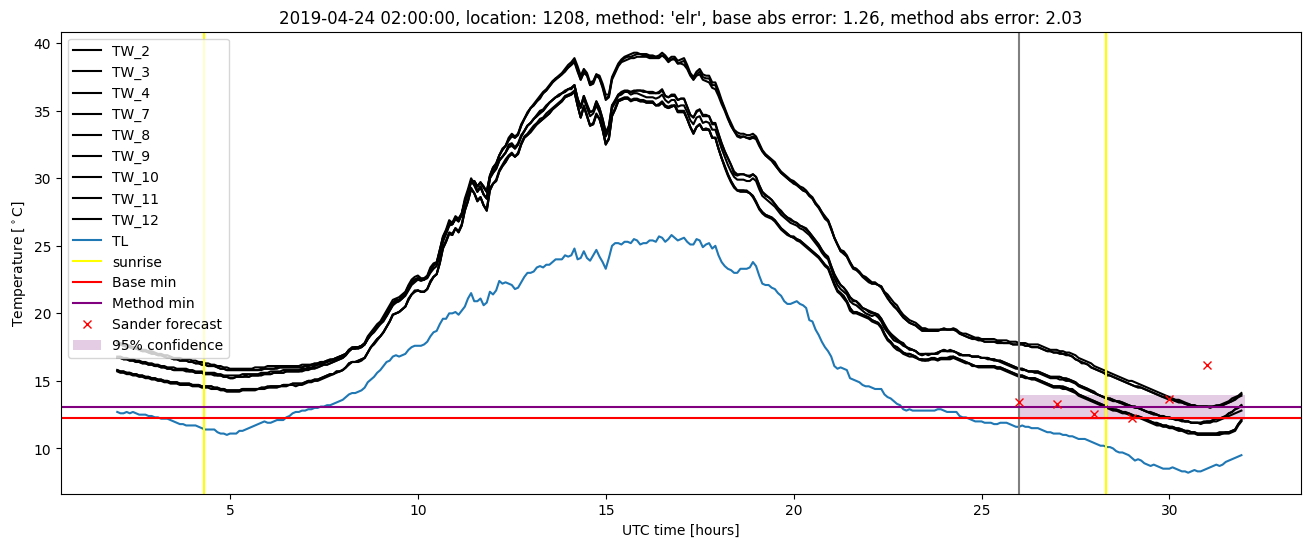
Extended logistic regression results
| names |
period |
power |
significance |
meanSquareError |
absError |
maxError |
CRPS |
IGN |
| baseline |
winter 2016 |
0.988 |
0.029 |
0.354 |
0.433 |
2.173 |
NaN |
NaN |
| elr |
winter 2016 |
0.981 |
0.000e+00 |
0.315 |
0.437 |
2.193 |
0.605 |
3.691 |
| baseline |
winter 2017 |
0.982 |
0.098 |
0.545 |
0.529 |
2.416 |
NaN |
NaN |
| elr |
winter 2017 |
0.973 |
0.073 |
0.526 |
0.542 |
2.550 |
0.603 |
4.722 |
| baseline |
winter 2018 |
0.986 |
0.046 |
0.388 |
0.469 |
2.520 |
NaN |
NaN |
| elr |
winter 2018 |
0.972 |
0.023 |
0.390 |
0.474 |
2.046 |
0.606 |
3.850 |
| baseline |
winter 2019 |
1.000 |
0.071 |
0.323 |
0.433 |
1.448 |
NaN |
NaN |
| elr |
winter 2019 |
1.000 |
0.071 |
0.414 |
0.500 |
2.032 |
0.561 |
3.500 |
| baseline |
all |
0.988 |
0.060 |
0.404 |
0.466 |
2.520 |
NaN |
NaN |
| elr |
all |
0.981 |
0.038 |
0.404 |
0.483 |
2.550 |
0.597 |
3.947 |
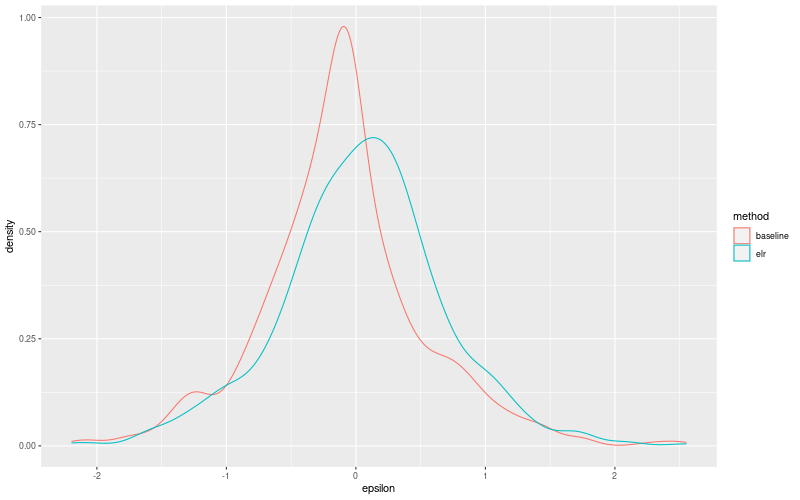
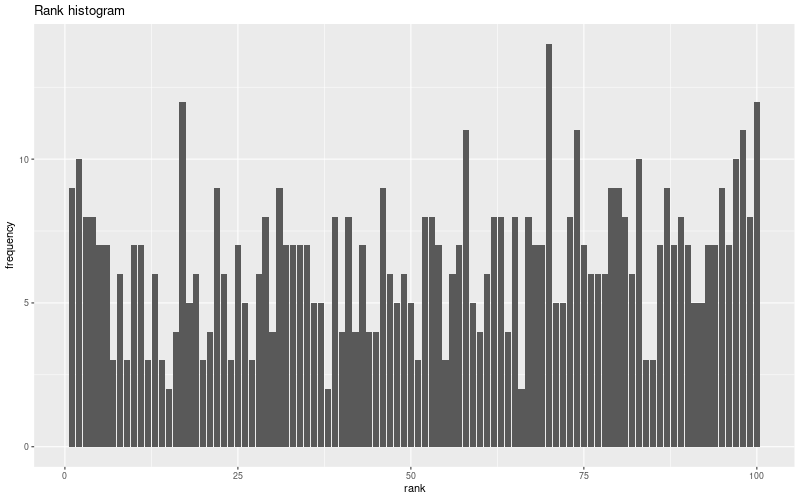
Extended logistic regression plots