GMS location: 1207
Random forest results
| names |
period |
power |
significance |
meanSquareError |
absError |
maxError |
CRPS |
IGN |
| baseline |
winter 2016 |
0.989 |
0.100 |
0.356 |
0.430 |
2.718 |
NaN |
NaN |
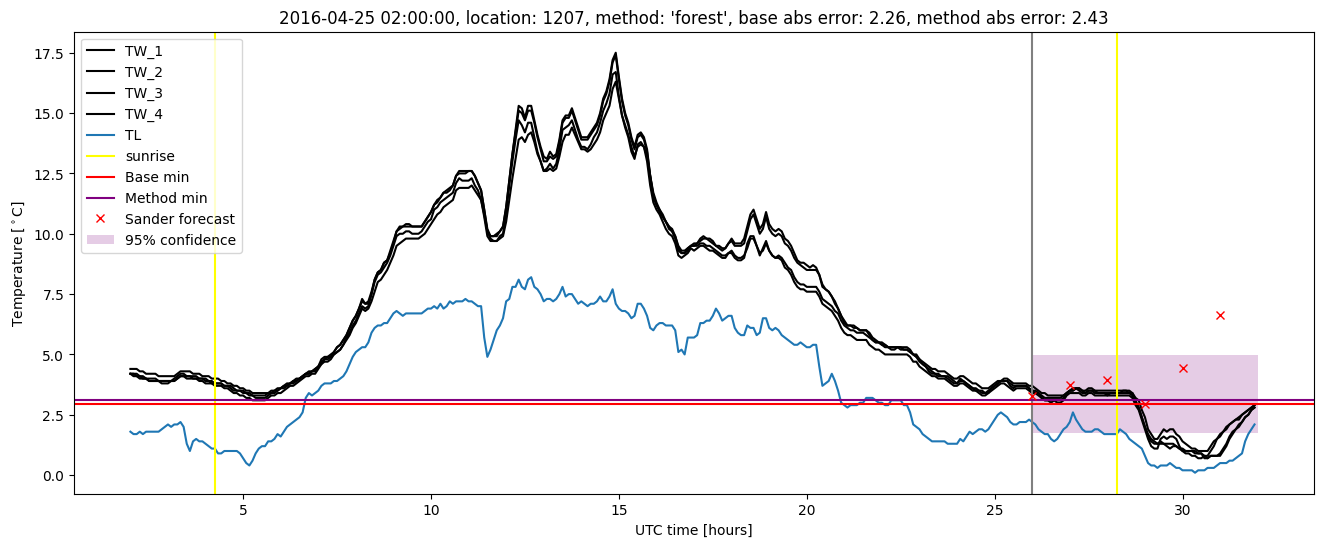
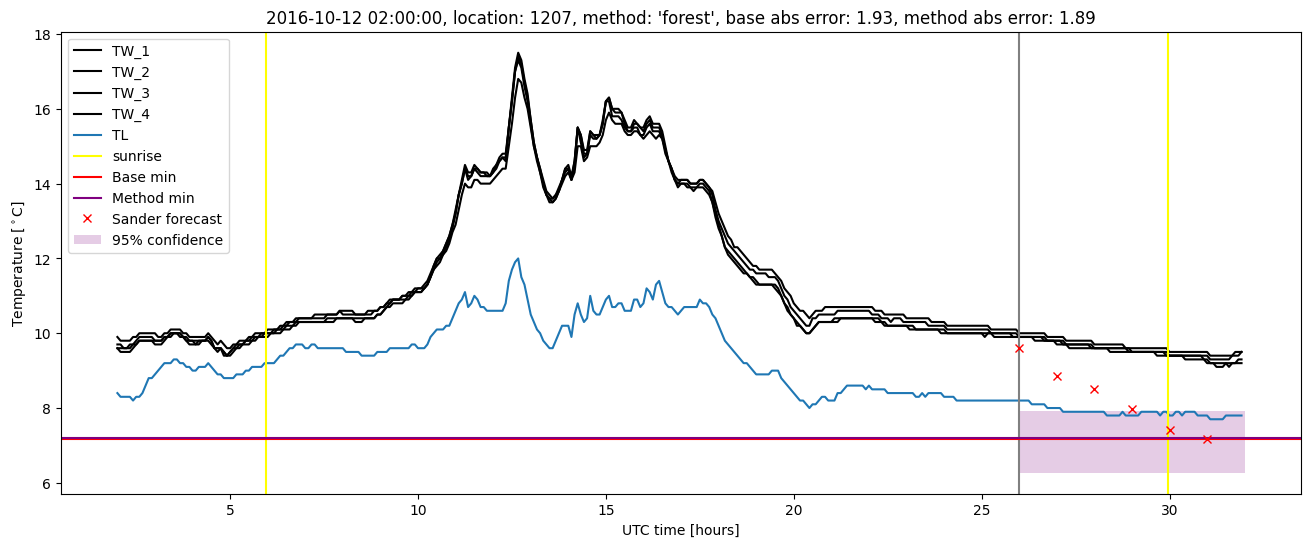
| forest |
winter 2016 |
0.989 |
0.067 |
0.274 |
0.353 |
2.523 |
0.496 |
3.909 |
| baseline |
winter 2017 |
0.983 |
0.081 |
0.488 |
0.517 |
2.459 |
NaN |
NaN |
| forest |
winter 2017 |
0.983 |
0.054 |
0.352 |
0.451 |
1.892 |
0.477 |
4.022 |
| baseline |
winter 2018 |
0.986 |
0.114 |
0.379 |
0.458 |
2.293 |
NaN |
NaN |
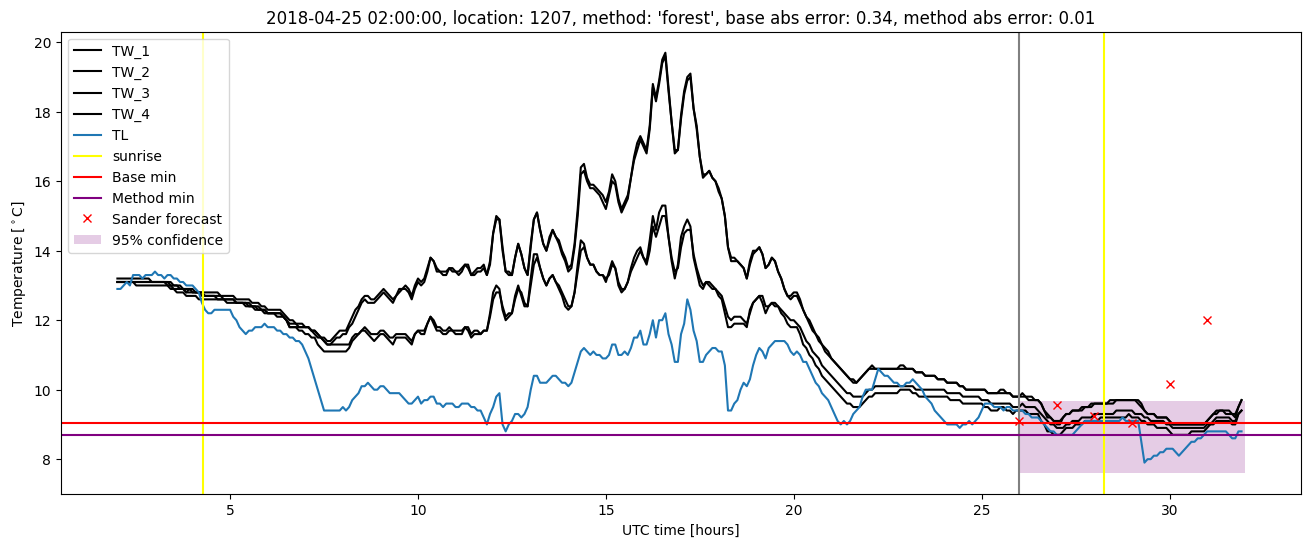
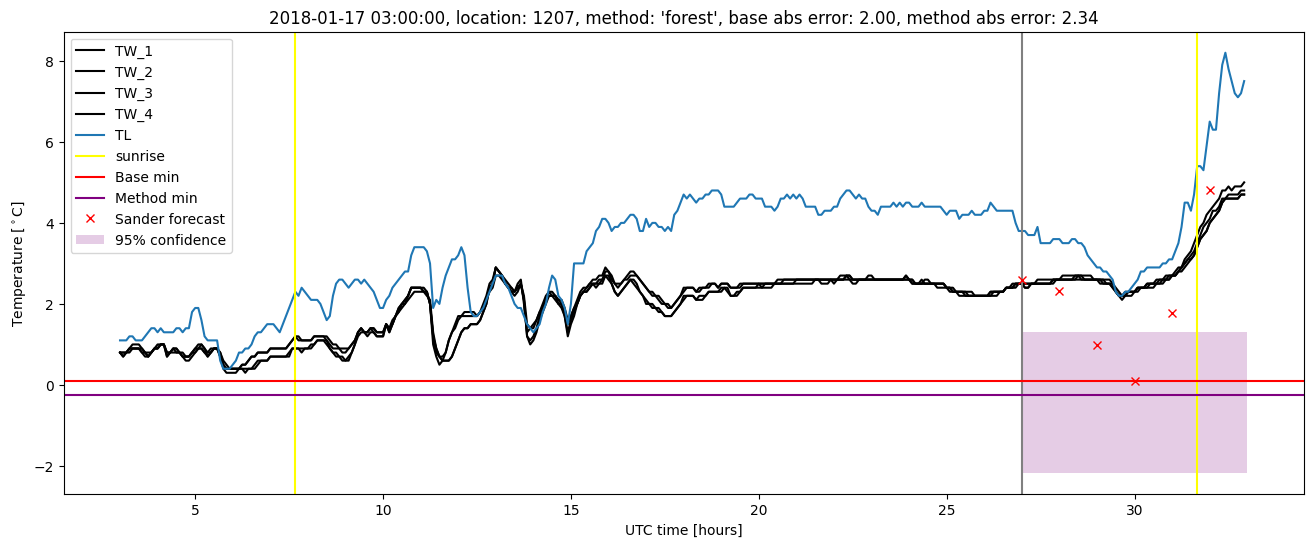
| forest |
winter 2018 |
0.972 |
0.143 |
0.332 |
0.425 |
2.341 |
0.506 |
3.549 |
| baseline |
winter 2019 |
1.000 |
0.083 |
0.284 |
0.380 |
1.901 |
NaN |
NaN |
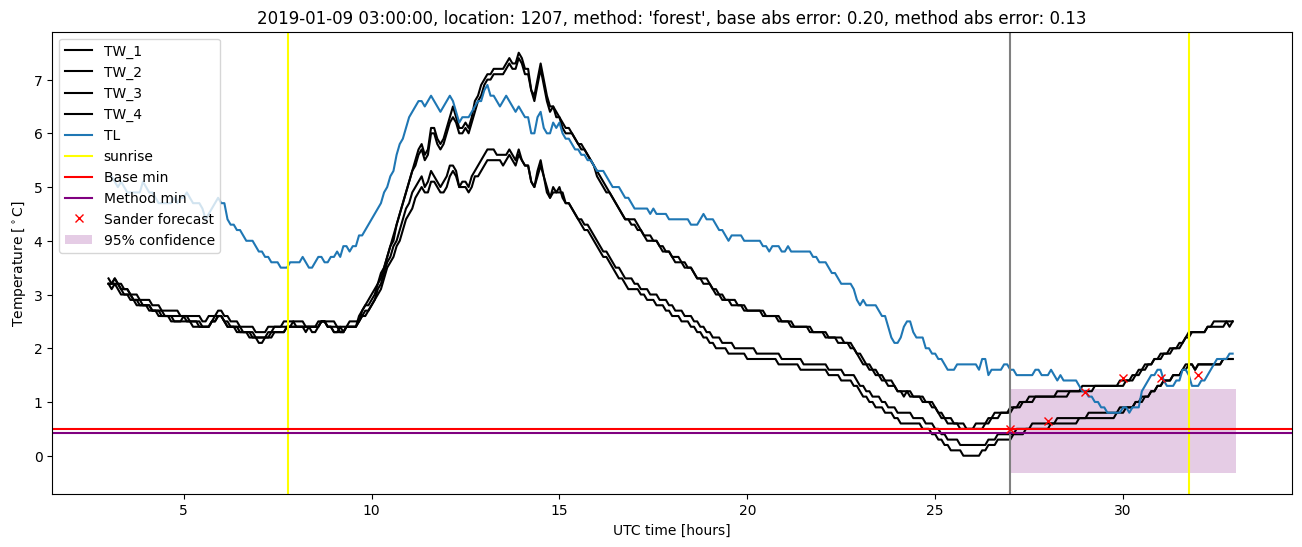
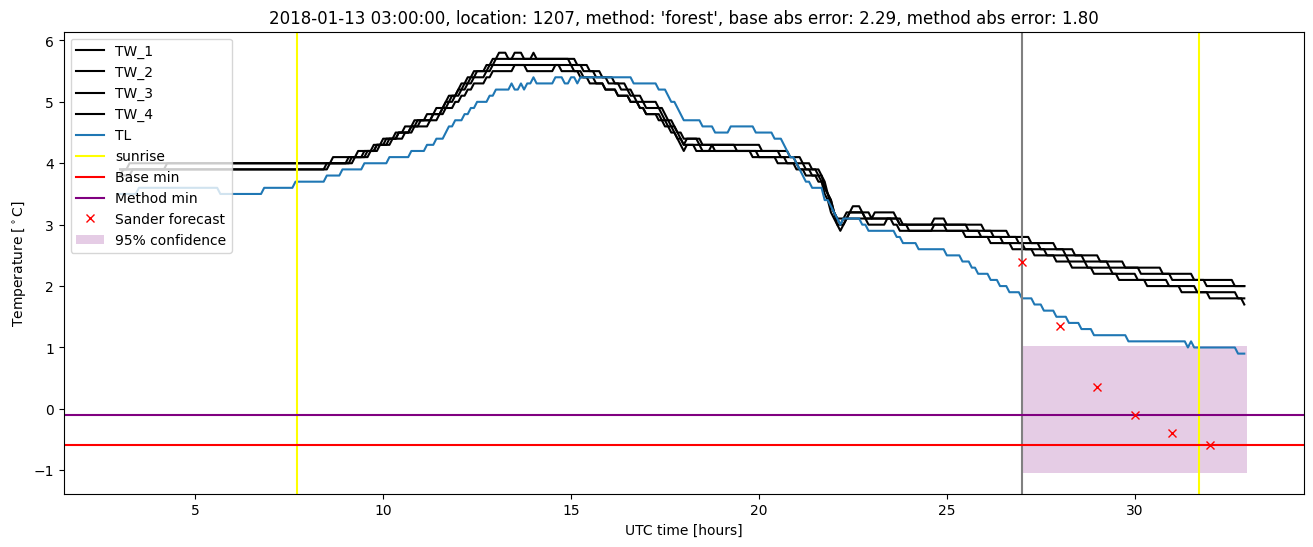
| forest |
winter 2019 |
1.000 |
0.083 |
0.222 |
0.352 |
1.681 |
0.490 |
3.473 |
| baseline |
all |
0.990 |
0.097 |
0.374 |
0.444 |
2.718 |
NaN |
NaN |
| forest |
all |
0.986 |
0.088 |
0.294 |
0.392 |
2.523 |
0.493 |
3.740 |
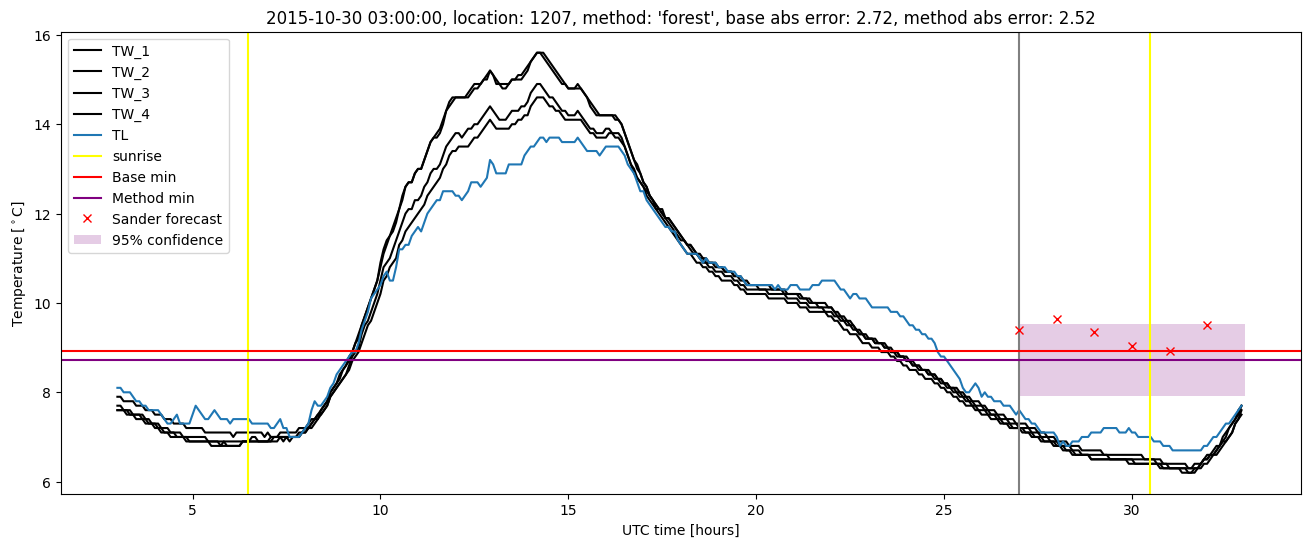
Random forest plots

Extended logistic regression results
| names |
period |
power |
significance |
meanSquareError |
absError |
maxError |
CRPS |
IGN |
| baseline |
winter 2016 |
0.989 |
0.100 |
0.356 |
0.430 |
2.718 |
NaN |
NaN |
| elr |
winter 2016 |
0.989 |
0.033 |
0.281 |
0.397 |
2.562 |
0.576 |
4.394 |
| baseline |
winter 2017 |
0.983 |
0.081 |
0.488 |
0.517 |
2.459 |
NaN |
NaN |
| elr |
winter 2017 |
0.983 |
0.108 |
0.397 |
0.484 |
1.925 |
0.496 |
4.131 |
| baseline |
winter 2018 |
0.986 |
0.114 |
0.379 |
0.458 |
2.293 |
NaN |
NaN |
| elr |
winter 2018 |
0.993 |
0.143 |
0.316 |
0.432 |
2.052 |
0.580 |
4.806 |
| baseline |
winter 2019 |
1.000 |
0.083 |
0.284 |
0.380 |
1.901 |
NaN |
NaN |
| elr |
winter 2019 |
1.000 |
0.083 |
0.282 |
0.417 |
1.883 |
0.537 |
3.575 |
| baseline |
all |
0.990 |
0.097 |
0.374 |
0.444 |
2.718 |
NaN |
NaN |
| elr |
all |
0.992 |
0.097 |
0.315 |
0.430 |
2.562 |
0.550 |
4.250 |
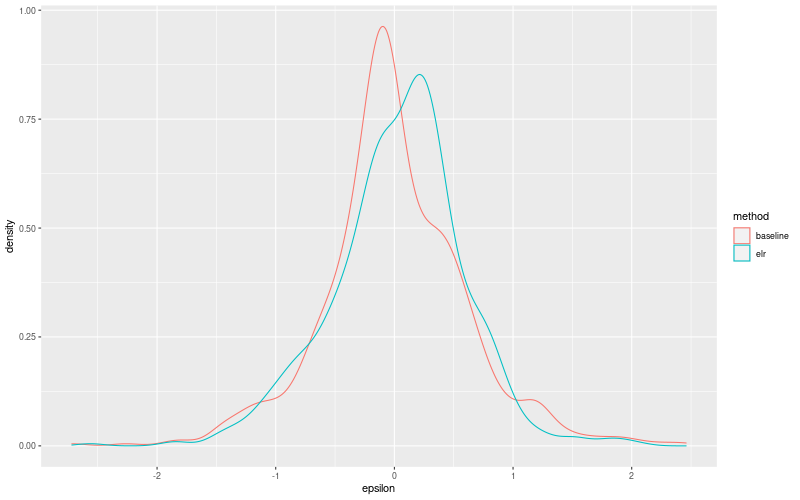
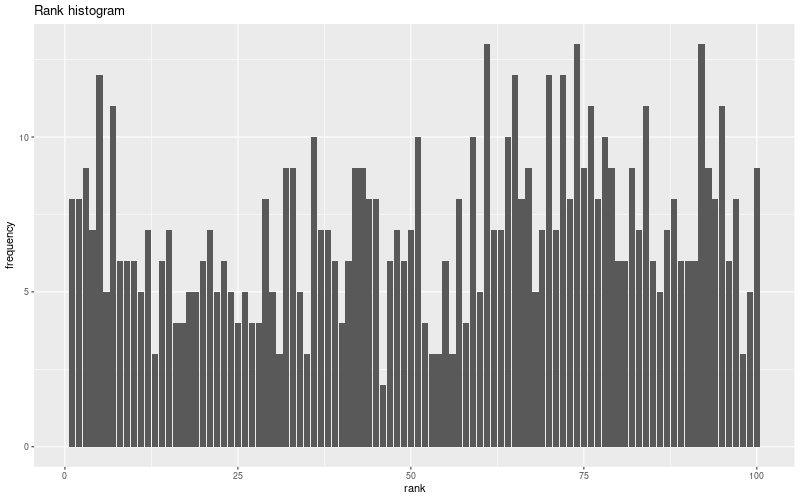
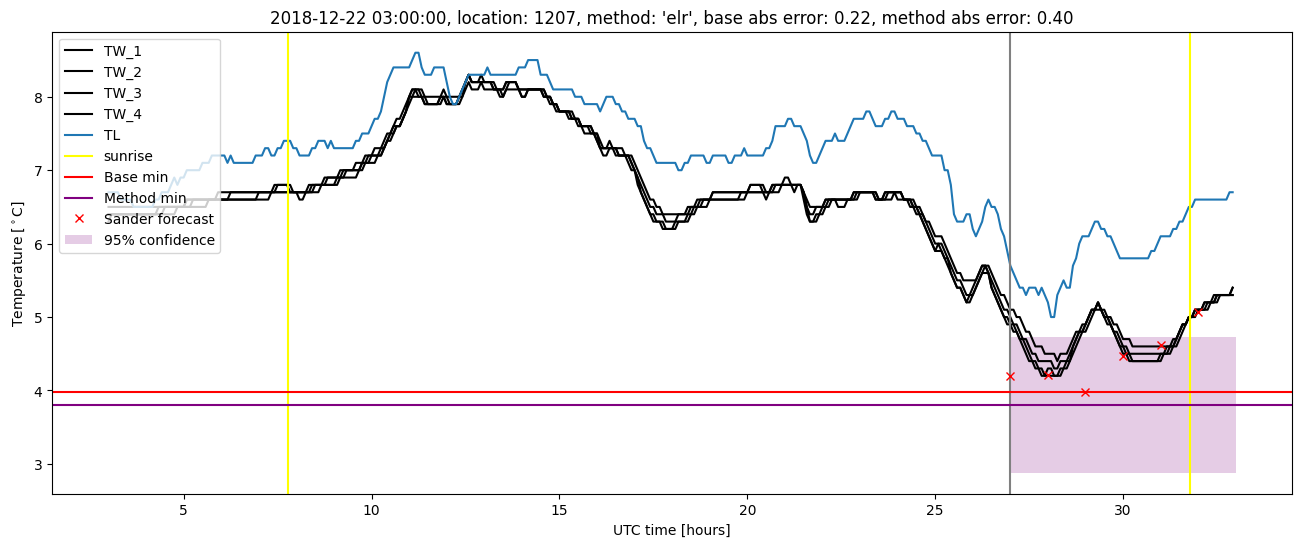
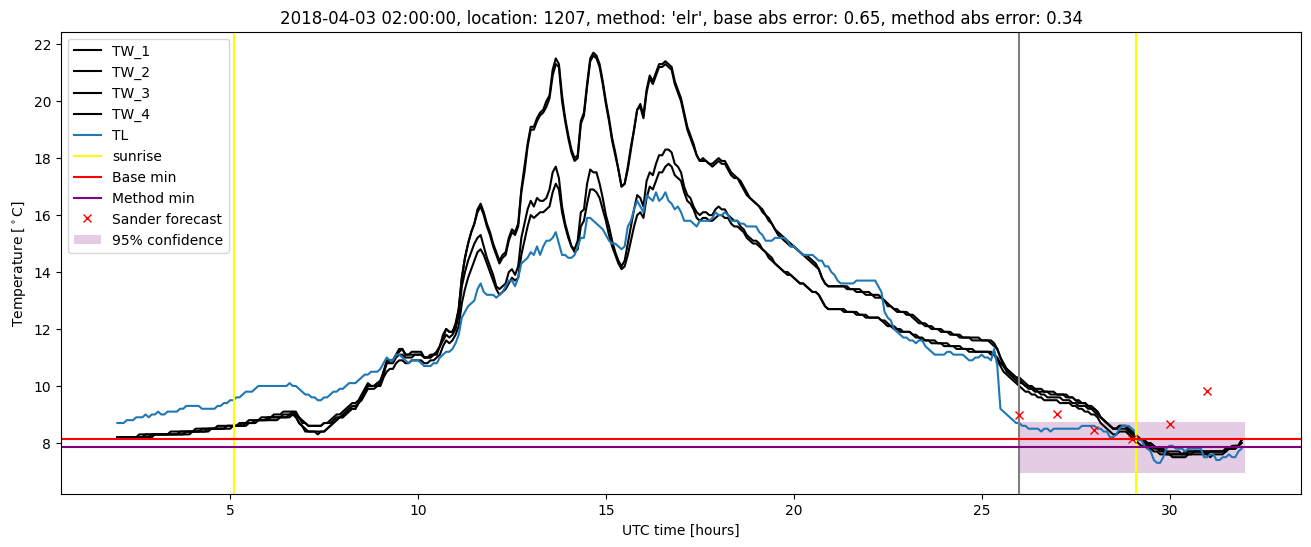
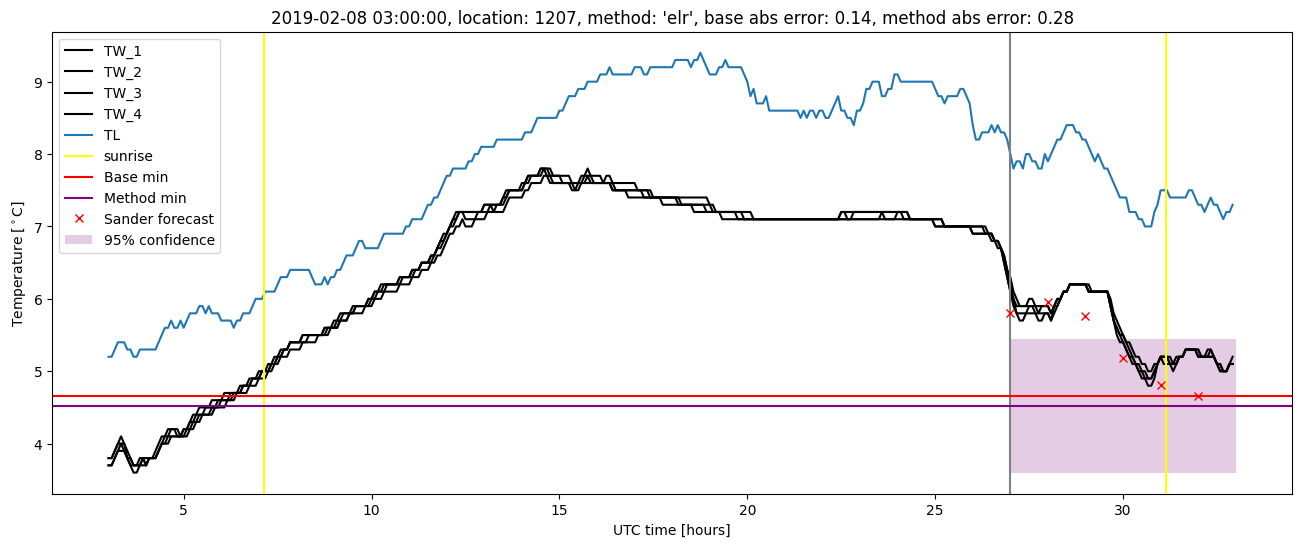
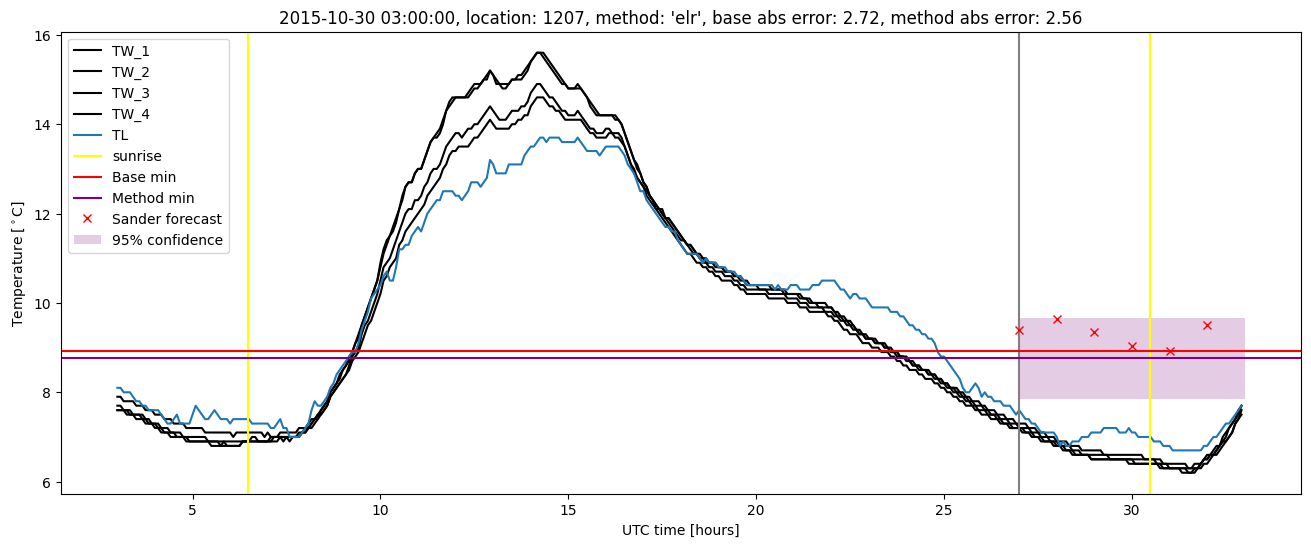
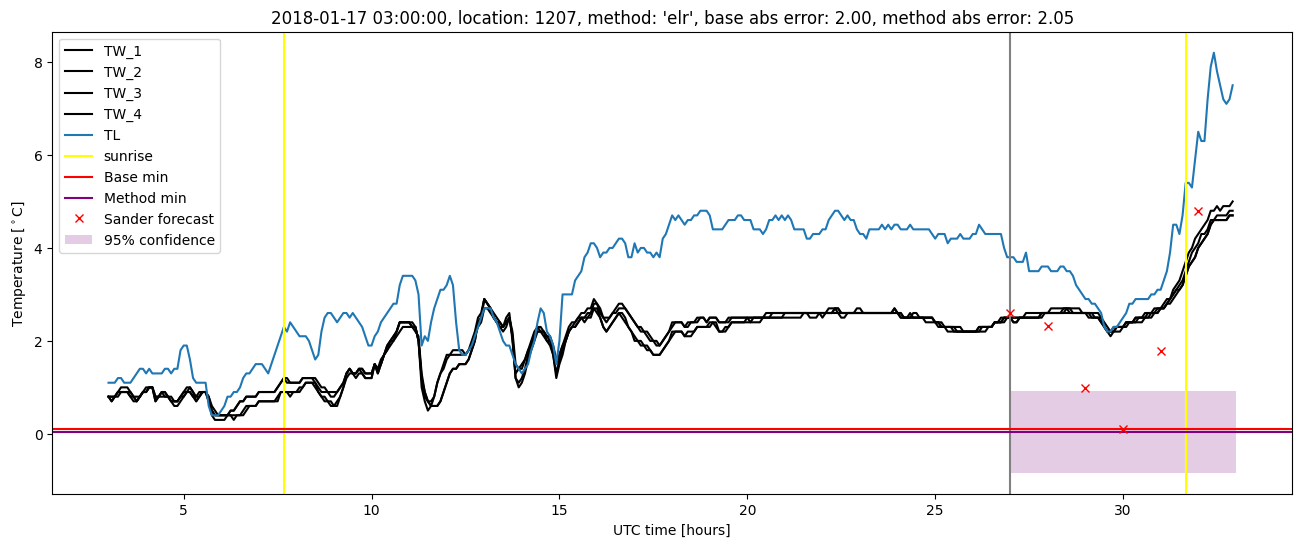
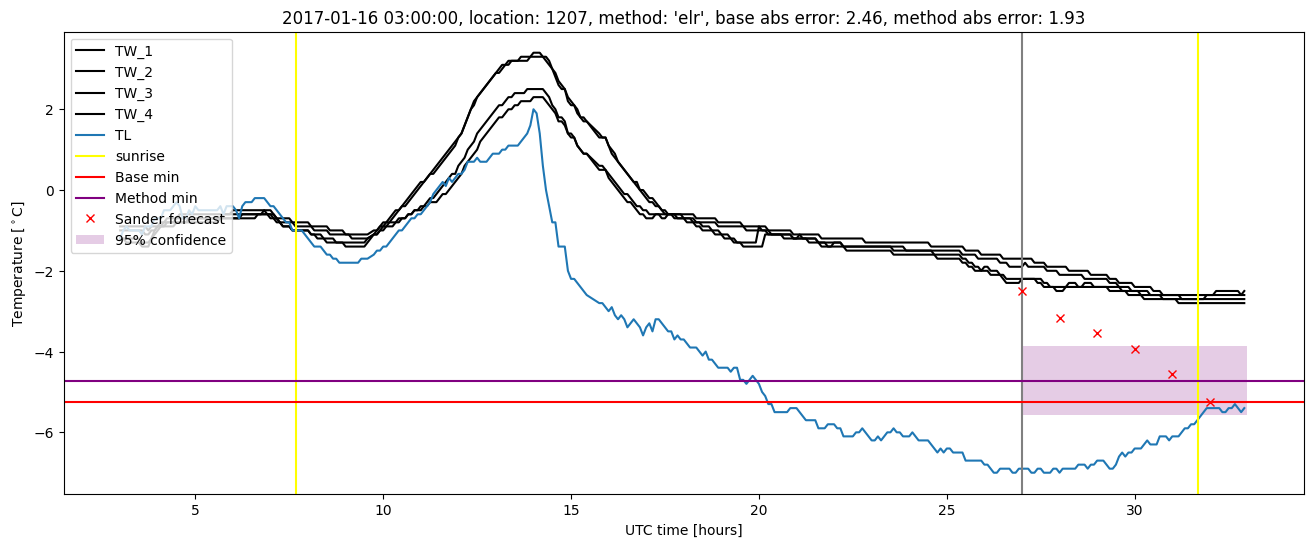
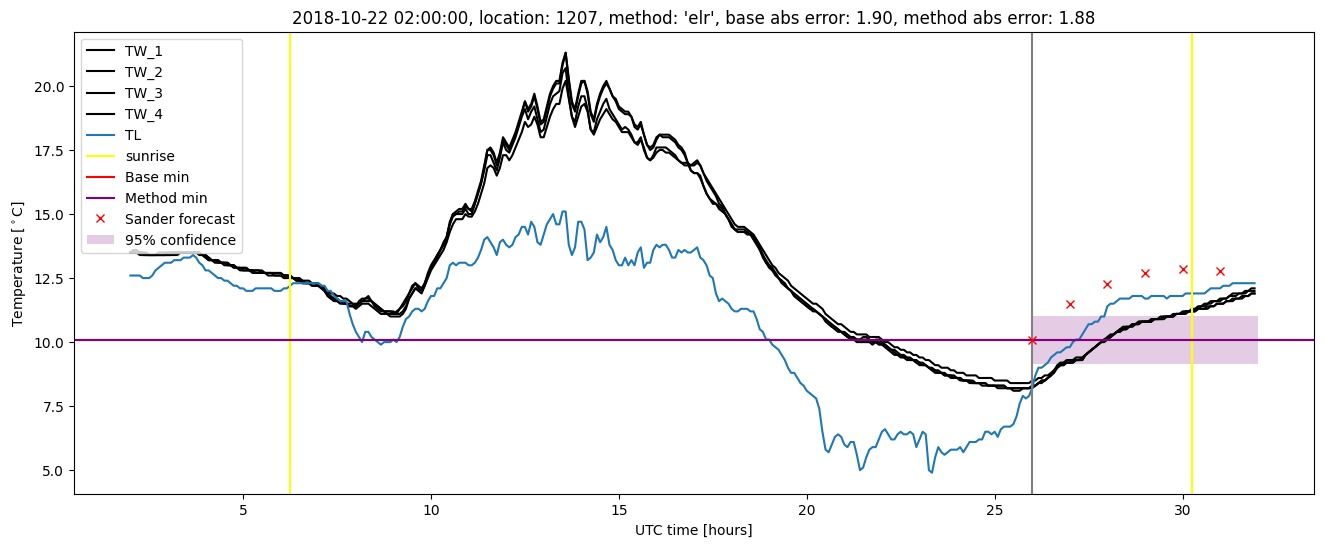
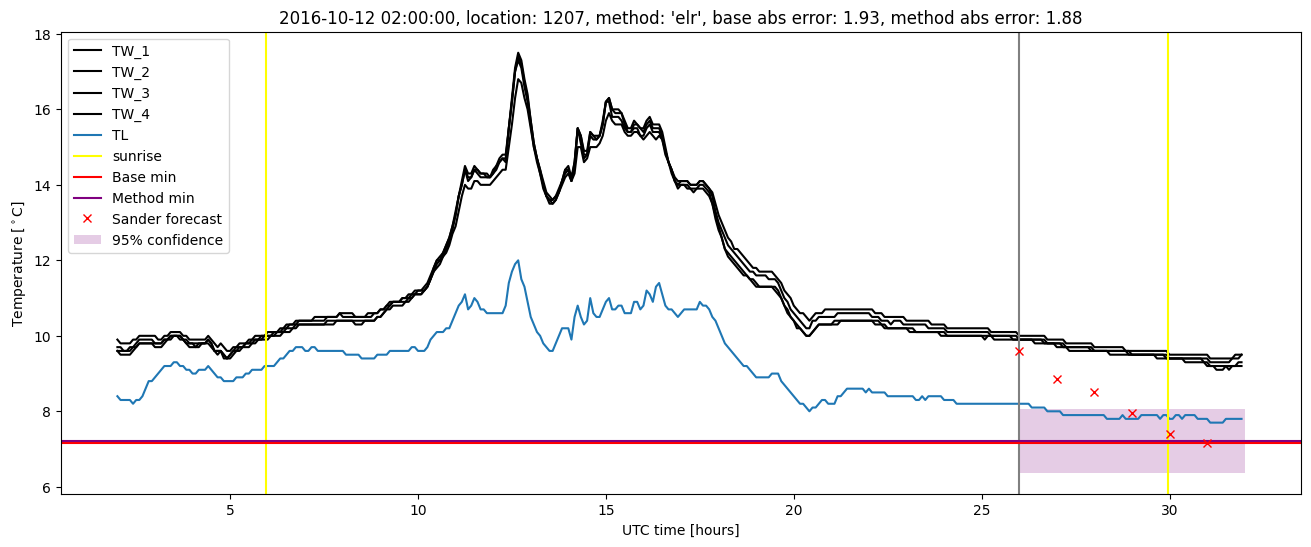
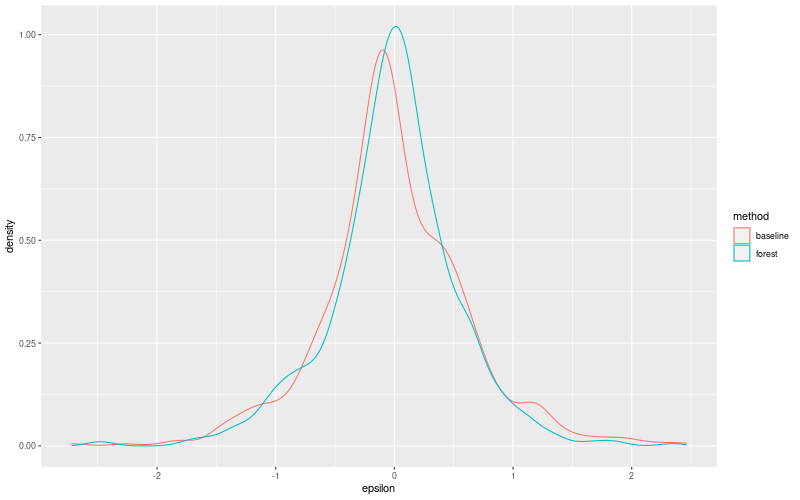
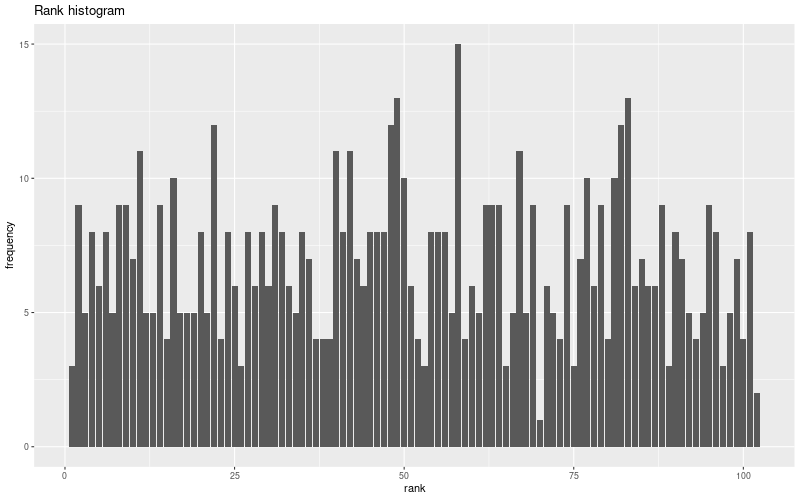
Extended logistic regression plots