GMS location: 1206
Random forest results
| names |
period |
power |
significance |
meanSquareError |
absError |
maxError |
CRPS |
IGN |
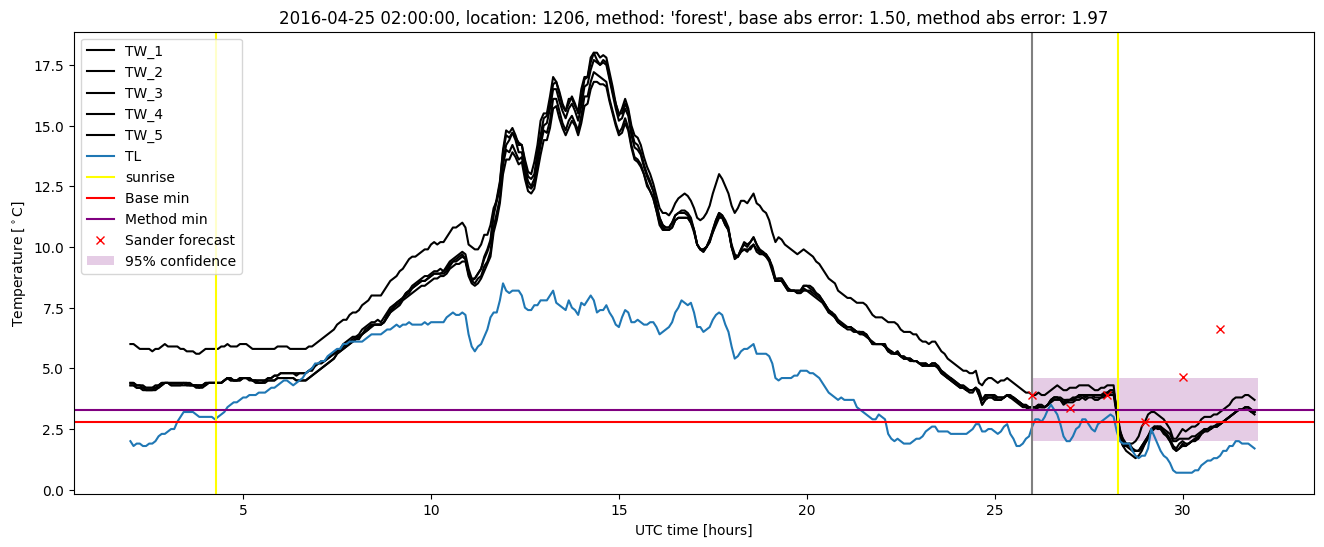
| baseline |
winter 2016 |
0.989 |
0.037 |
0.350 |
0.444 |
1.632 |
NaN |
NaN |
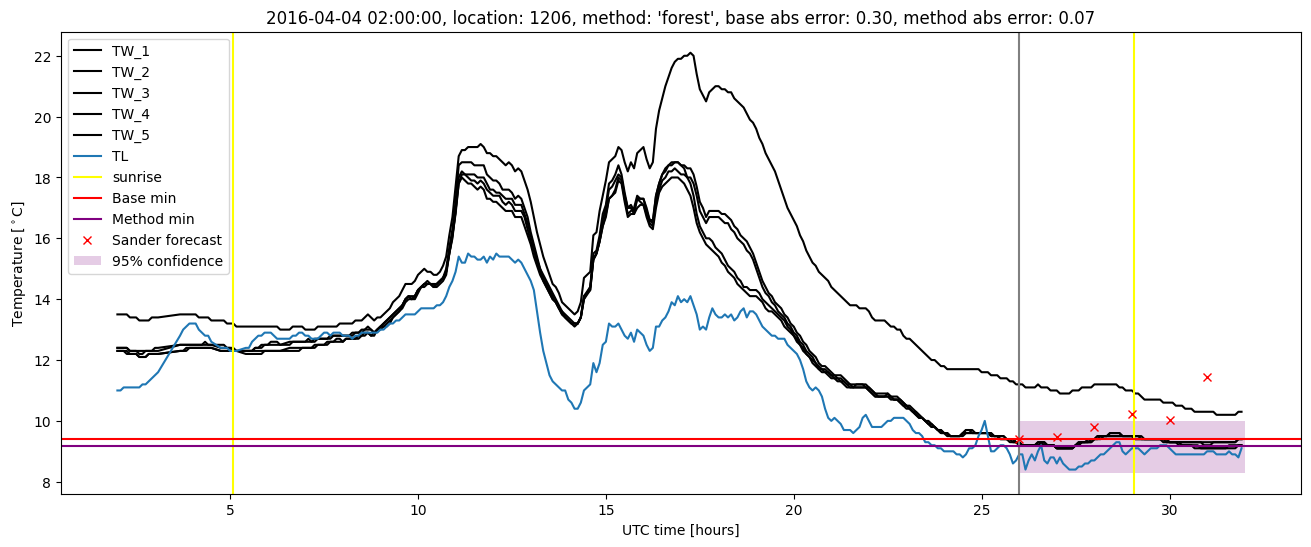
| forest |
winter 2016 |
0.994 |
0.037 |
0.275 |
0.382 |
1.969 |
0.477 |
3.057 |
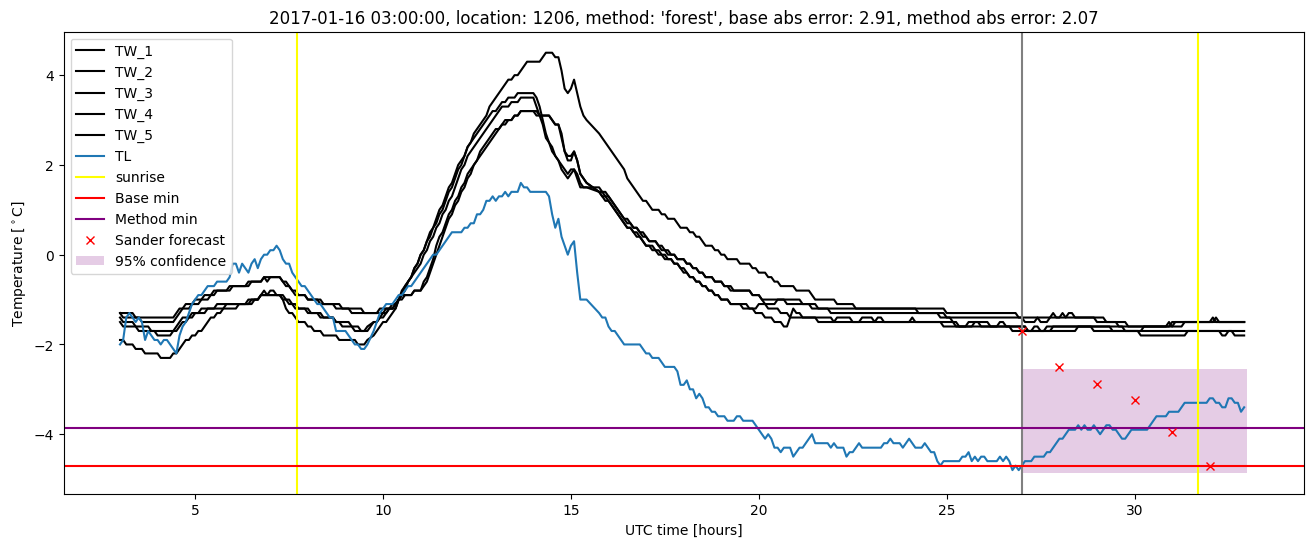
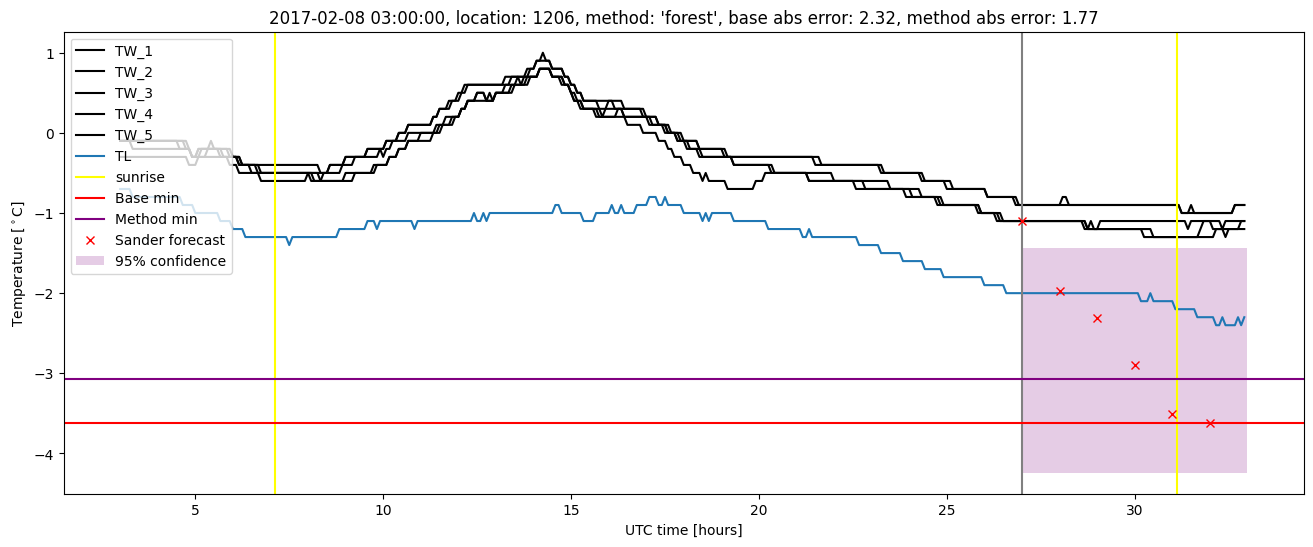
| baseline |
winter 2017 |
0.974 |
0.028 |
0.496 |
0.491 |
2.914 |
NaN |
NaN |
| forest |
winter 2017 |
1.000 |
0.028 |
0.366 |
0.435 |
2.072 |
0.492 |
4.712 |
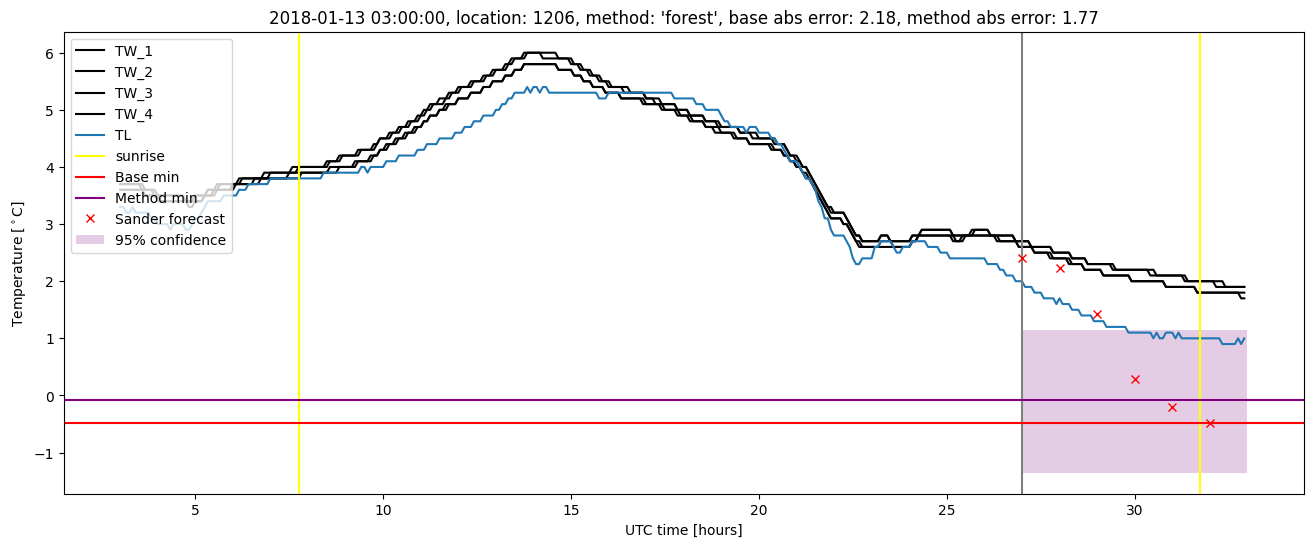
| baseline |
winter 2018 |
0.961 |
0.036 |
0.414 |
0.459 |
2.184 |
NaN |
NaN |
| forest |
winter 2018 |
0.951 |
0.000e+00 |
0.367 |
0.448 |
2.098 |
0.500 |
3.504 |
| baseline |
winter 2019 |
1.000 |
0.071 |
0.336 |
0.429 |
2.440 |
NaN |
NaN |
| forest |
winter 2019 |
1.000 |
0.071 |
0.246 |
0.388 |
1.374 |
0.502 |
3.437 |
| baseline |
all |
0.983 |
0.038 |
0.395 |
0.455 |
2.914 |
NaN |
NaN |
| forest |
all |
0.989 |
0.029 |
0.309 |
0.410 |
2.098 |
0.491 |
3.633 |
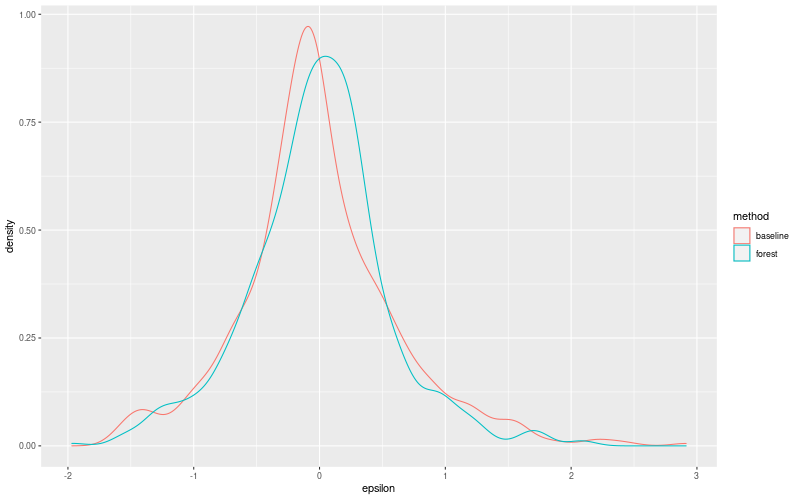
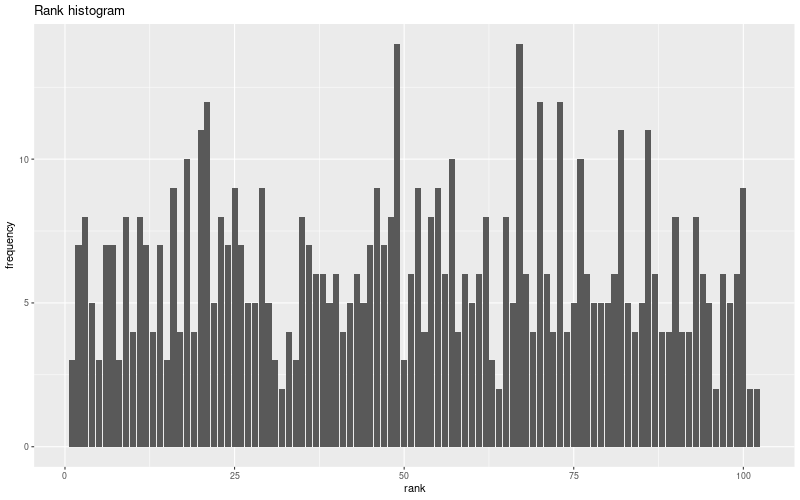
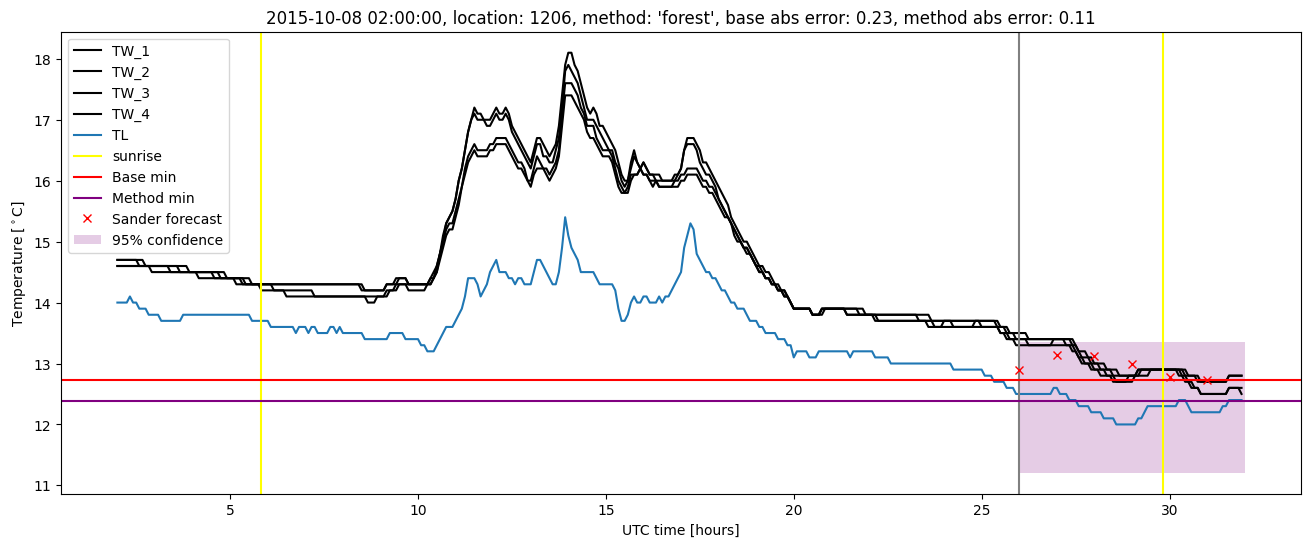
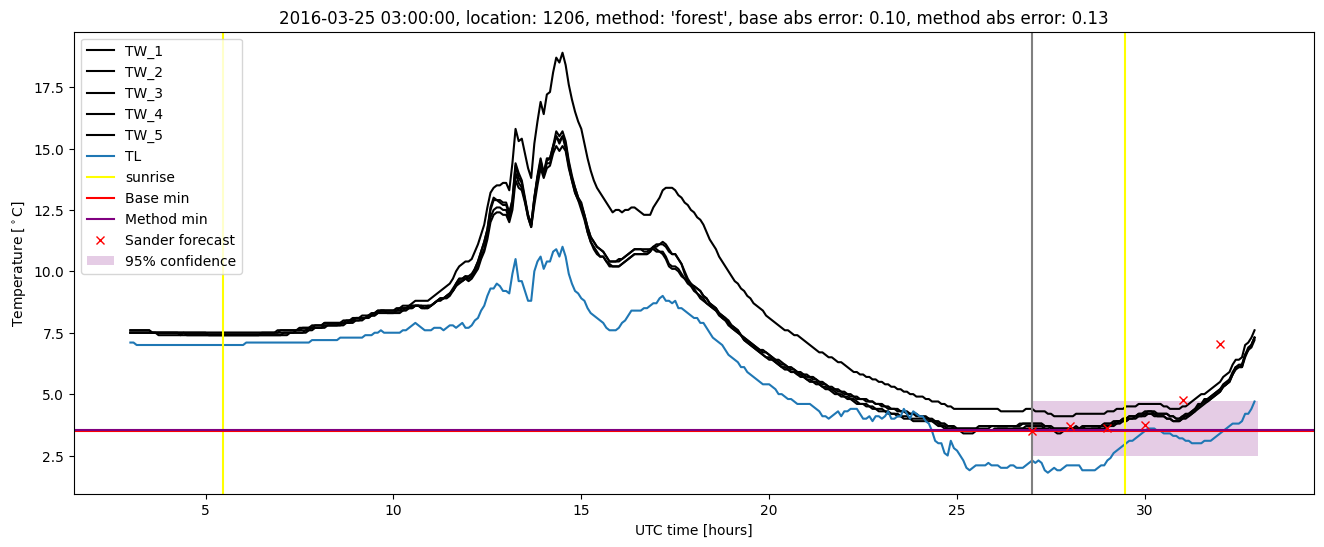
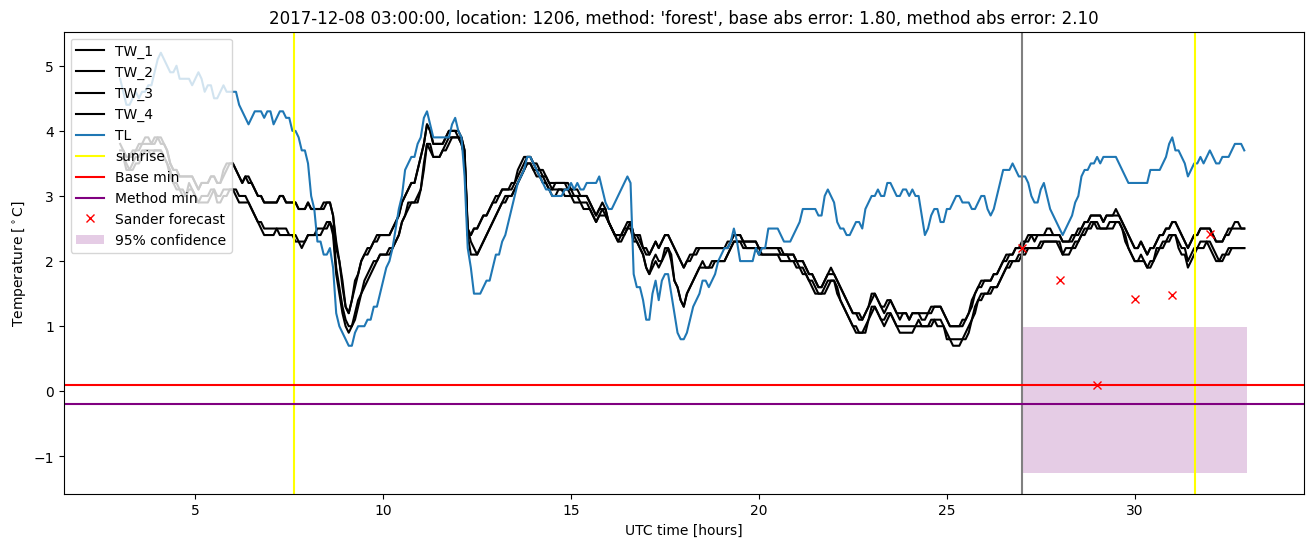
Random forest plots
Extended logistic regression results
| names |
period |
power |
significance |
meanSquareError |
absError |
maxError |
CRPS |
IGN |
| baseline |
winter 2016 |
0.989 |
0.037 |
0.350 |
0.444 |
1.632 |
NaN |
NaN |
| elr |
winter 2016 |
0.983 |
0.074 |
0.270 |
0.416 |
1.464 |
0.607 |
4.375 |
| baseline |
winter 2017 |
0.974 |
0.028 |
0.496 |
0.491 |
2.914 |
NaN |
NaN |
| elr |
winter 2017 |
0.974 |
0.028 |
0.456 |
0.483 |
2.932 |
0.555 |
4.754 |
| baseline |
winter 2018 |
0.961 |
0.036 |
0.414 |
0.459 |
2.184 |
NaN |
NaN |
| elr |
winter 2018 |
0.971 |
0.071 |
0.371 |
0.469 |
2.021 |
0.557 |
4.100 |
| baseline |
winter 2019 |
1.000 |
0.071 |
0.336 |
0.429 |
2.440 |
NaN |
NaN |
| elr |
winter 2019 |
1.000 |
0.143 |
0.301 |
0.439 |
1.648 |
0.557 |
3.853 |
| baseline |
all |
0.983 |
0.038 |
0.395 |
0.455 |
2.914 |
NaN |
NaN |
| elr |
all |
0.983 |
0.067 |
0.343 |
0.448 |
2.932 |
0.573 |
4.291 |
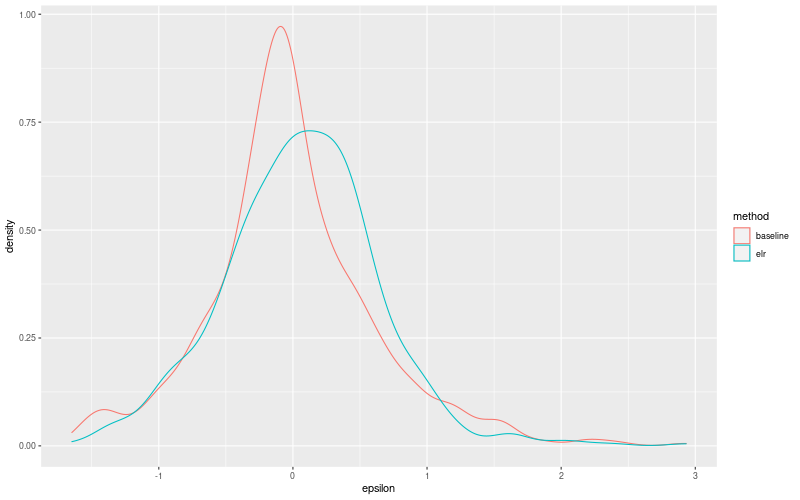
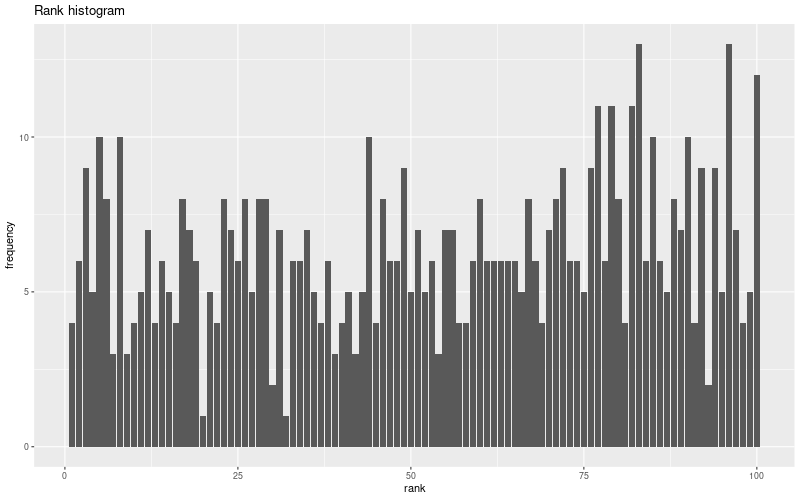
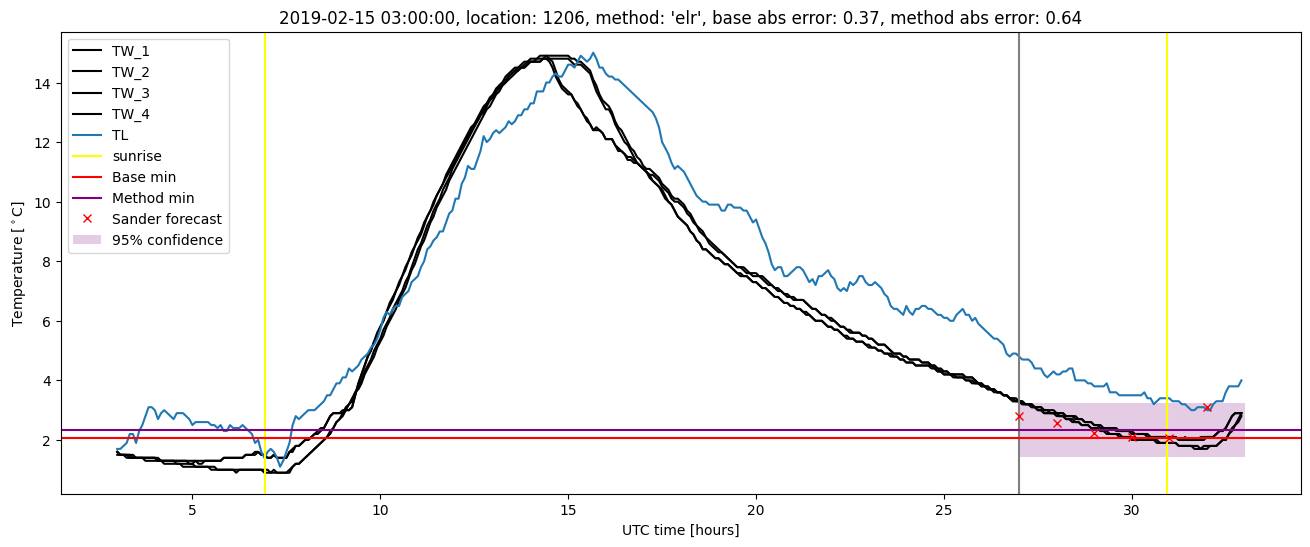
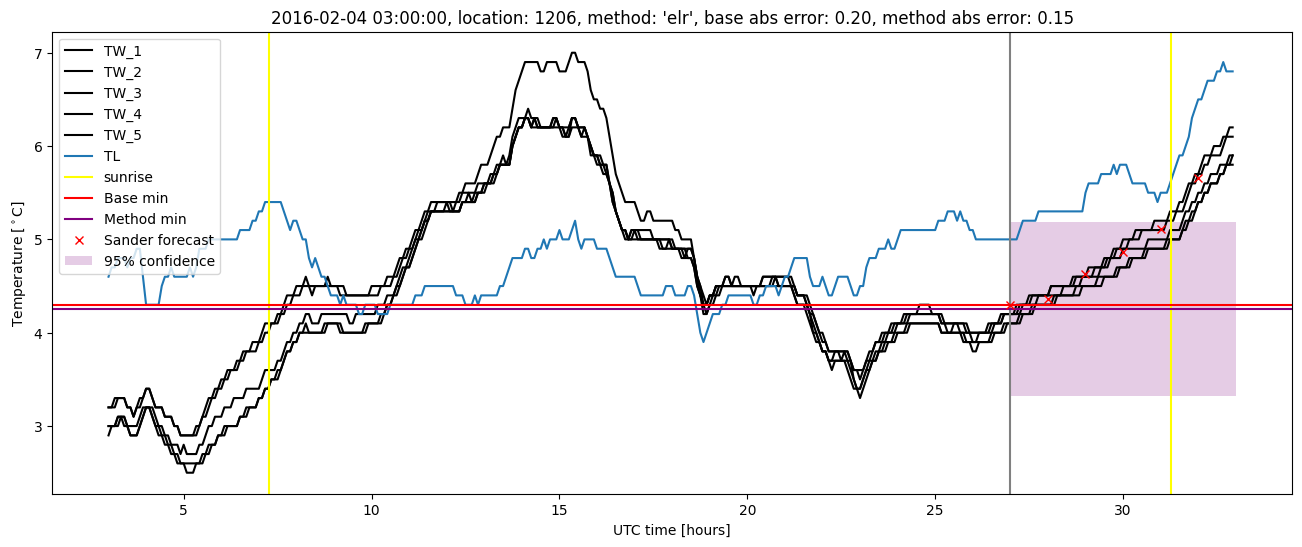
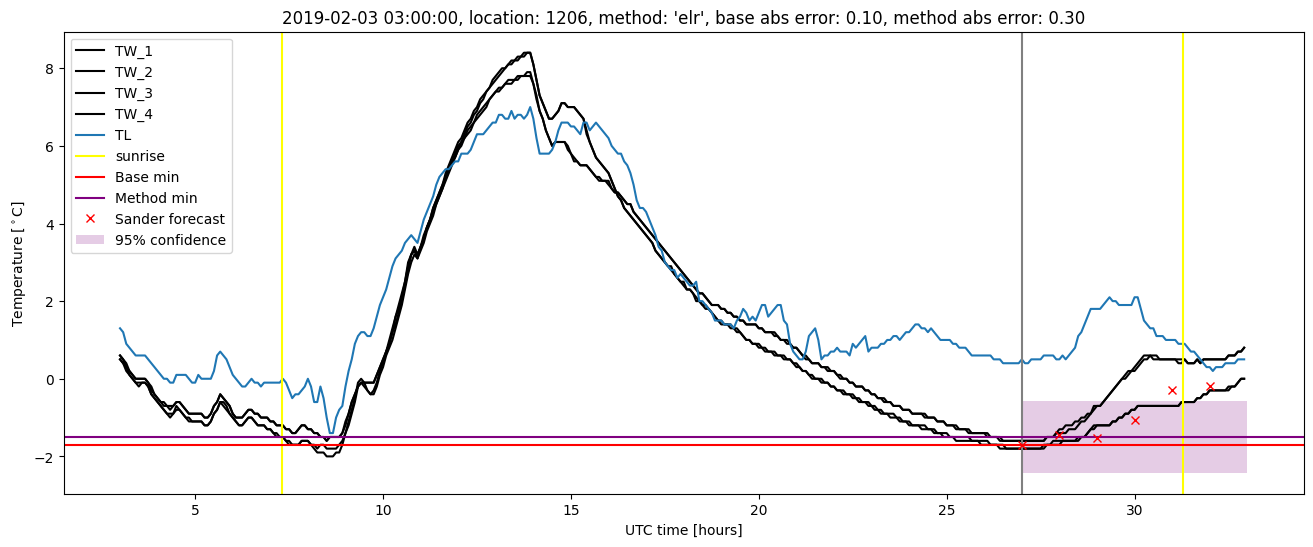
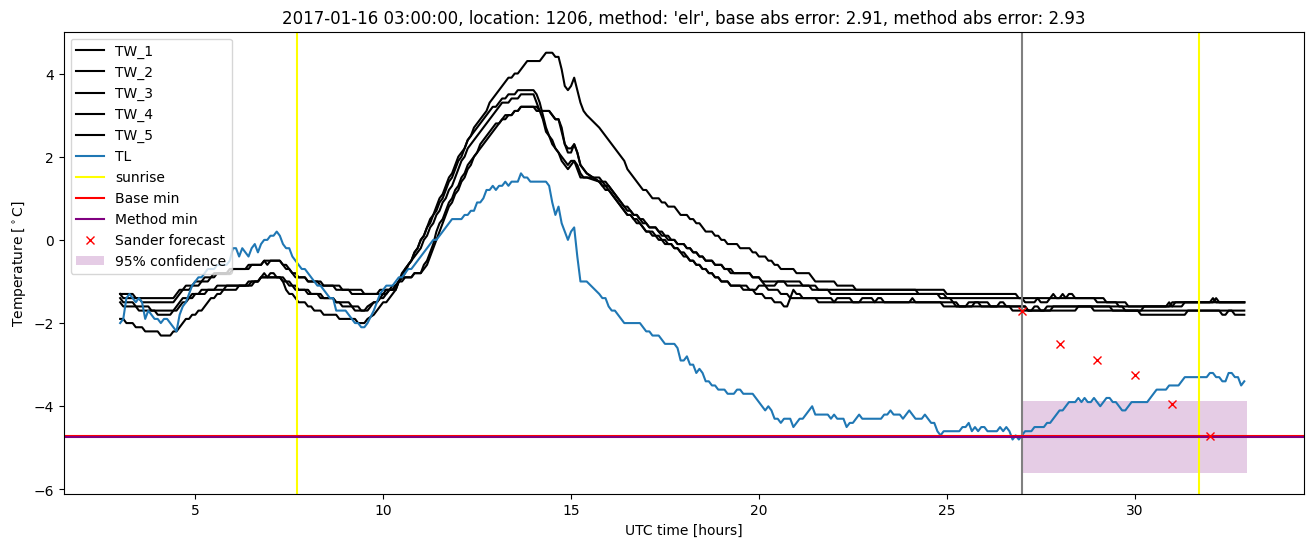
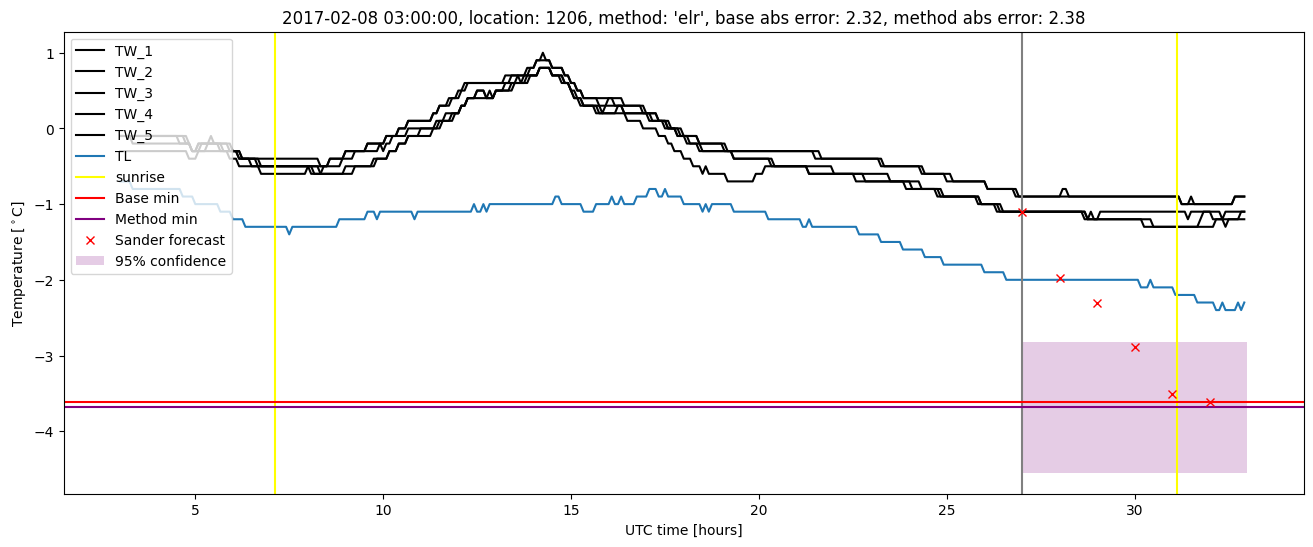
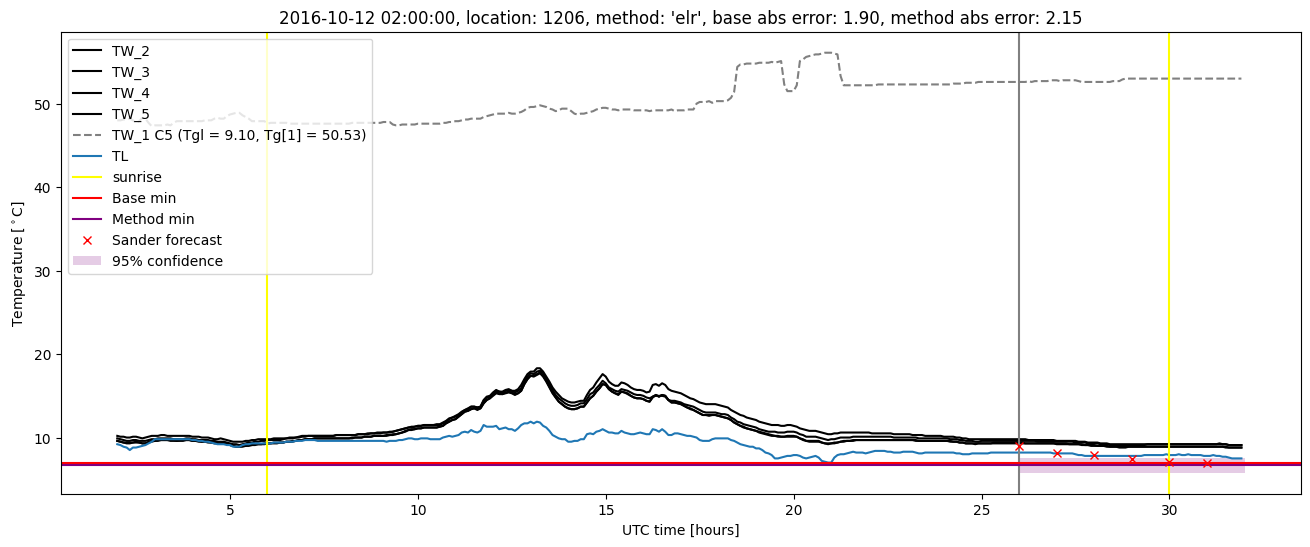
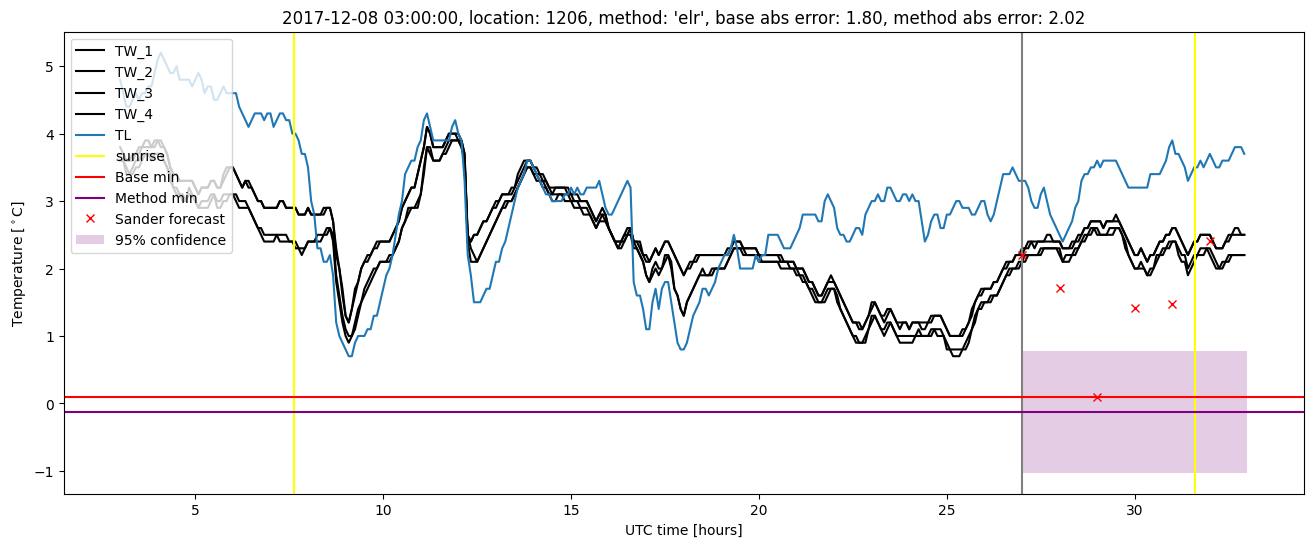
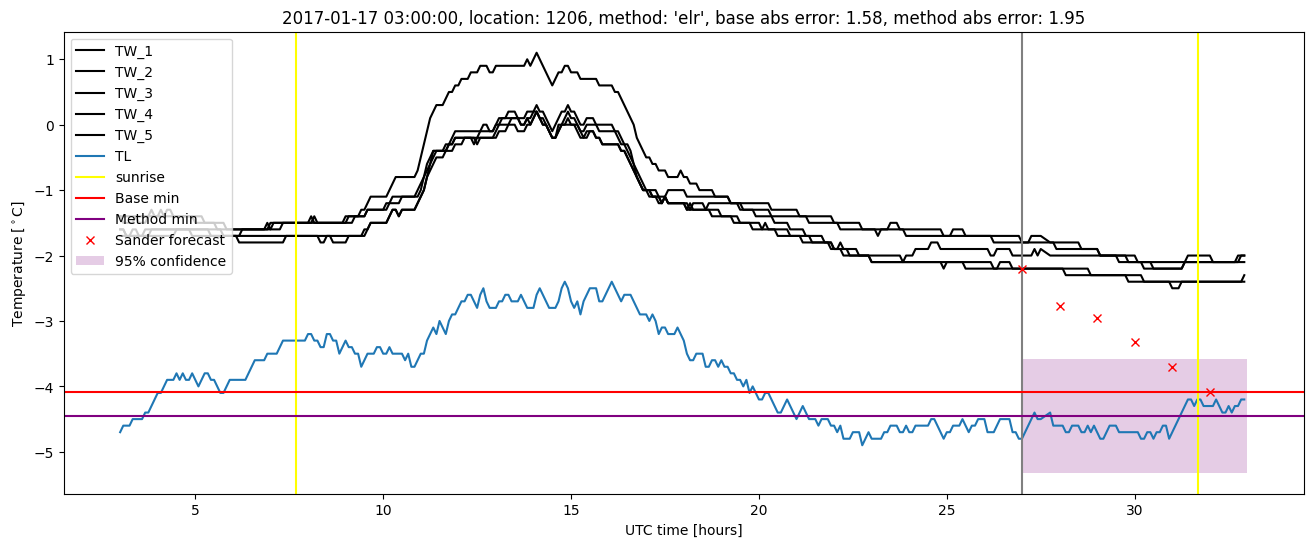
Extended logistic regression plots