GMS location: 1205
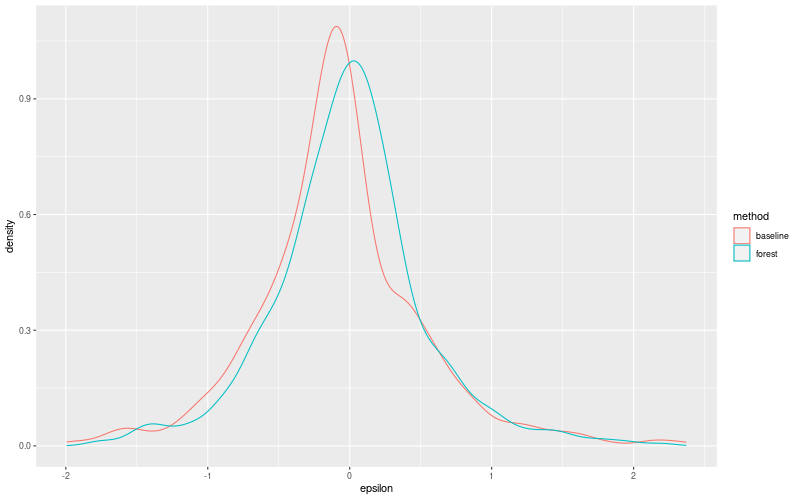
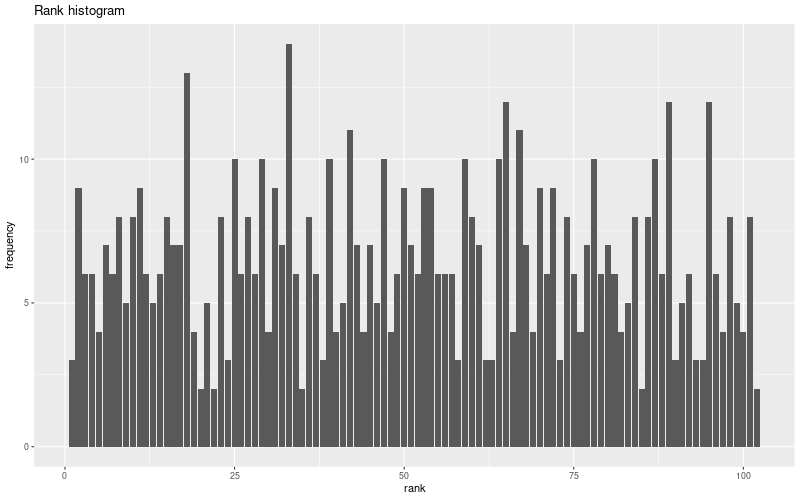
Random forest results
| names |
period |
power |
significance |
meanSquareError |
absError |
maxError |
CRPS |
IGN |
| baseline |
winter 2016 |
0.988 |
0.031 |
0.338 |
0.423 |
1.991 |
NaN |
NaN |
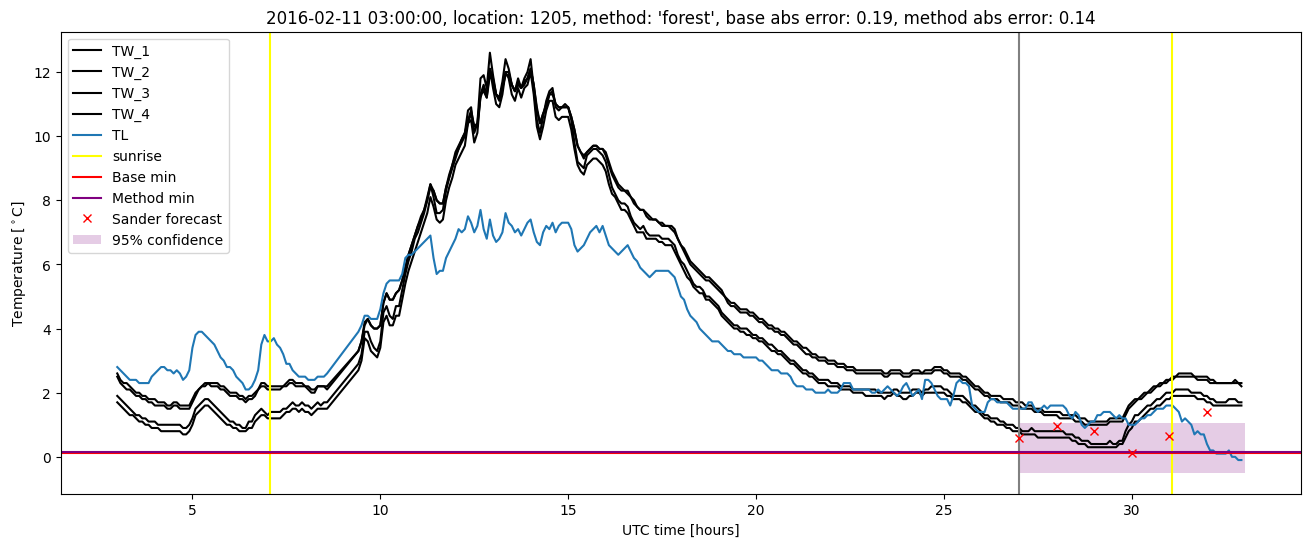
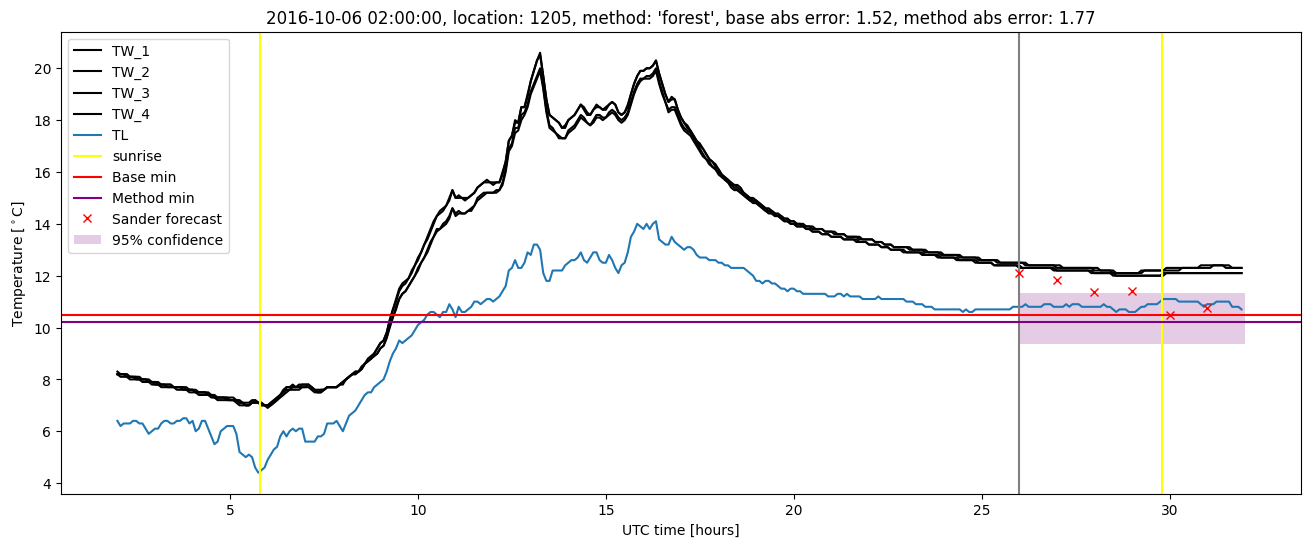
| forest |
winter 2016 |
1.000 |
0.031 |
0.255 |
0.368 |
1.775 |
0.513 |
4.366 |
| baseline |
winter 2017 |
1.000 |
0.029 |
0.446 |
0.477 |
2.368 |
NaN |
NaN |
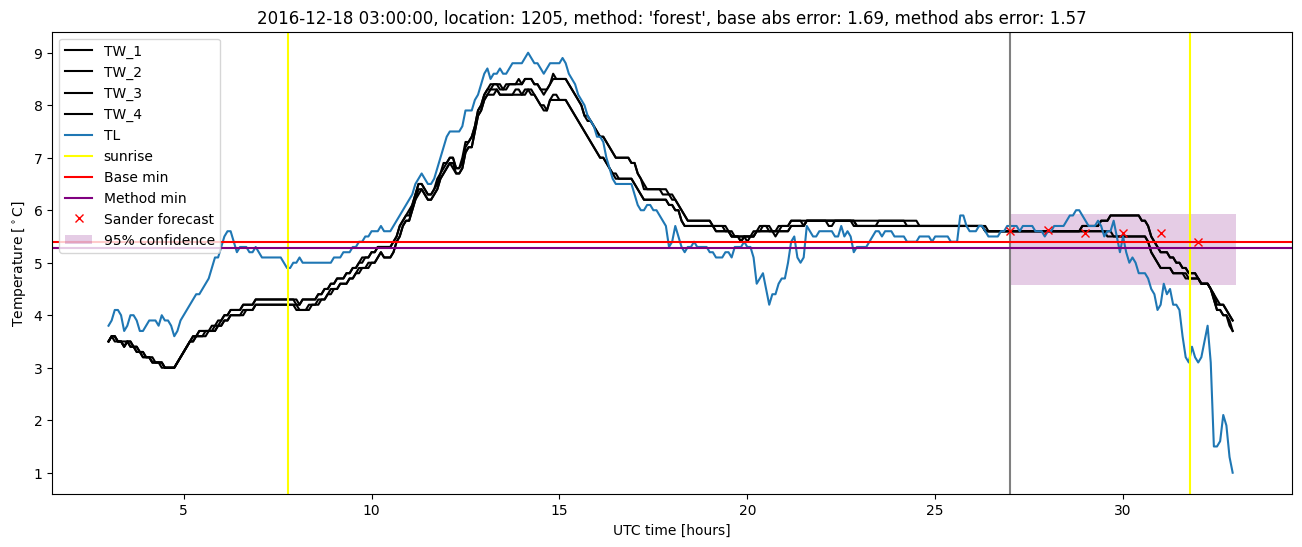
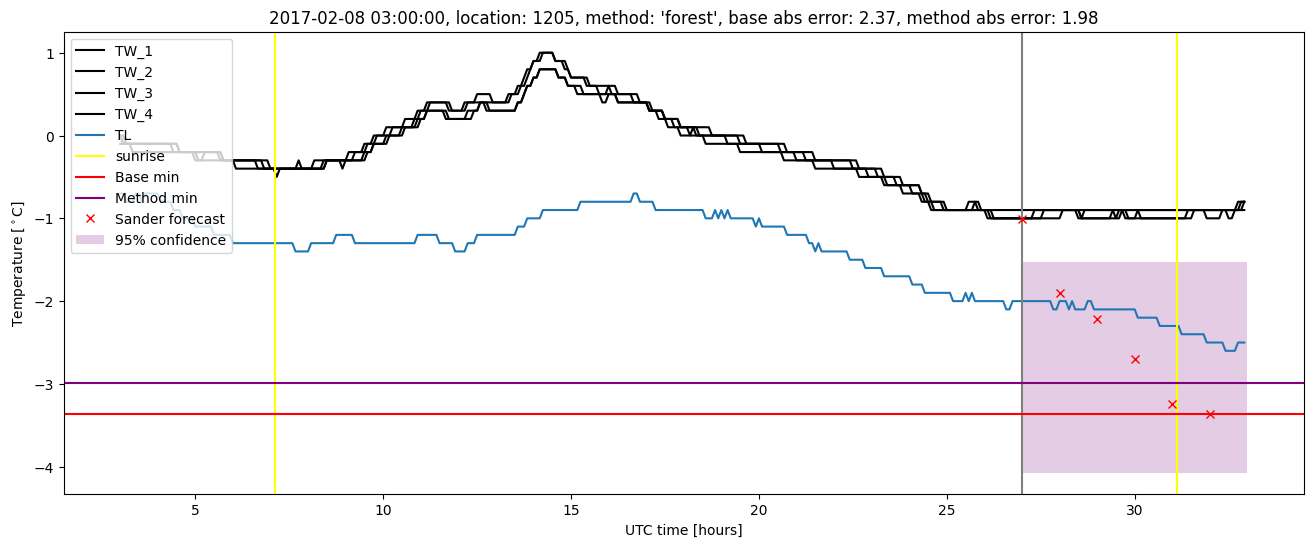
| forest |
winter 2017 |
0.992 |
0.029 |
0.376 |
0.434 |
1.984 |
0.512 |
5.159 |
| baseline |
winter 2018 |
0.993 |
0.036 |
0.345 |
0.423 |
2.253 |
NaN |
NaN |
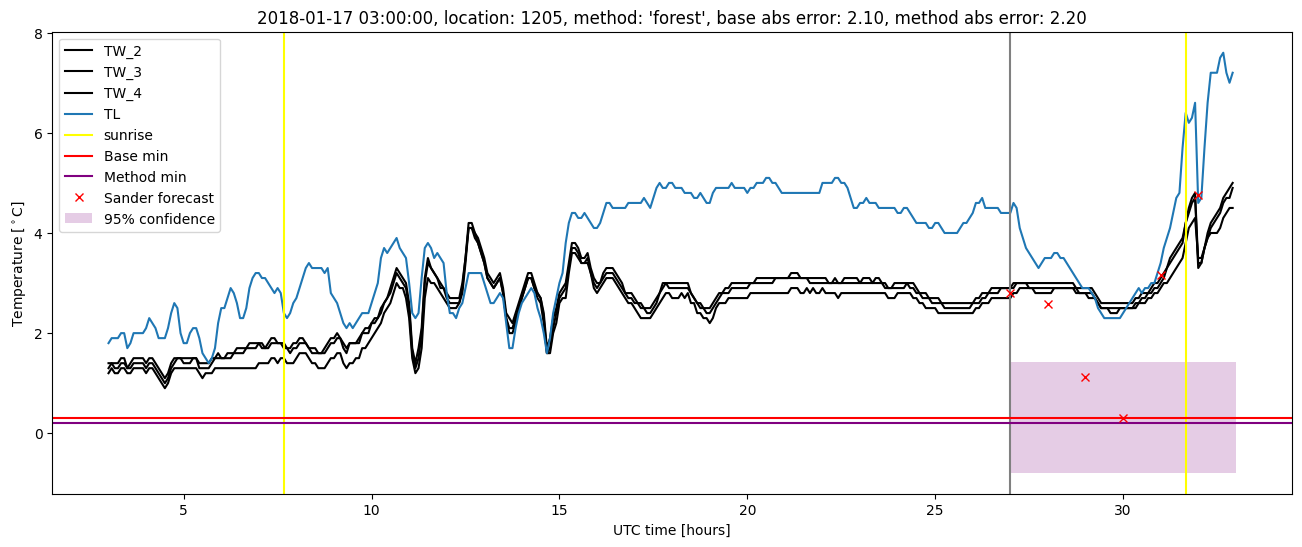
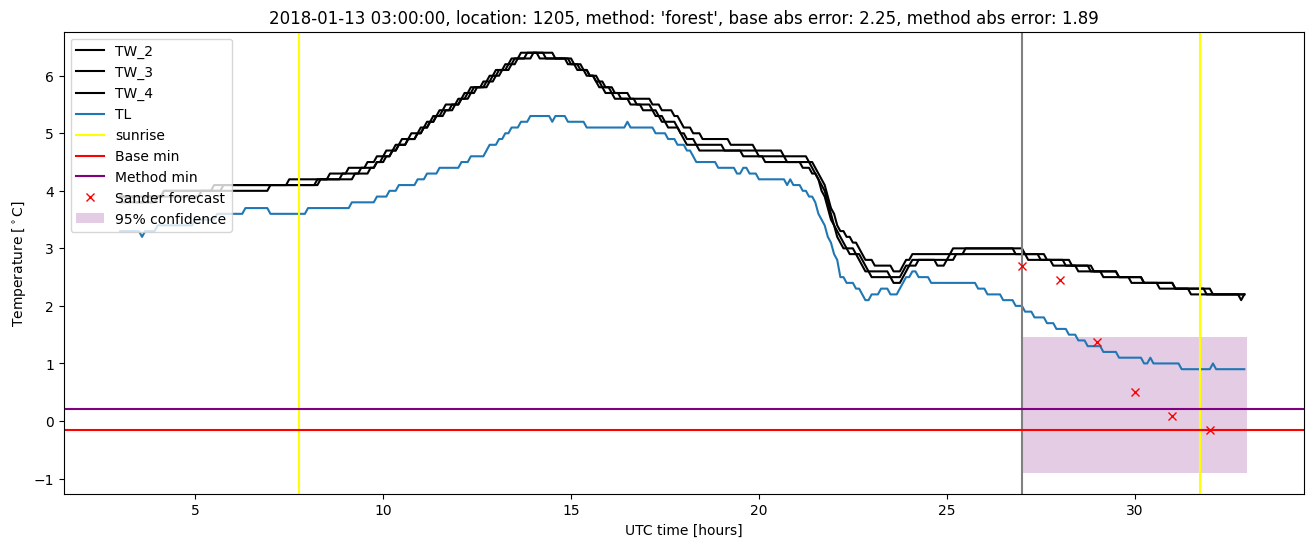
| forest |
winter 2018 |
0.993 |
0.036 |
0.325 |
0.416 |
2.198 |
0.547 |
4.046 |
| baseline |
winter 2019 |
1.000 |
0.077 |
0.228 |
0.351 |
1.838 |
NaN |
NaN |
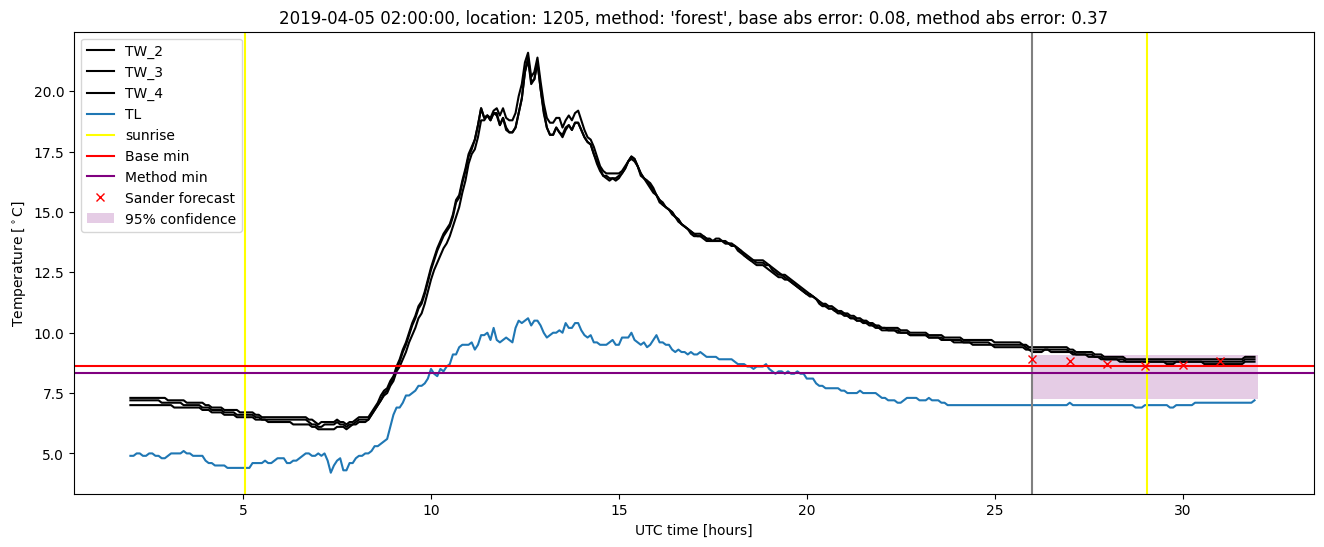
| forest |
winter 2019 |
1.000 |
0.077 |
0.190 |
0.334 |
1.286 |
0.525 |
3.644 |
| baseline |
all |
0.995 |
0.037 |
0.340 |
0.419 |
2.368 |
NaN |
NaN |
| forest |
all |
0.996 |
0.037 |
0.286 |
0.388 |
2.198 |
0.524 |
4.306 |
Random forest plots

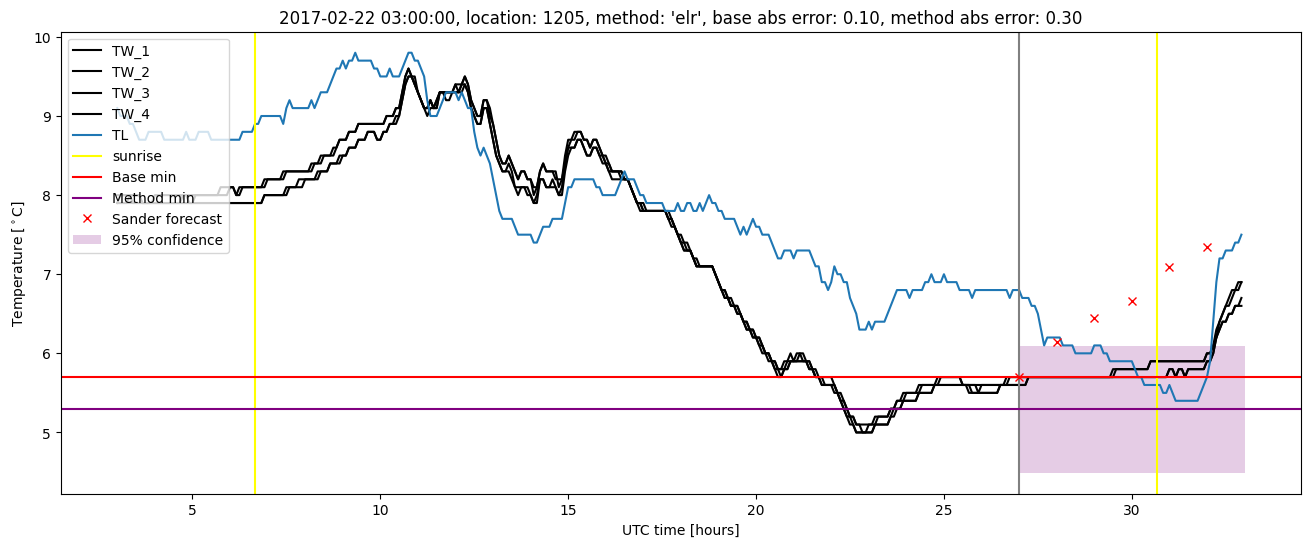
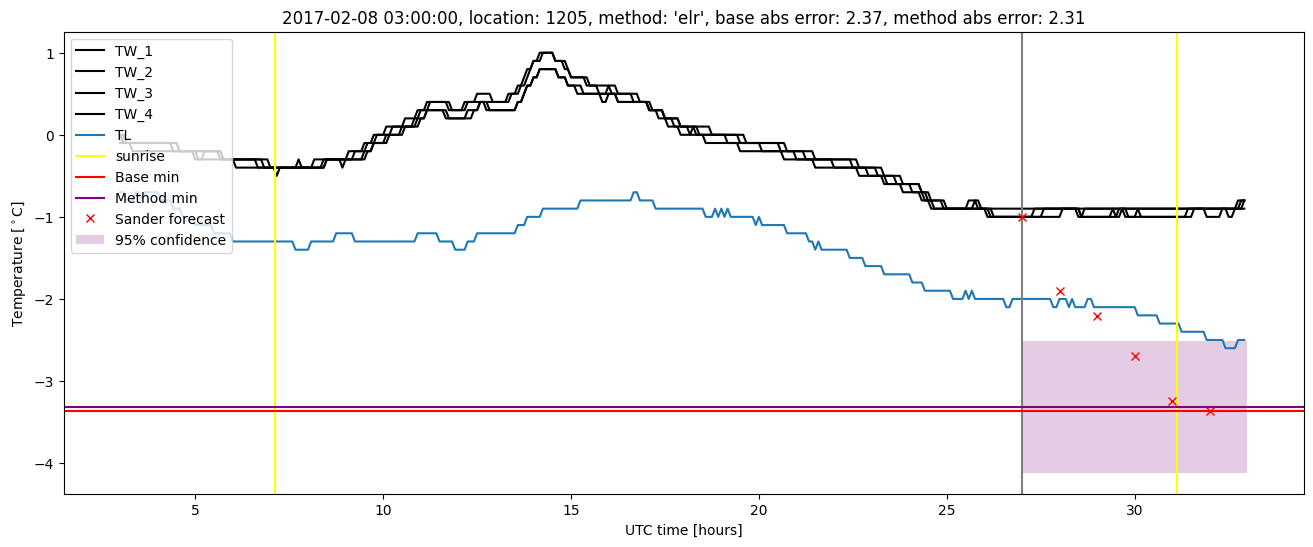
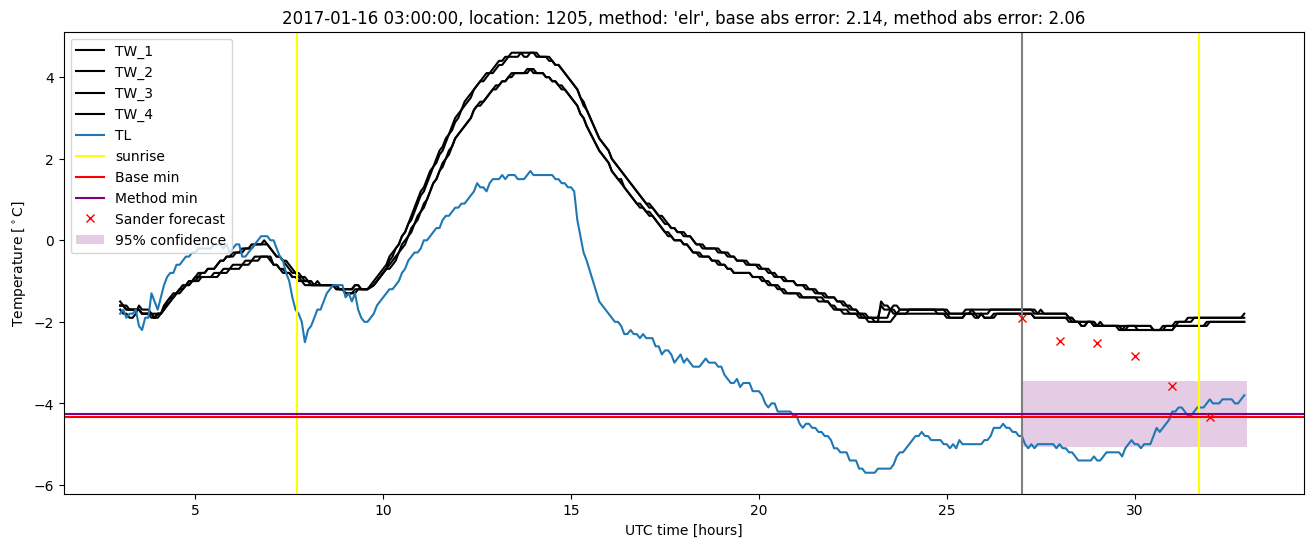
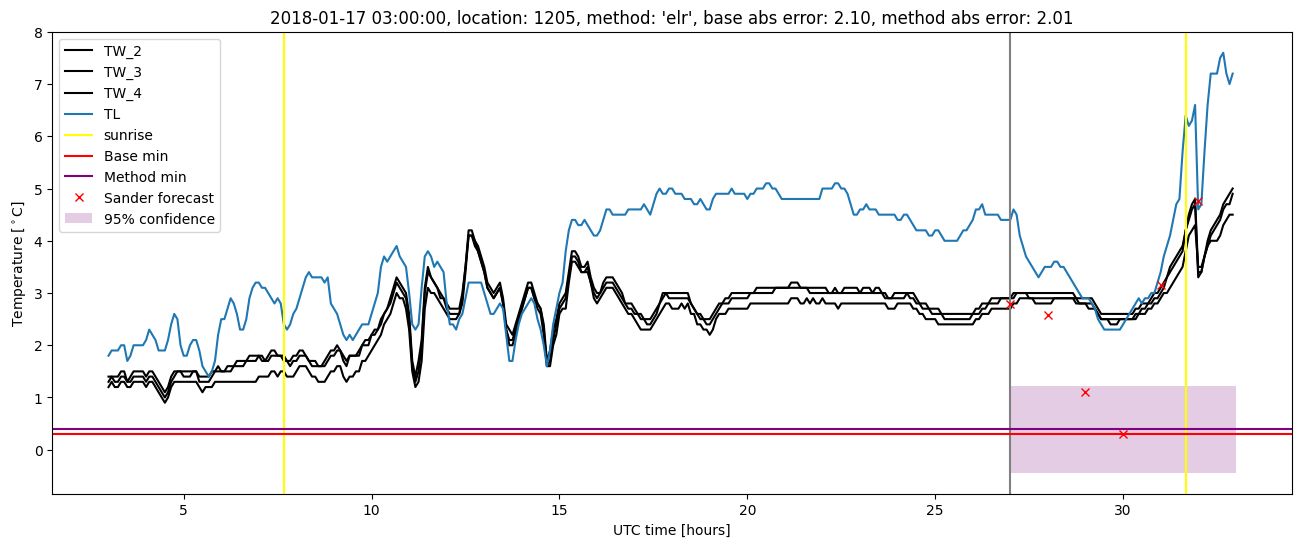
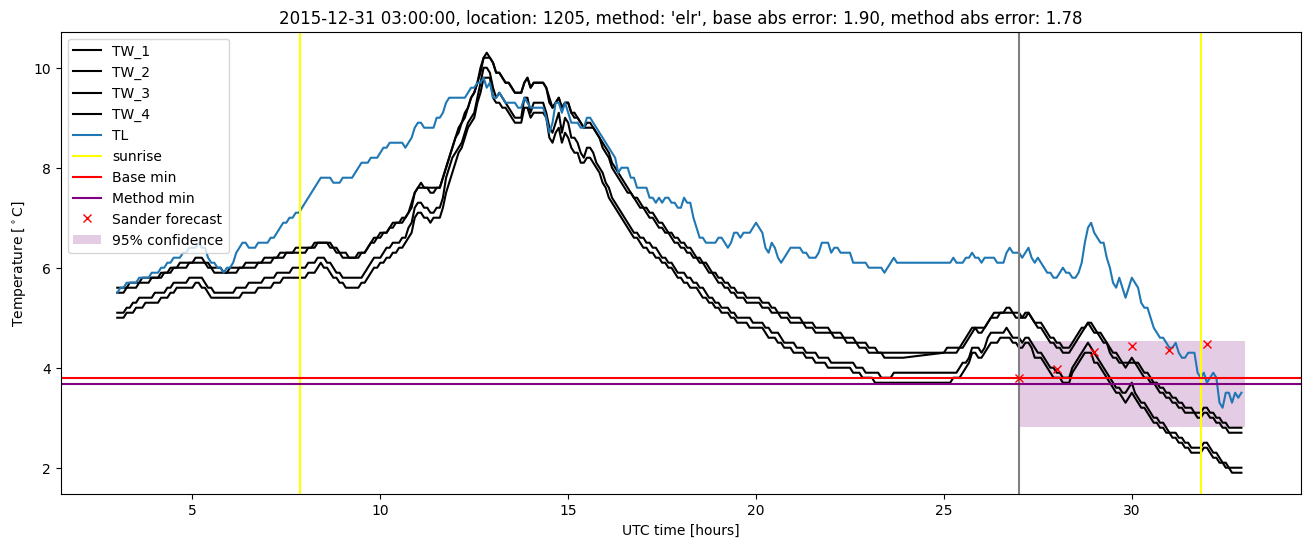
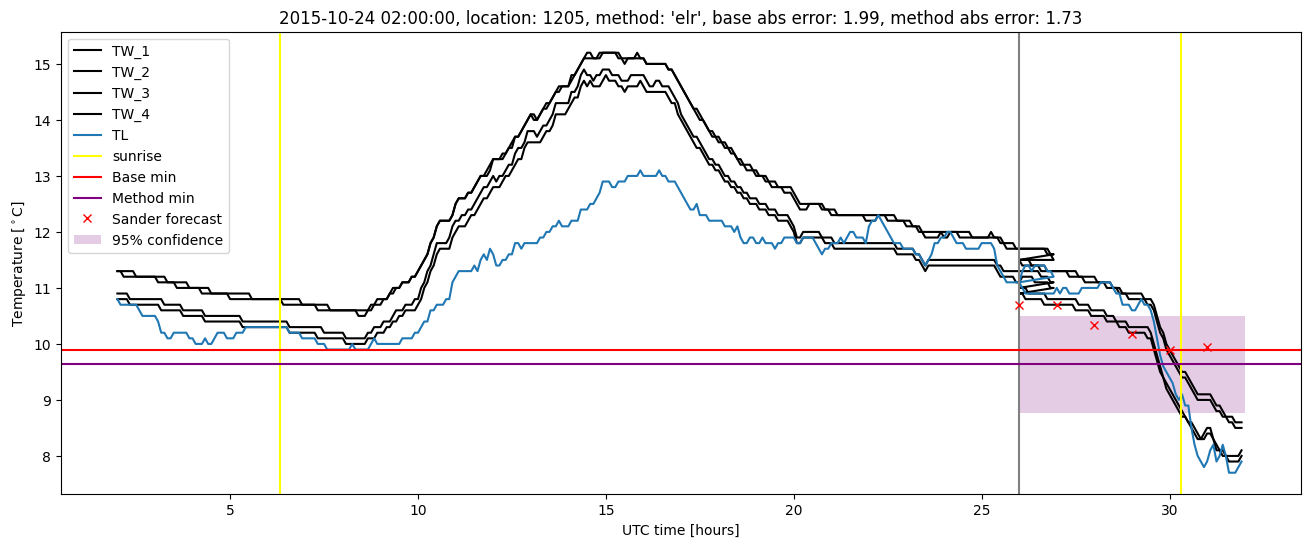
Extended logistic regression results
| names |
period |
power |
significance |
meanSquareError |
absError |
maxError |
CRPS |
IGN |
| baseline |
winter 2016 |
0.988 |
0.031 |
0.338 |
0.423 |
1.991 |
NaN |
NaN |
| elr |
winter 2016 |
0.982 |
0.094 |
0.259 |
0.395 |
1.778 |
0.606 |
5.506 |
| baseline |
winter 2017 |
1.000 |
0.029 |
0.446 |
0.477 |
2.368 |
NaN |
NaN |
| elr |
winter 2017 |
0.992 |
0.029 |
0.407 |
0.461 |
2.314 |
0.562 |
6.468 |
| baseline |
winter 2018 |
0.993 |
0.036 |
0.345 |
0.423 |
2.253 |
NaN |
NaN |
| elr |
winter 2018 |
0.993 |
0.000e+00 |
0.338 |
0.451 |
2.009 |
0.637 |
6.920 |
| baseline |
winter 2019 |
1.000 |
0.077 |
0.228 |
0.351 |
1.838 |
NaN |
NaN |
| elr |
winter 2019 |
1.000 |
0.077 |
0.231 |
0.388 |
1.490 |
0.585 |
5.425 |
| baseline |
all |
0.995 |
0.037 |
0.340 |
0.419 |
2.368 |
NaN |
NaN |
| elr |
all |
0.991 |
0.047 |
0.307 |
0.423 |
2.314 |
0.599 |
6.065 |
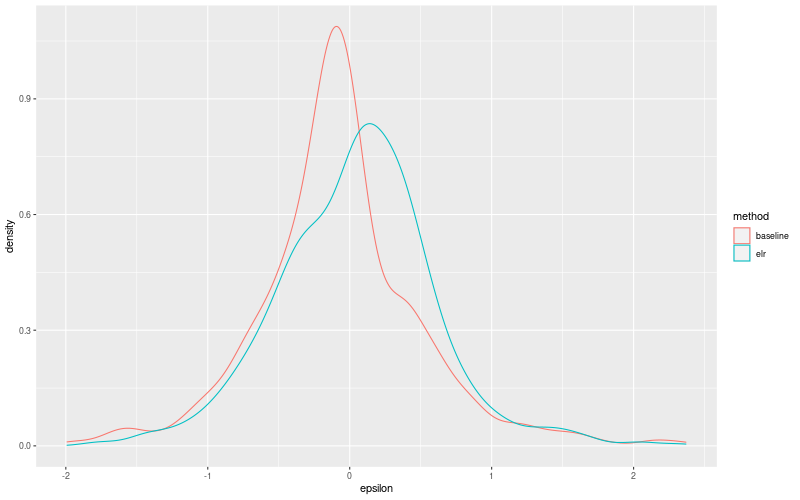
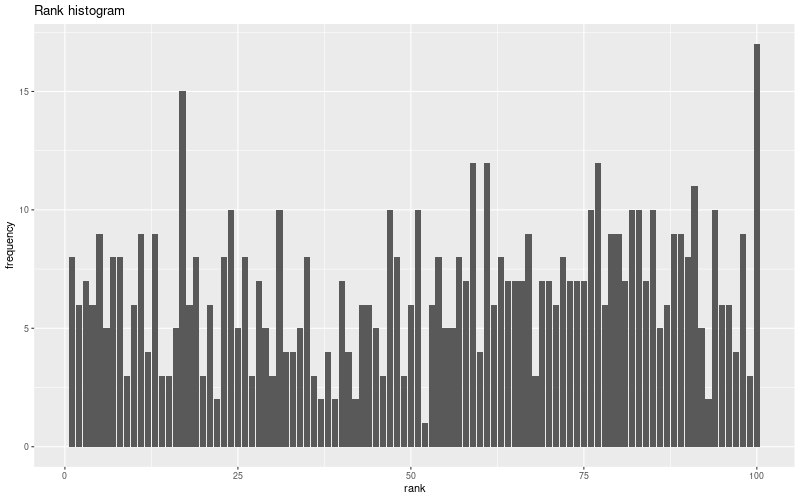
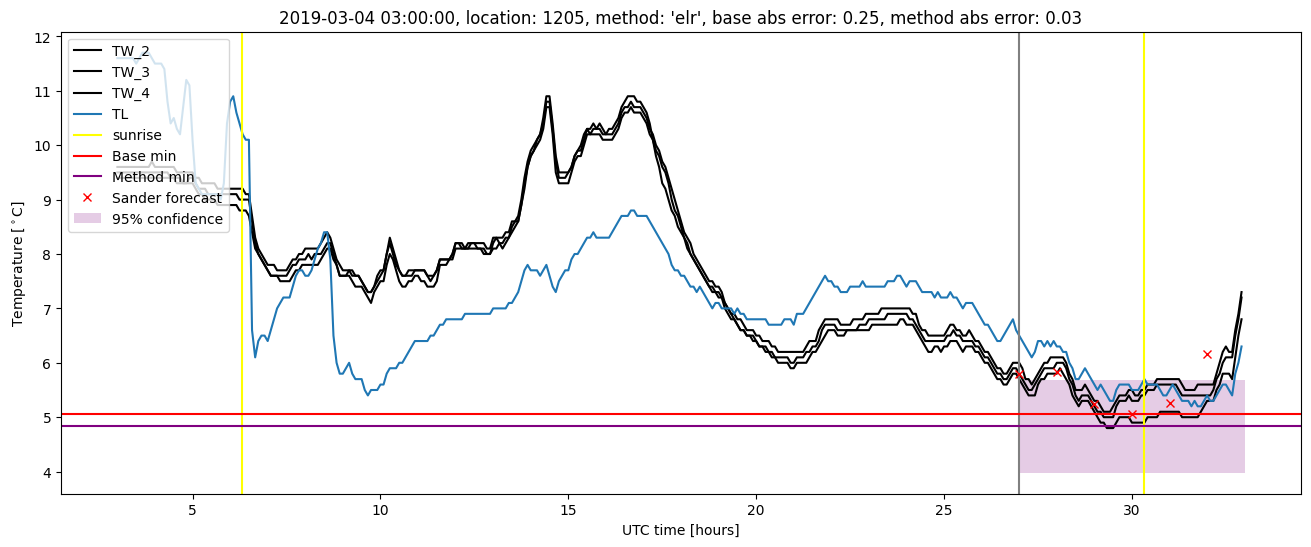
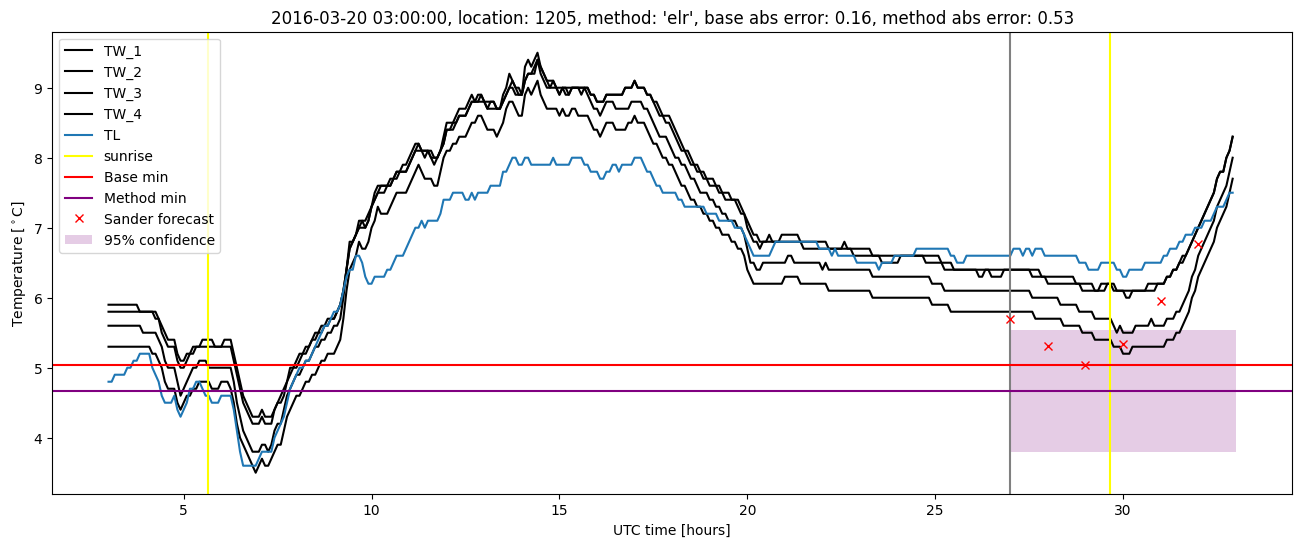
Extended logistic regression plots