GMS location: 1203
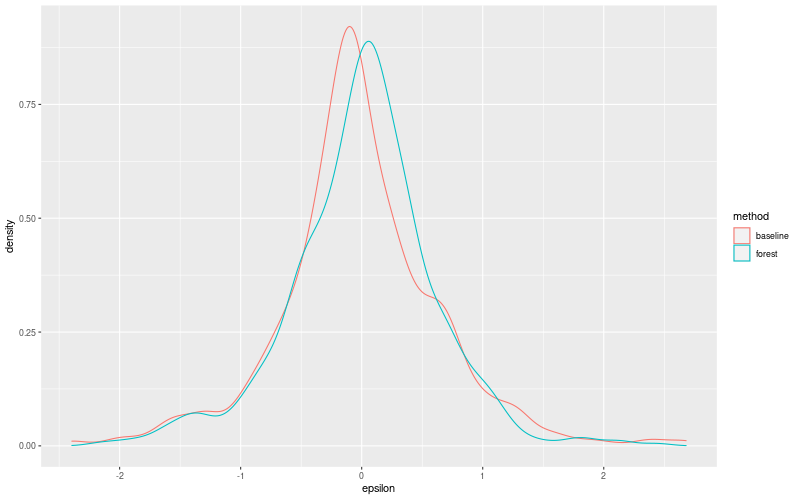
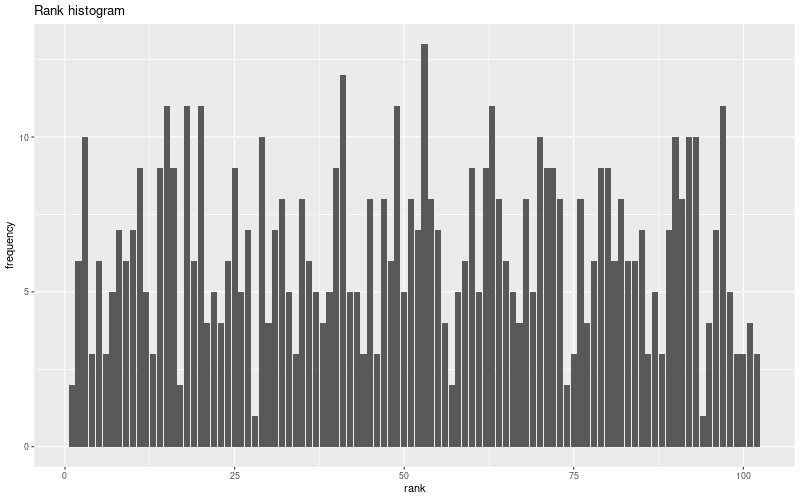
Random forest results
| names |
period |
power |
significance |
meanSquareError |
absError |
maxError |
CRPS |
IGN |
| baseline |
winter 2016 |
0.982 |
0.094 |
0.419 |
0.477 |
2.395 |
NaN |
NaN |
| forest |
winter 2016 |
0.988 |
0.062 |
0.319 |
0.410 |
2.167 |
0.479 |
2.207 |
| baseline |
winter 2017 |
0.991 |
0.029 |
0.722 |
0.620 |
2.681 |
NaN |
NaN |
| forest |
winter 2017 |
1.000 |
0.029 |
0.533 |
0.533 |
2.140 |
0.481 |
2.929 |
| baseline |
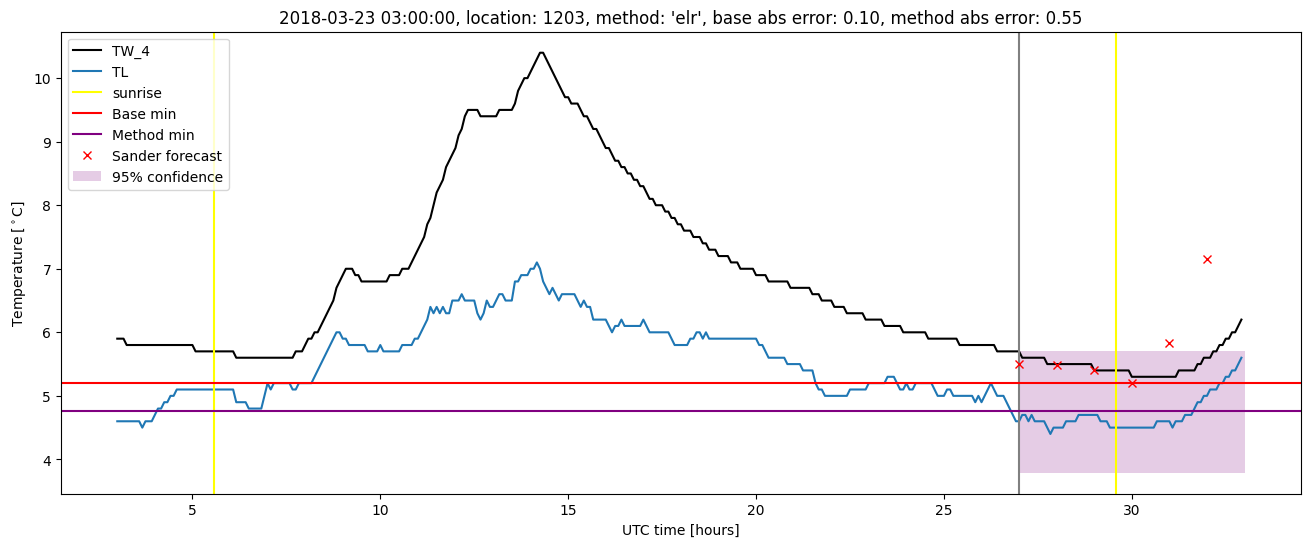
winter 2018 |
0.971 |
0.143 |
0.352 |
0.431 |
2.657 |
NaN |
NaN |
| forest |
winter 2018 |
0.978 |
0.071 |
0.339 |
0.447 |
2.435 |
0.503 |
1.945 |
| baseline |
winter 2019 |
1.000 |
0.083 |
0.314 |
0.398 |
1.900 |
NaN |
NaN |
| forest |
winter 2019 |
1.000 |
0.083 |
0.268 |
0.380 |
1.638 |
0.496 |
2.042 |
| baseline |
all |
0.985 |
0.085 |
0.447 |
0.480 |
2.681 |
NaN |
NaN |
| forest |
all |
0.991 |
0.057 |
0.361 |
0.441 |
2.435 |
0.490 |
2.266 |
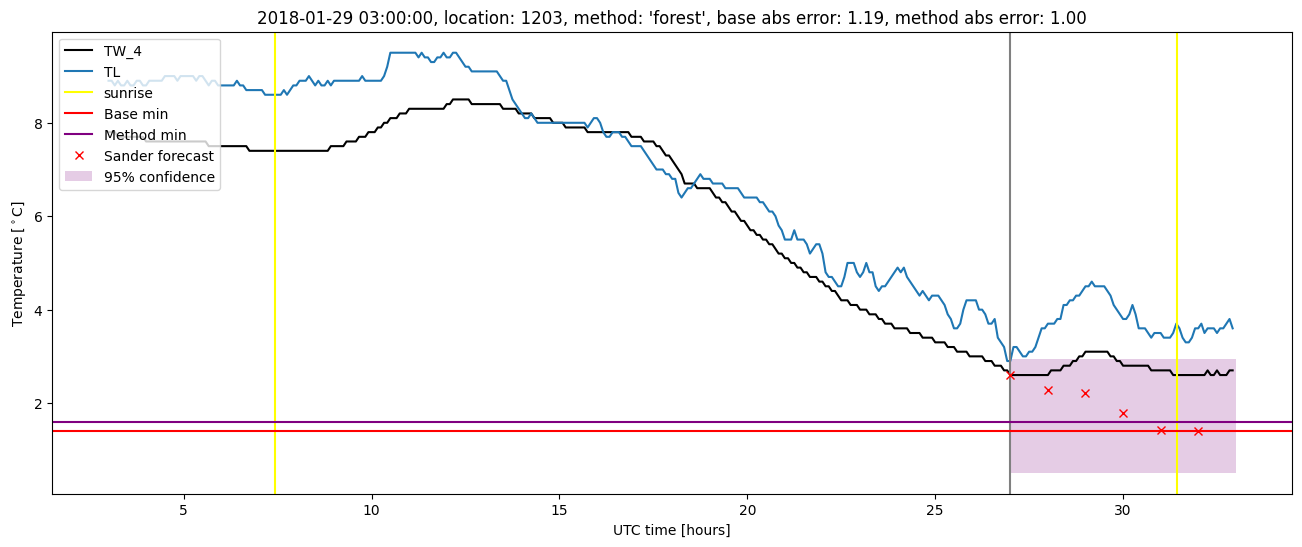
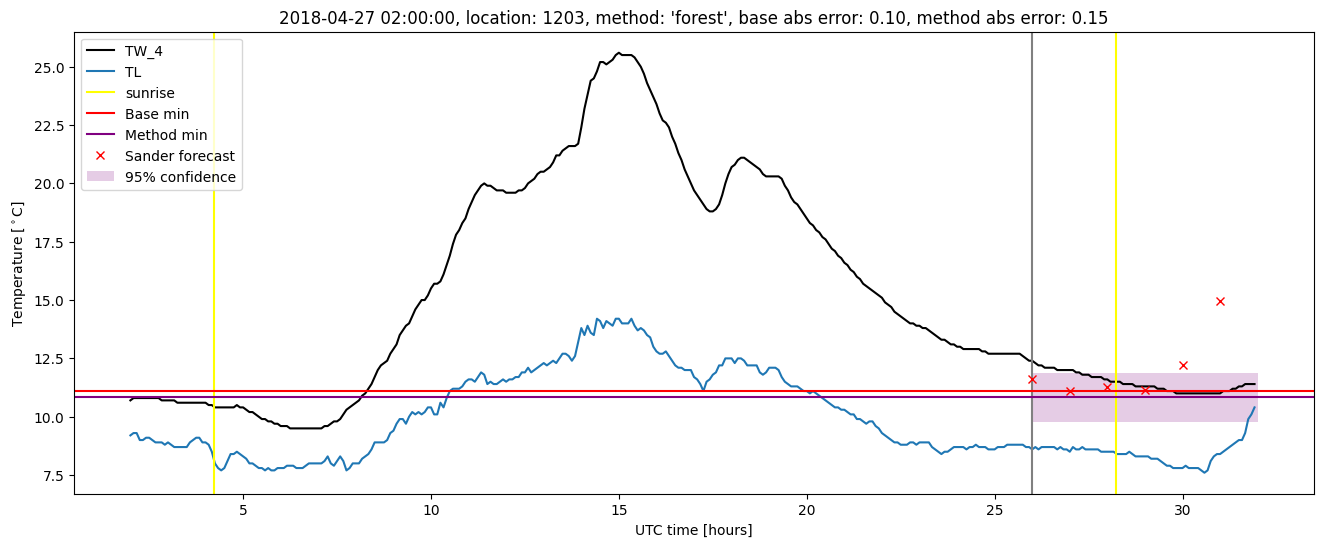
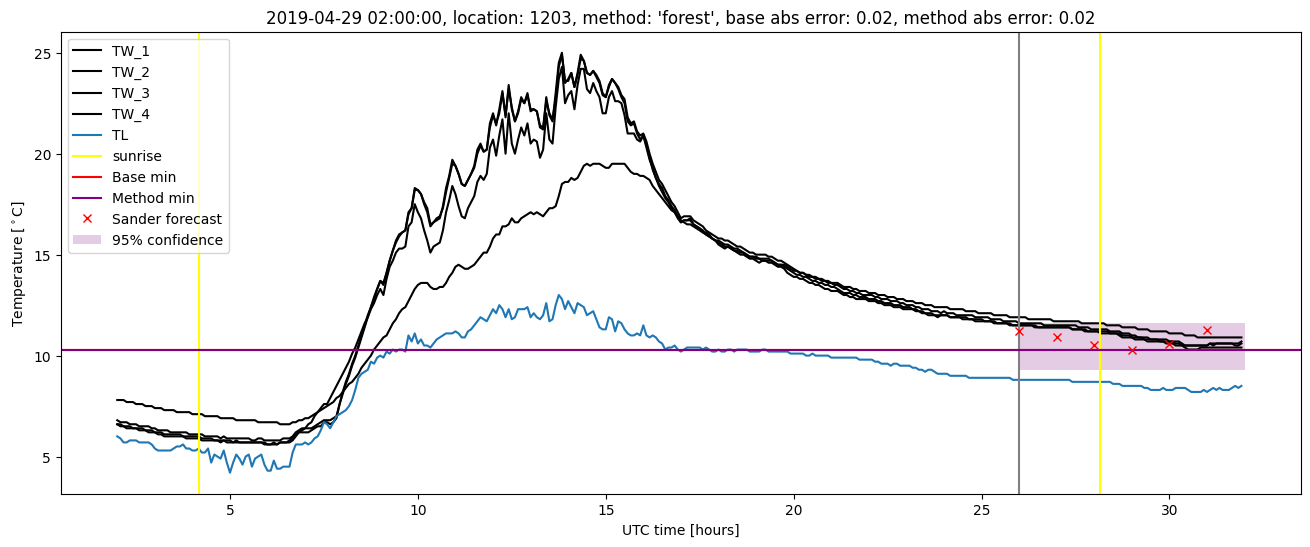
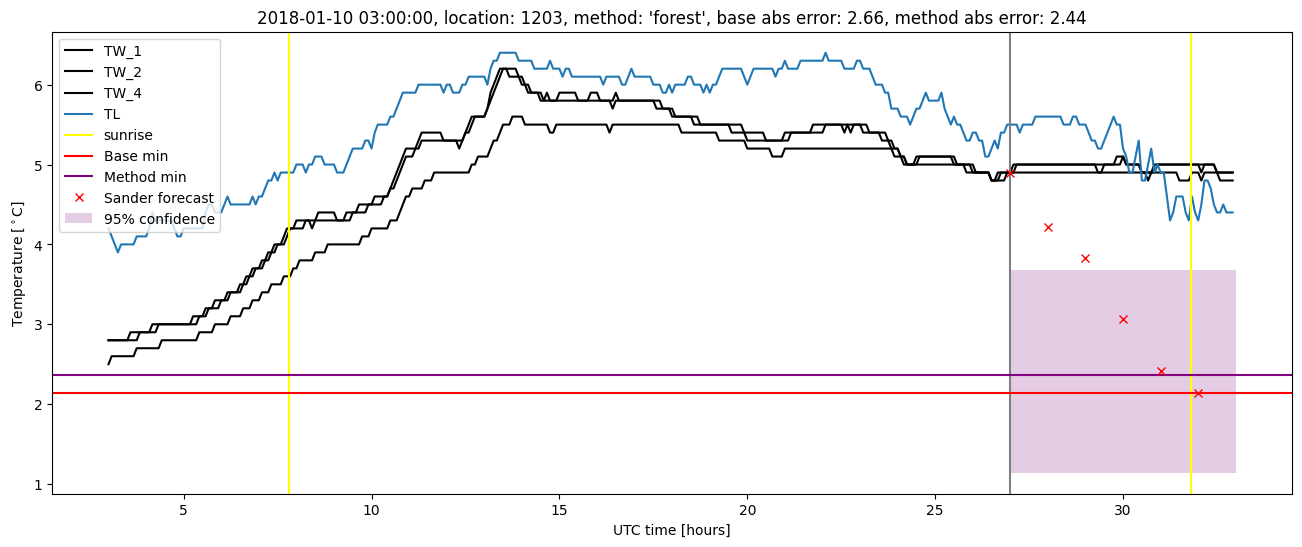
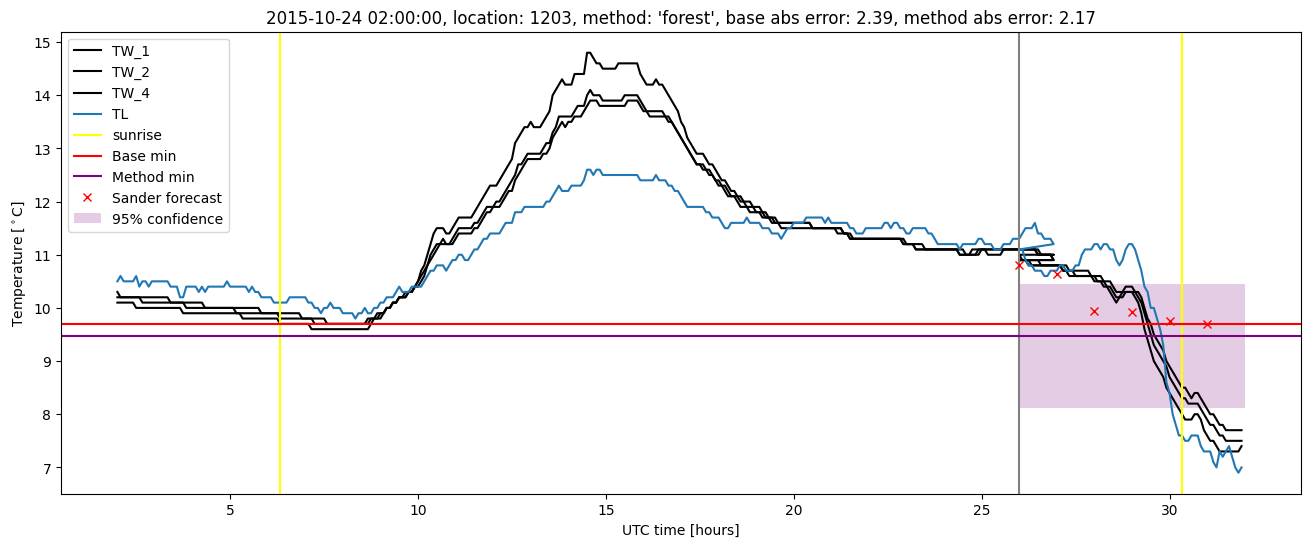
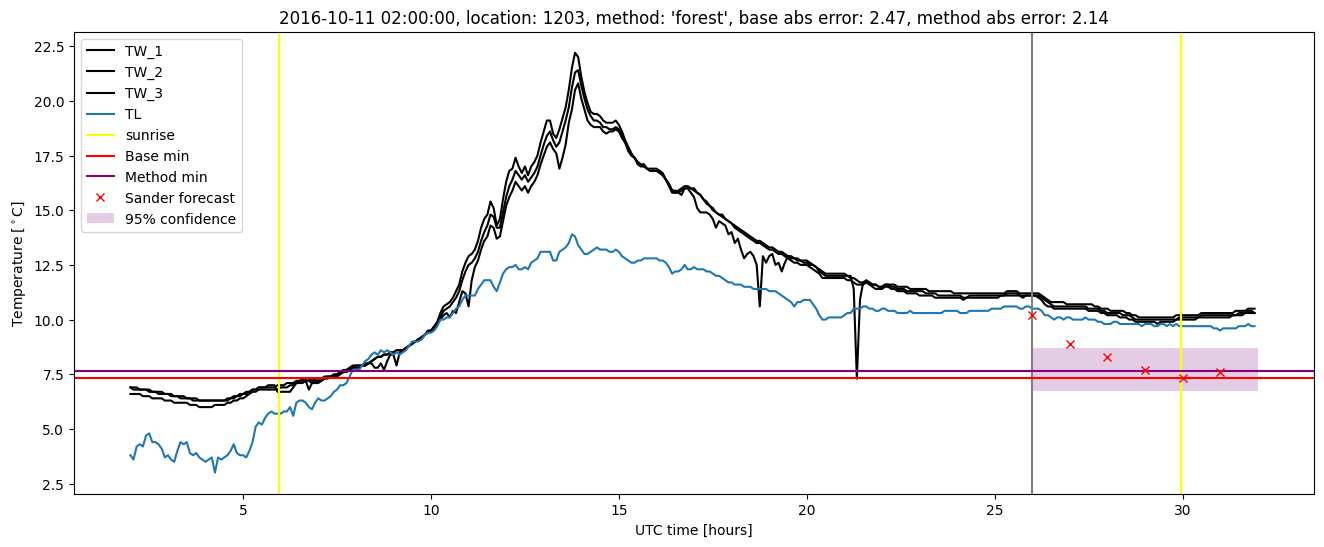
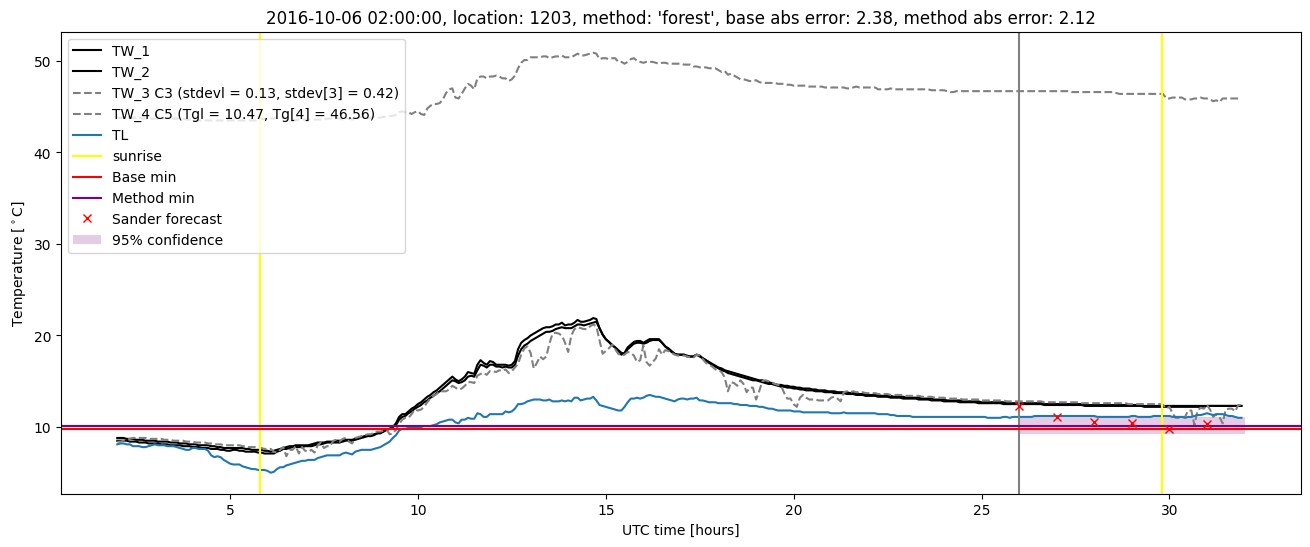
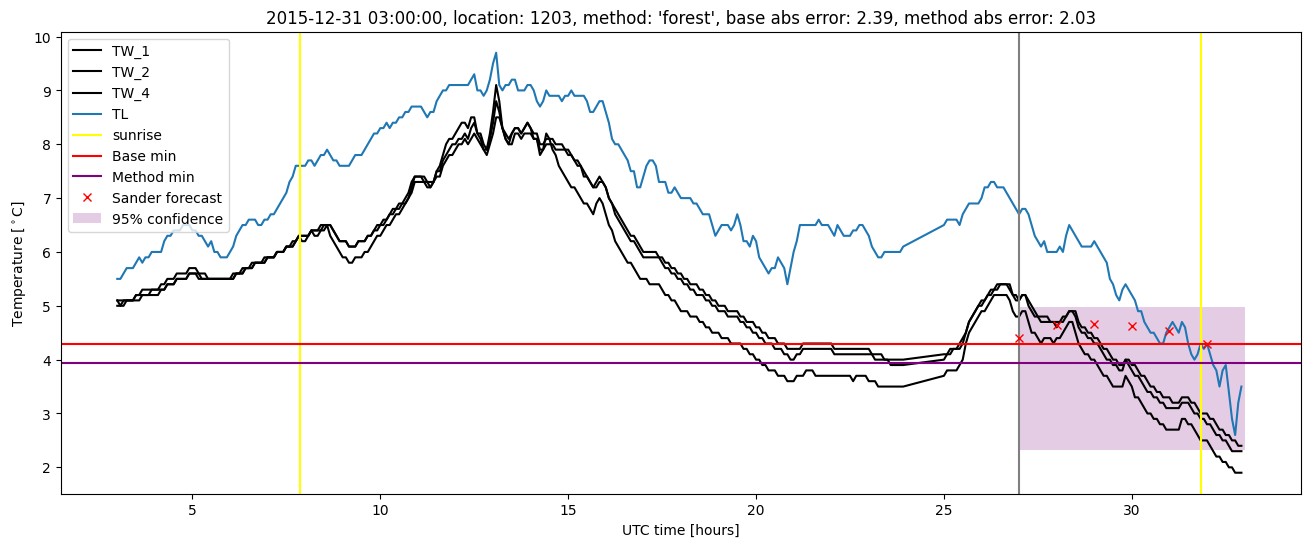
Random forest plots
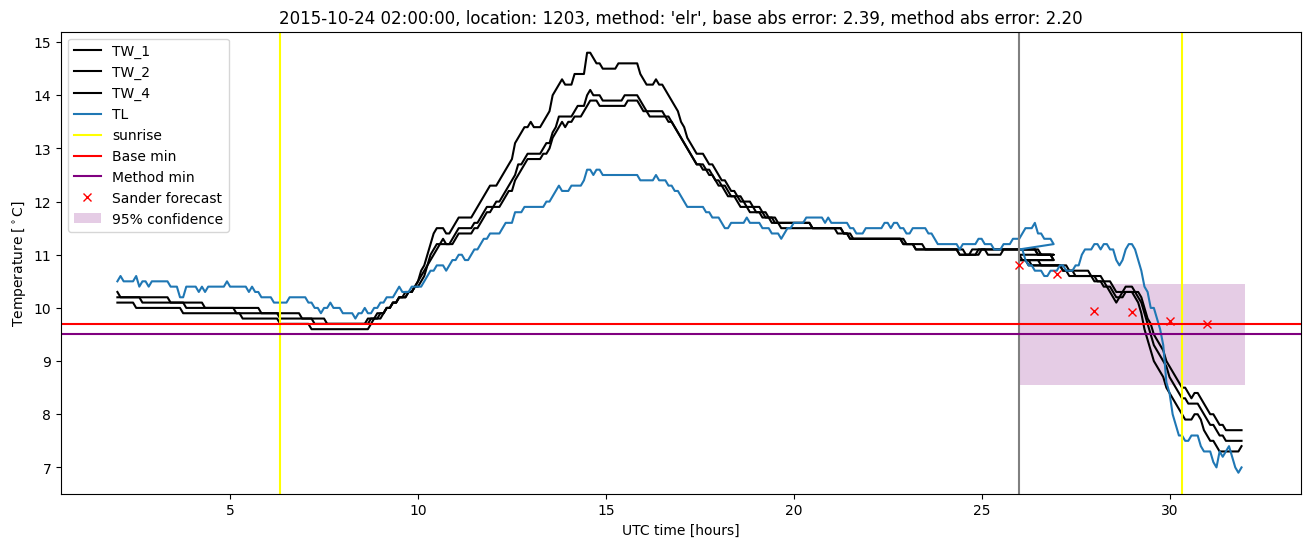
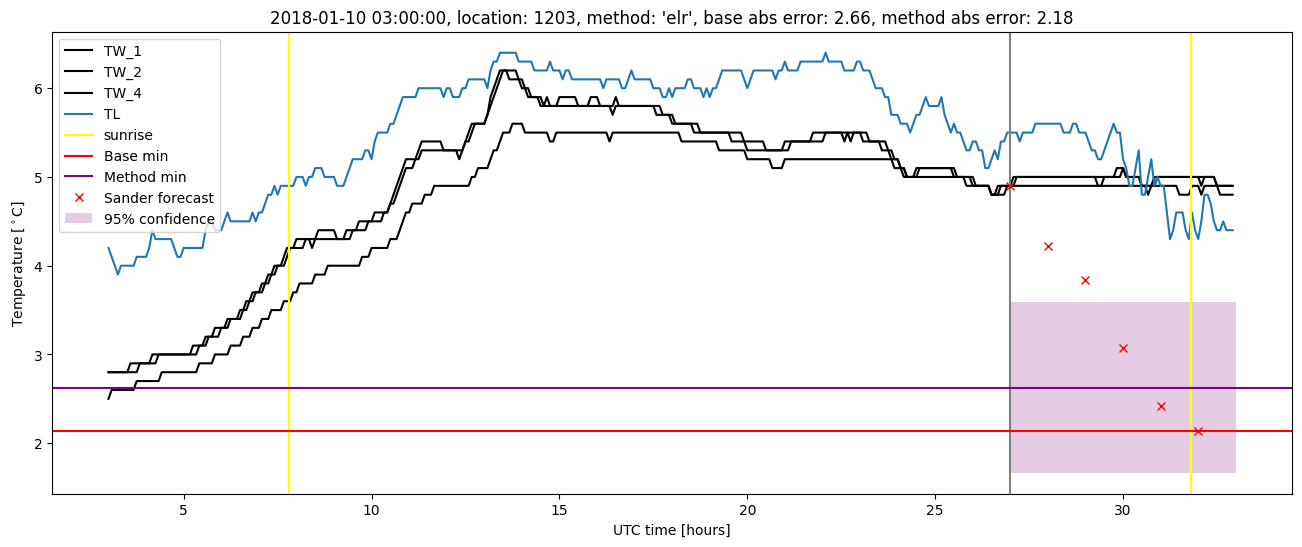
Extended logistic regression results
| names |
period |
power |
significance |
meanSquareError |
absError |
maxError |
CRPS |
IGN |
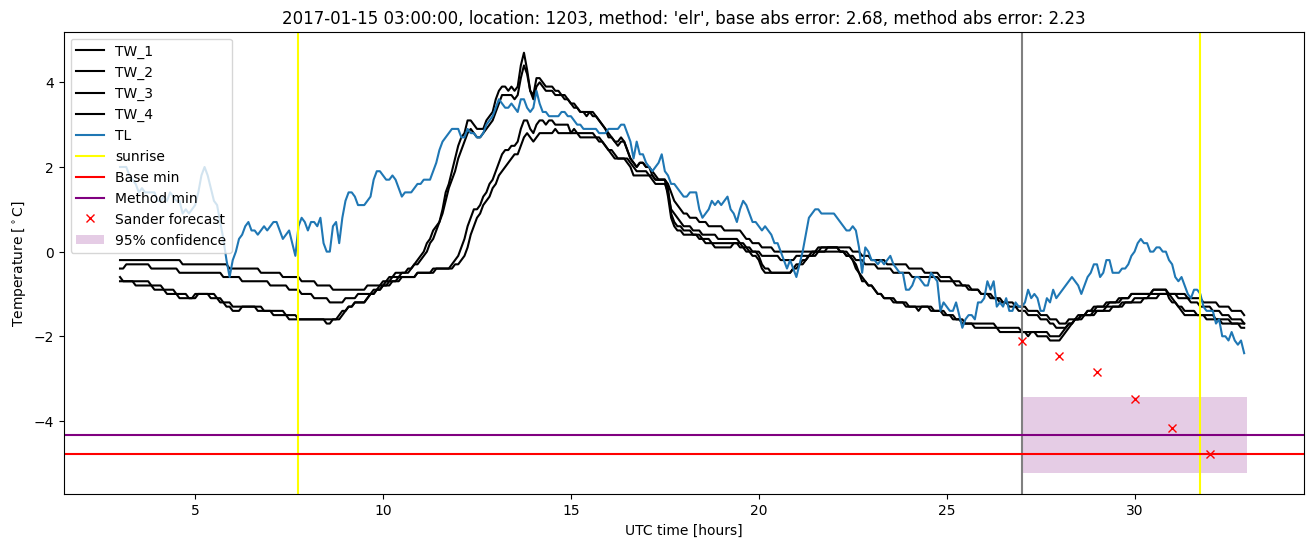
| baseline |
winter 2016 |
0.982 |
0.094 |
0.419 |
0.477 |
2.395 |
NaN |
NaN |
| elr |
winter 2016 |
0.982 |
0.094 |
0.356 |
0.466 |
2.200 |
0.582 |
3.718 |
| baseline |
winter 2017 |
0.991 |
0.029 |
0.722 |
0.620 |
2.681 |
NaN |
NaN |
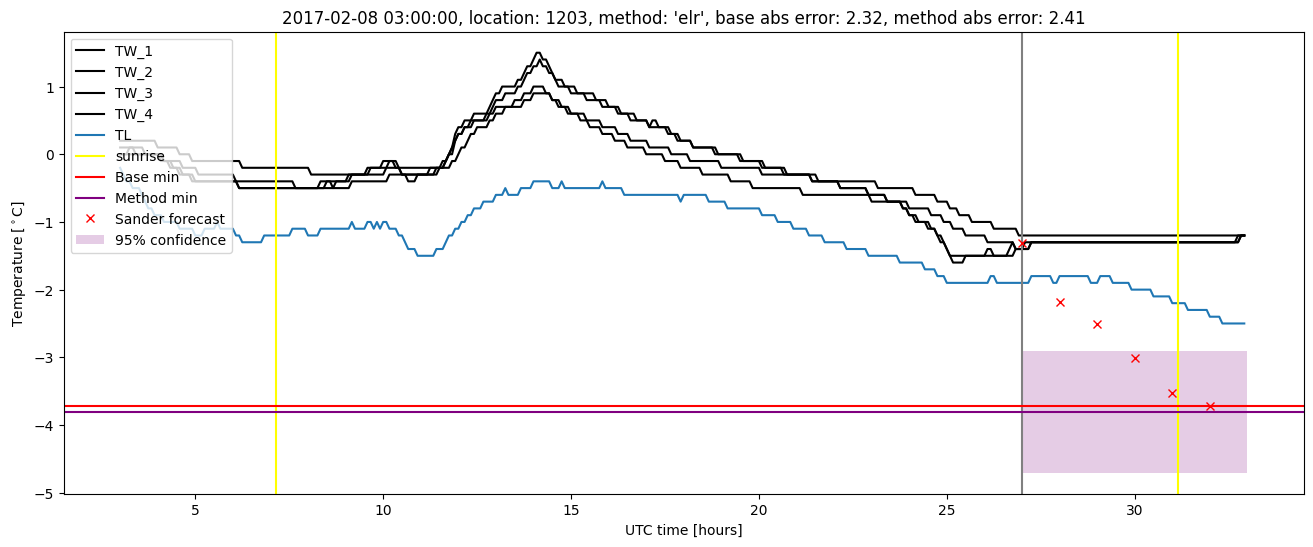
| elr |
winter 2017 |
0.991 |
0.029 |
0.642 |
0.588 |
2.406 |
0.538 |
3.983 |
| baseline |
winter 2018 |
0.971 |
0.143 |
0.352 |
0.431 |
2.657 |
NaN |
NaN |
| elr |
winter 2018 |
0.978 |
0.036 |
0.378 |
0.487 |
2.178 |
0.587 |
3.746 |
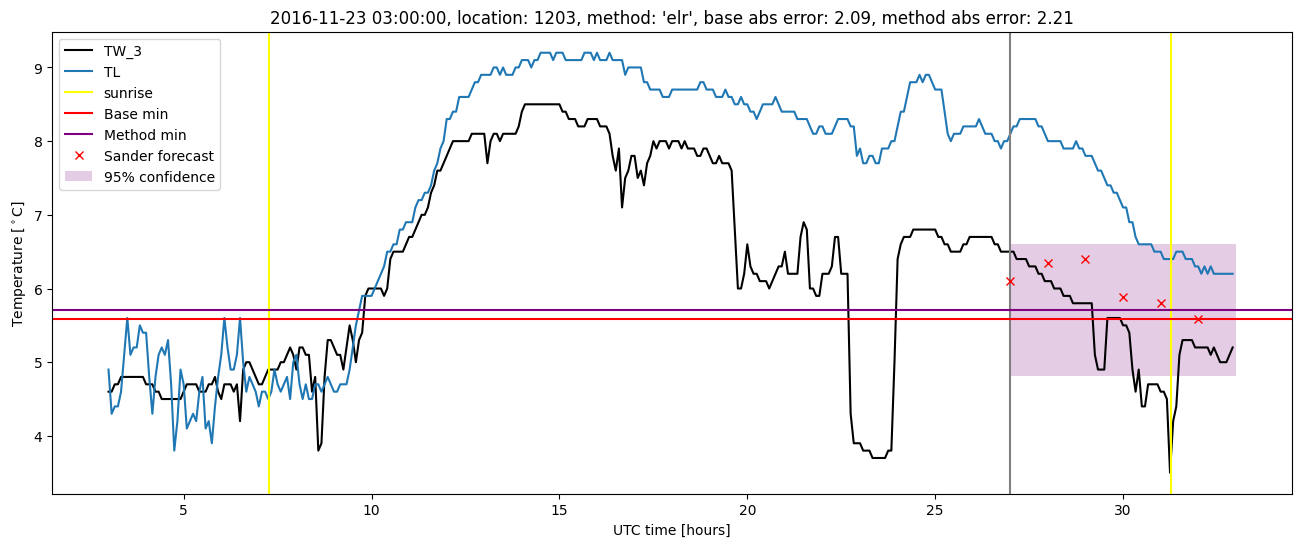
| baseline |
winter 2019 |
1.000 |
0.083 |
0.314 |
0.398 |
1.900 |
NaN |
NaN |
| elr |
winter 2019 |
1.000 |
0.083 |
0.339 |
0.438 |
1.718 |
0.567 |
3.425 |
| baseline |
all |
0.985 |
0.085 |
0.447 |
0.480 |
2.681 |
NaN |
NaN |
| elr |
all |
0.987 |
0.057 |
0.422 |
0.493 |
2.406 |
0.570 |
3.720 |
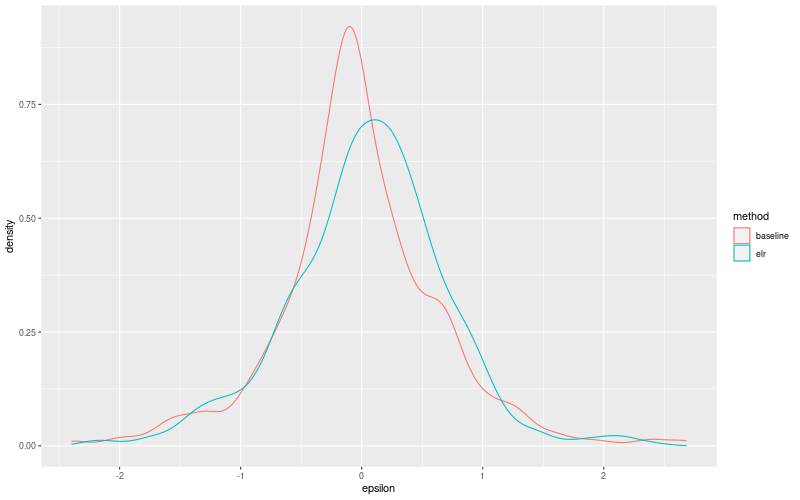
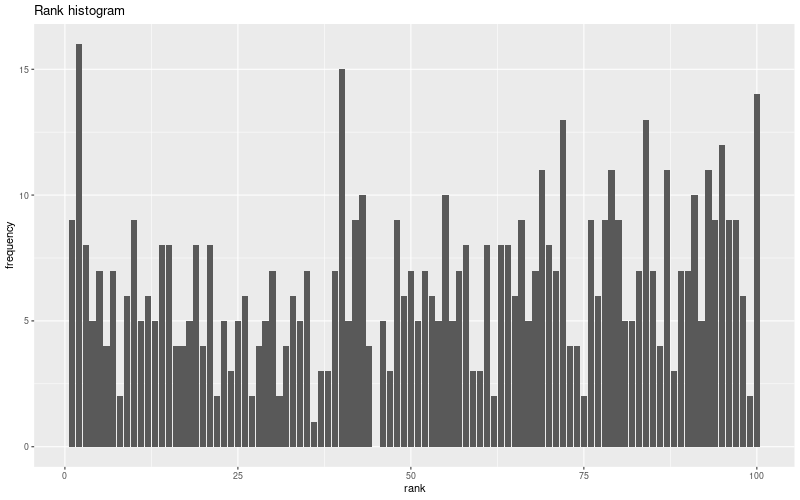
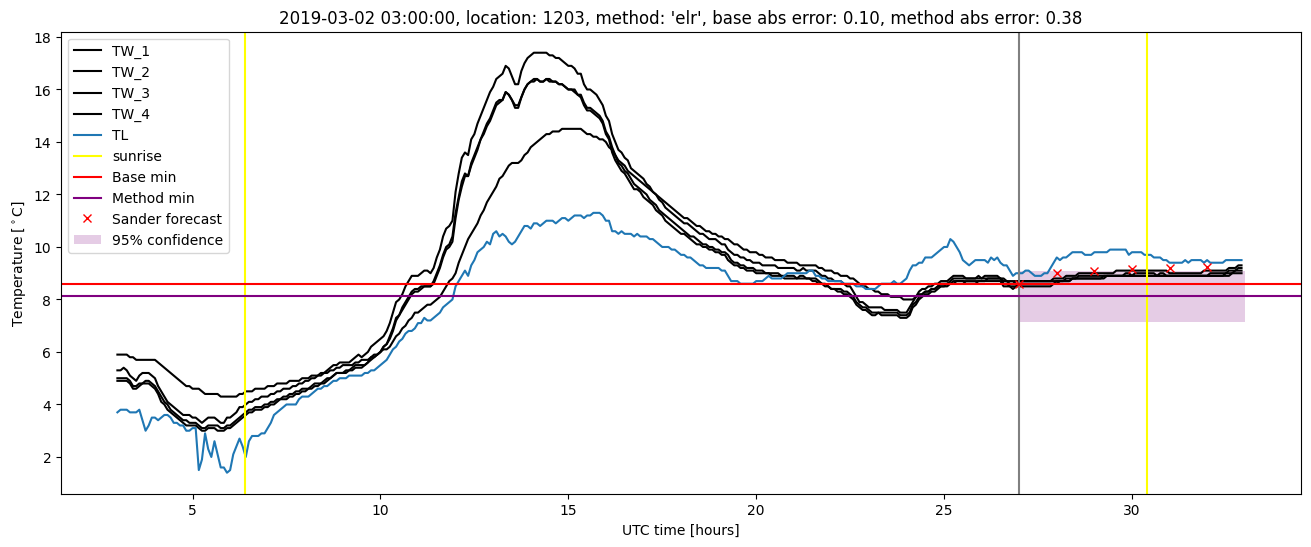
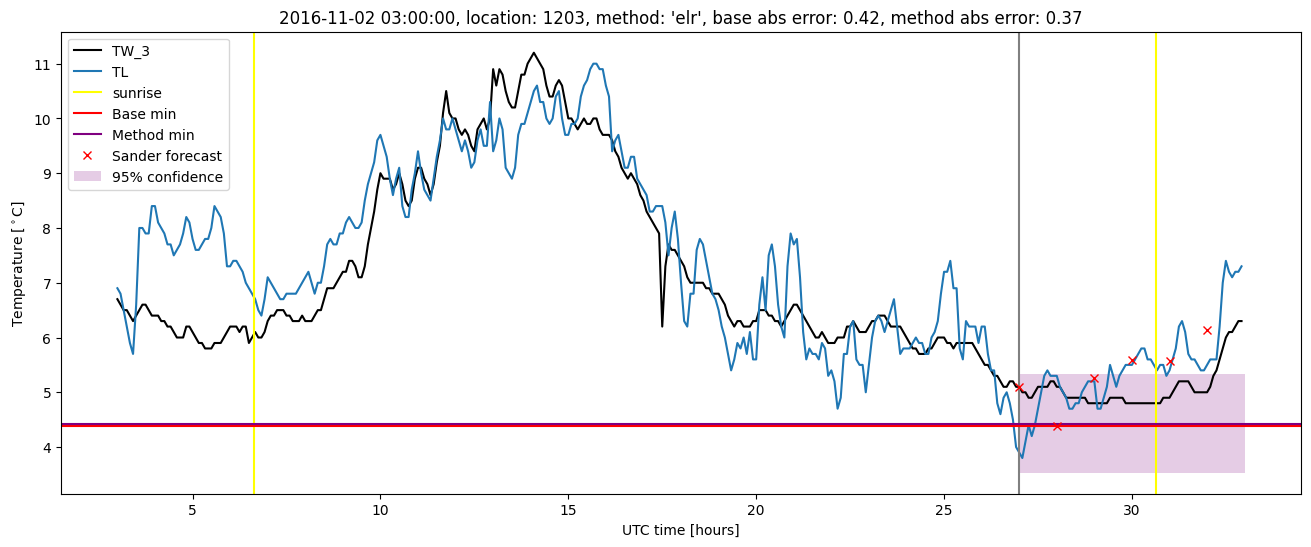
Extended logistic regression plots