GMS location: 1202
Random forest results
| names |
period |
power |
significance |
meanSquareError |
absError |
maxError |
CRPS |
IGN |
| baseline |
winter 2016 |
0.970 |
0.111 |
0.348 |
0.444 |
2.394 |
NaN |
NaN |
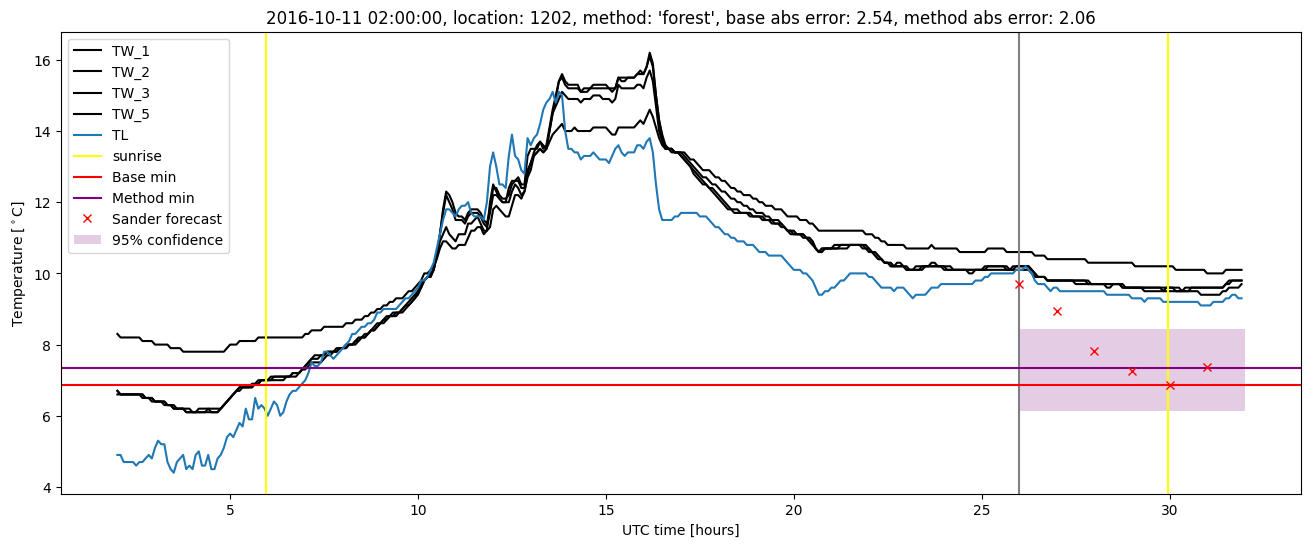
| forest |
winter 2016 |
0.964 |
0.074 |
0.272 |
0.393 |
2.248 |
0.477 |
3.054 |
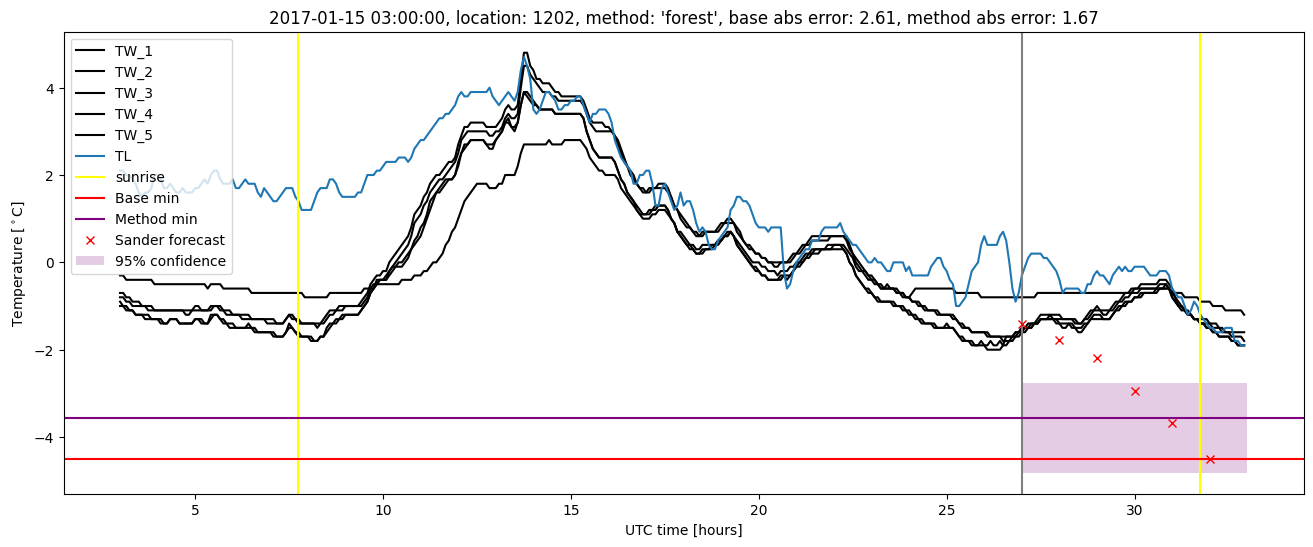
| baseline |
winter 2017 |
0.974 |
0.027 |
0.630 |
0.565 |
2.606 |
NaN |
NaN |
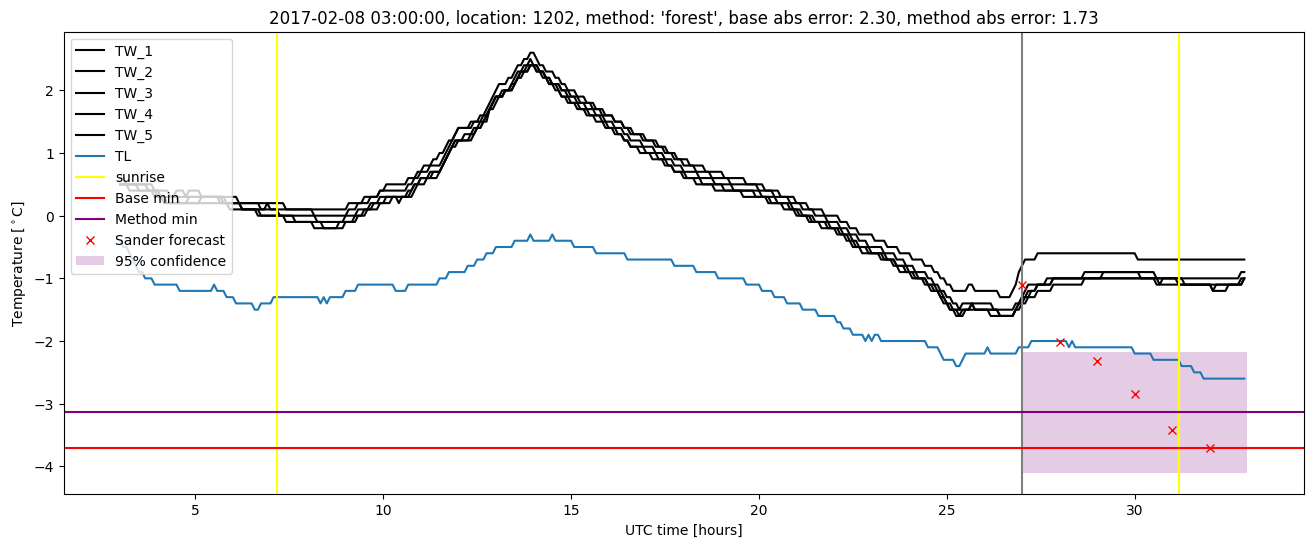
| forest |
winter 2017 |
0.974 |
0.027 |
0.409 |
0.461 |
2.062 |
0.467 |
3.644 |
| baseline |
winter 2018 |
0.993 |
0.105 |
0.349 |
0.436 |
2.252 |
NaN |
NaN |
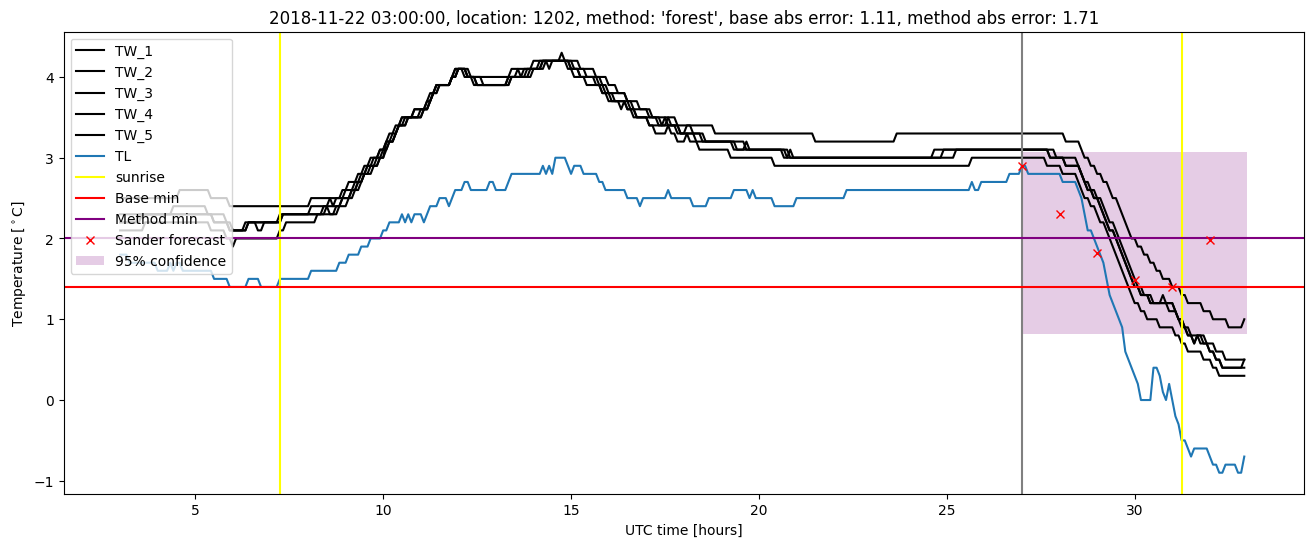
| forest |
winter 2018 |
1.000 |
0.053 |
0.301 |
0.409 |
1.603 |
0.472 |
2.455 |
| baseline |
winter 2019 |
0.993 |
0.000e+00 |
0.300 |
0.400 |
1.596 |
NaN |
NaN |
| forest |
winter 2019 |
1.000 |
0.071 |
0.252 |
0.382 |
1.709 |
0.465 |
2.666 |
| baseline |
all |
0.983 |
0.069 |
0.399 |
0.458 |
2.606 |
NaN |
NaN |
| forest |
all |
0.984 |
0.052 |
0.305 |
0.410 |
2.248 |
0.471 |
2.939 |
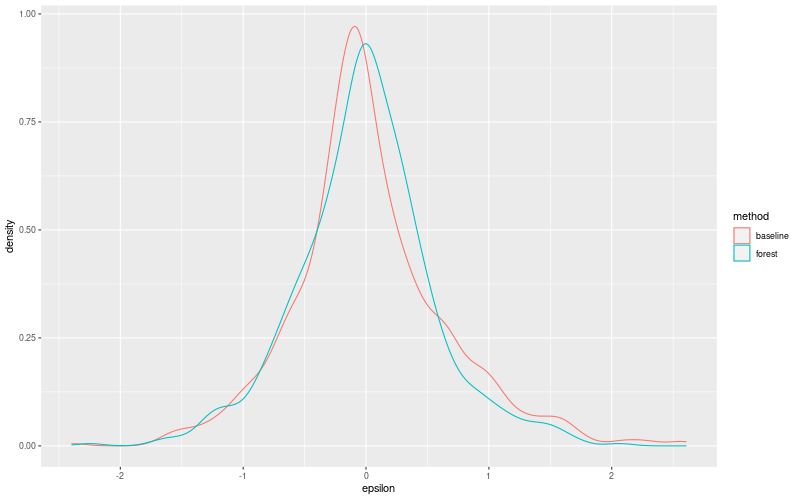
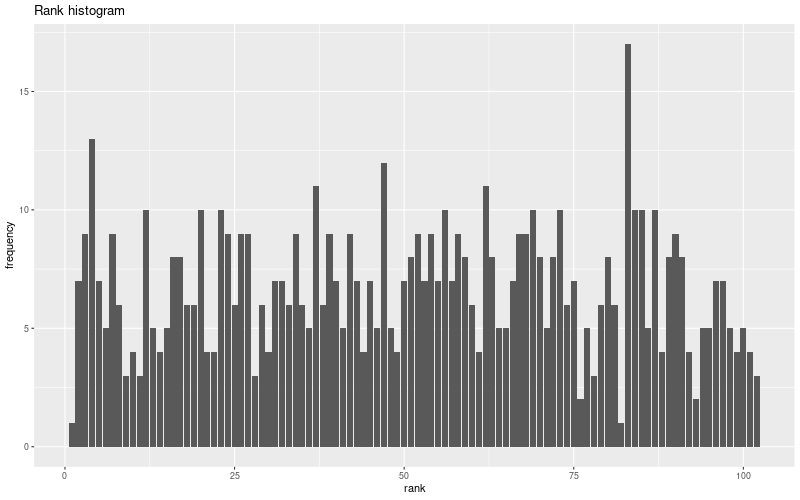
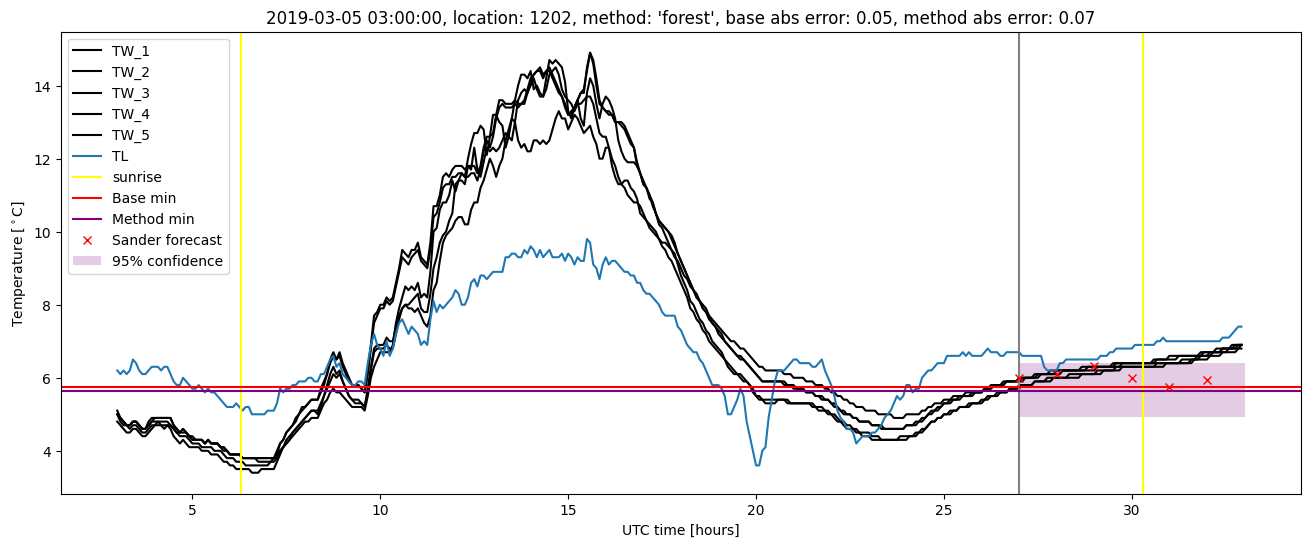
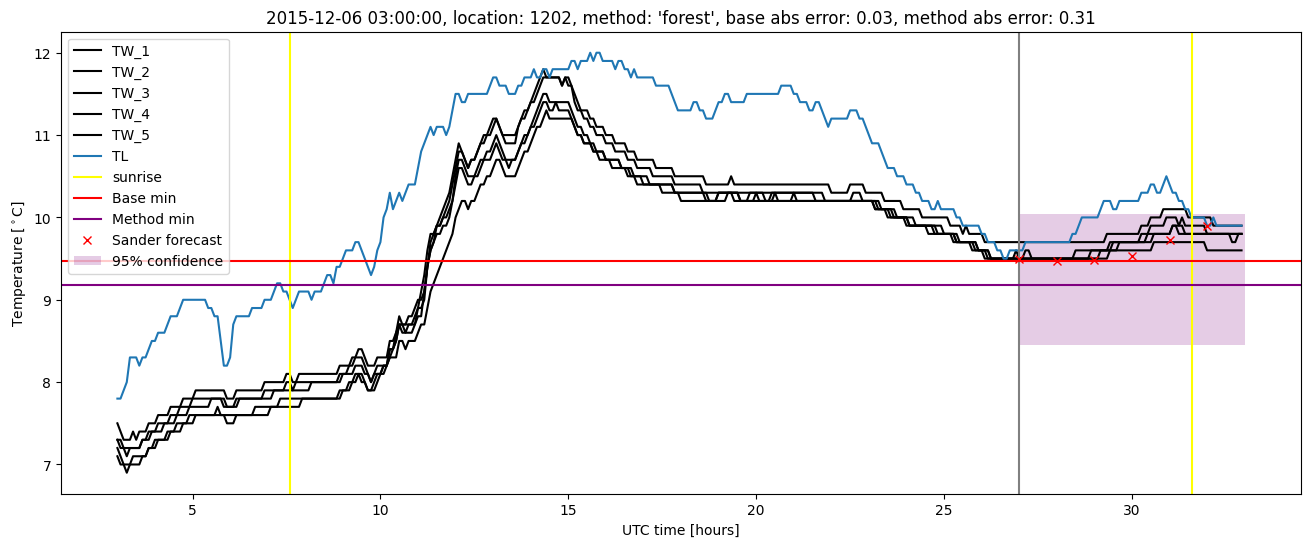
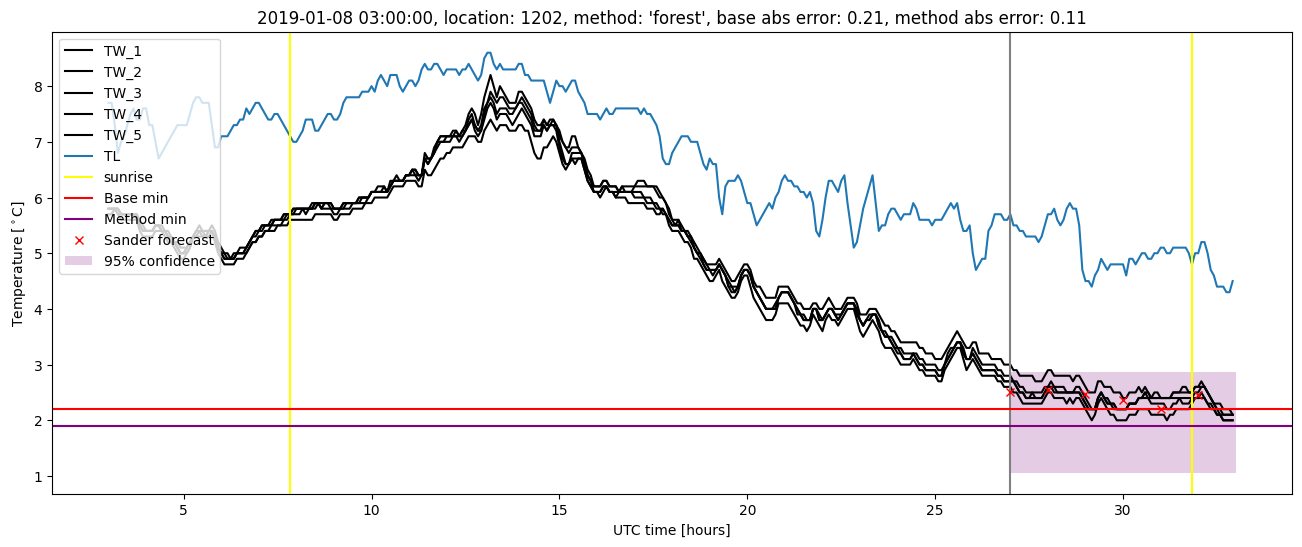
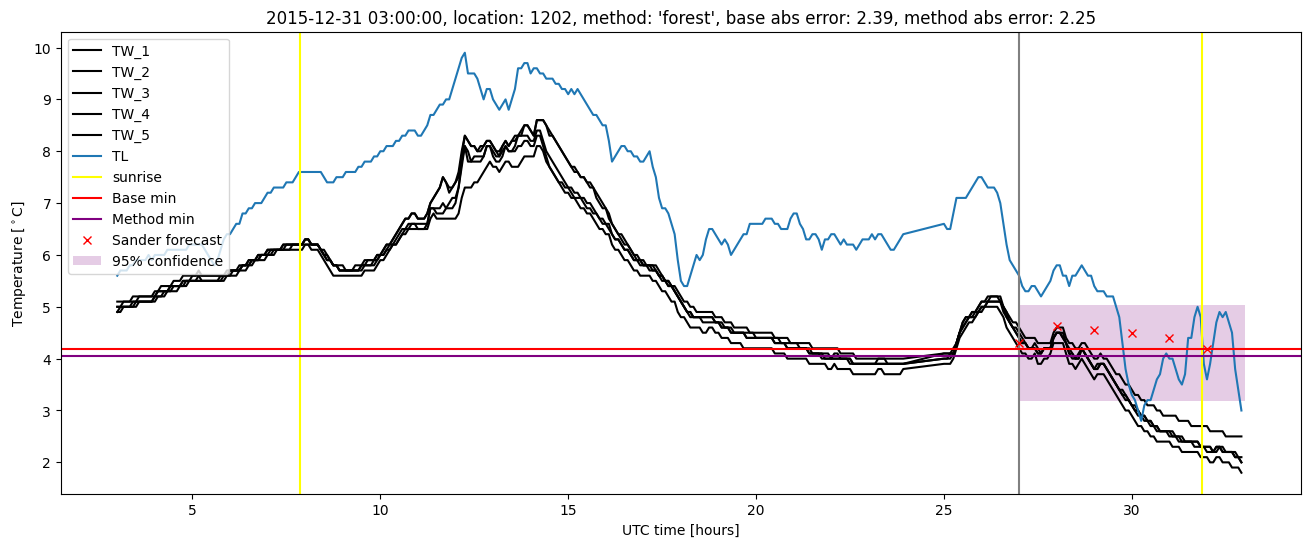
Random forest plots
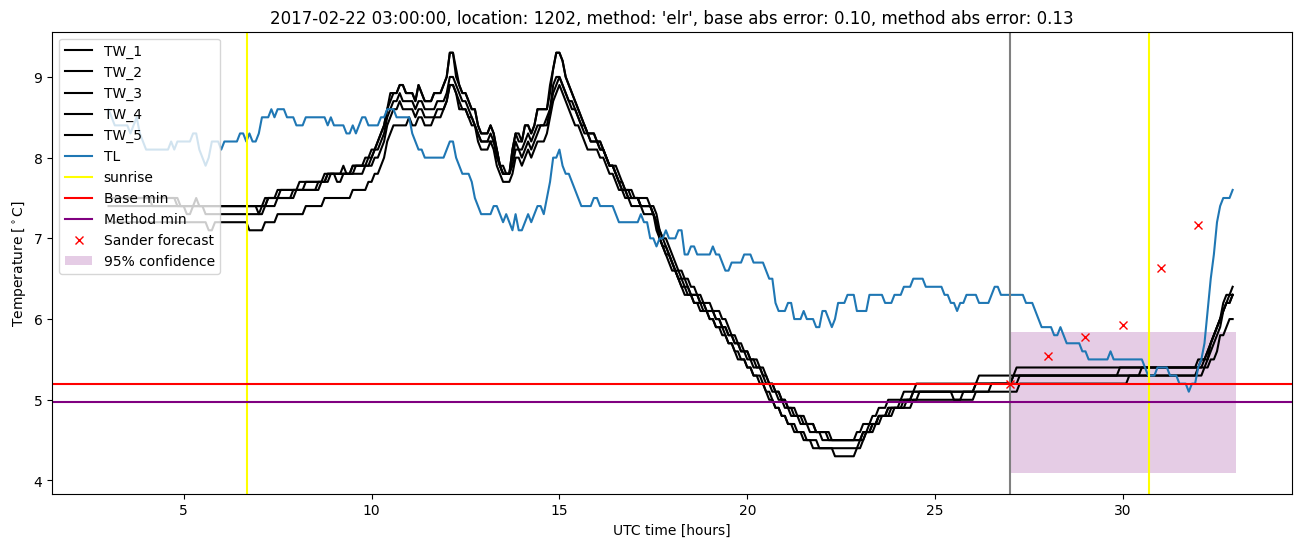
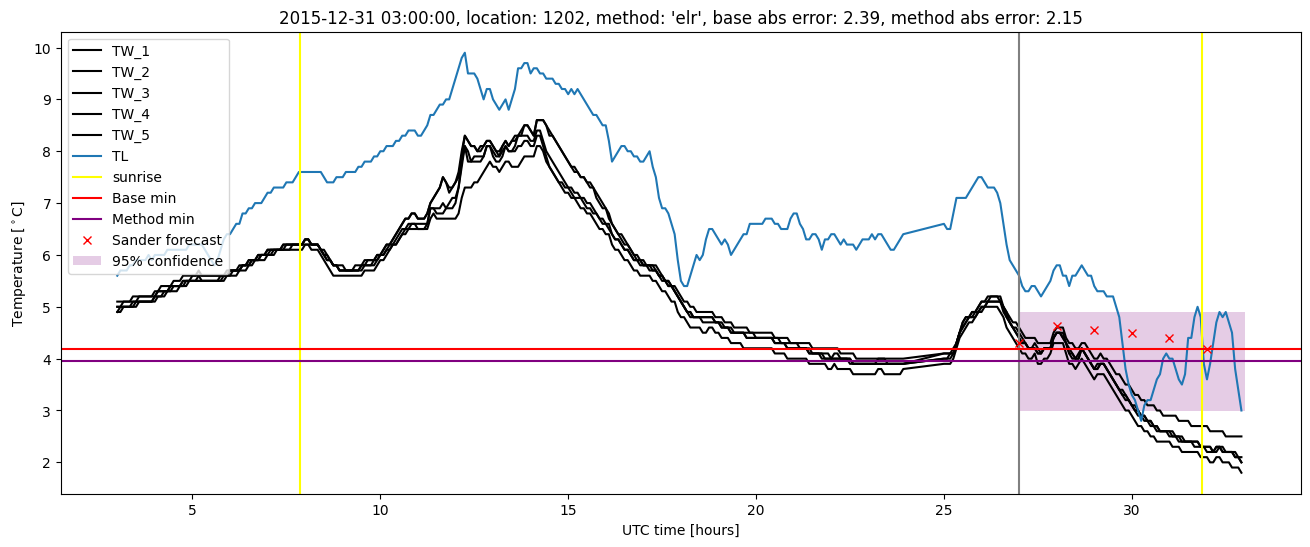
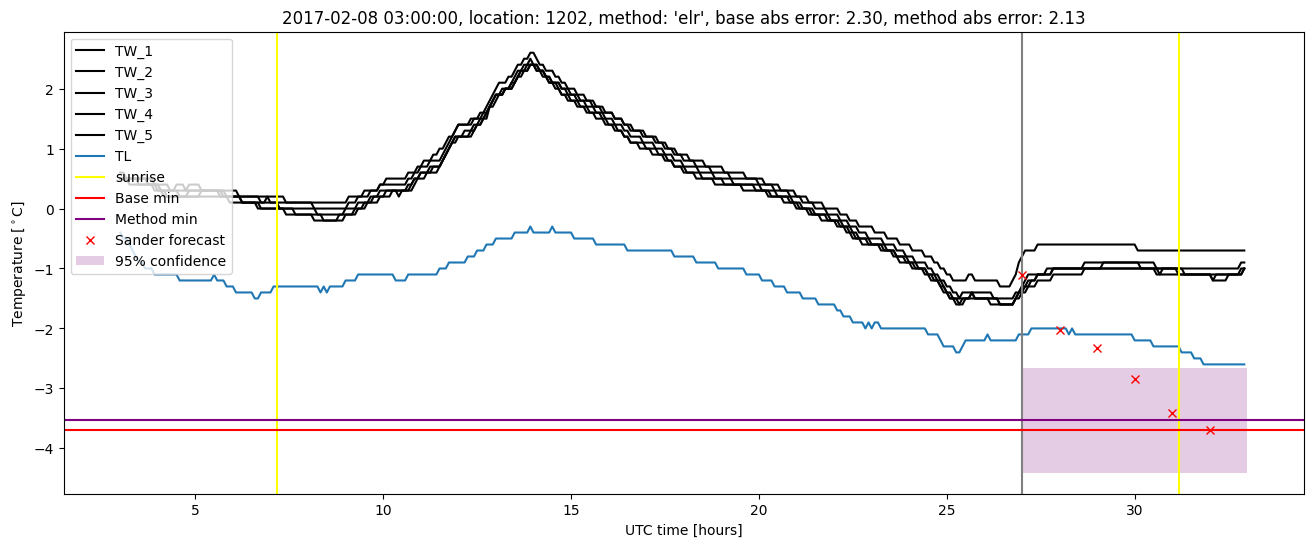
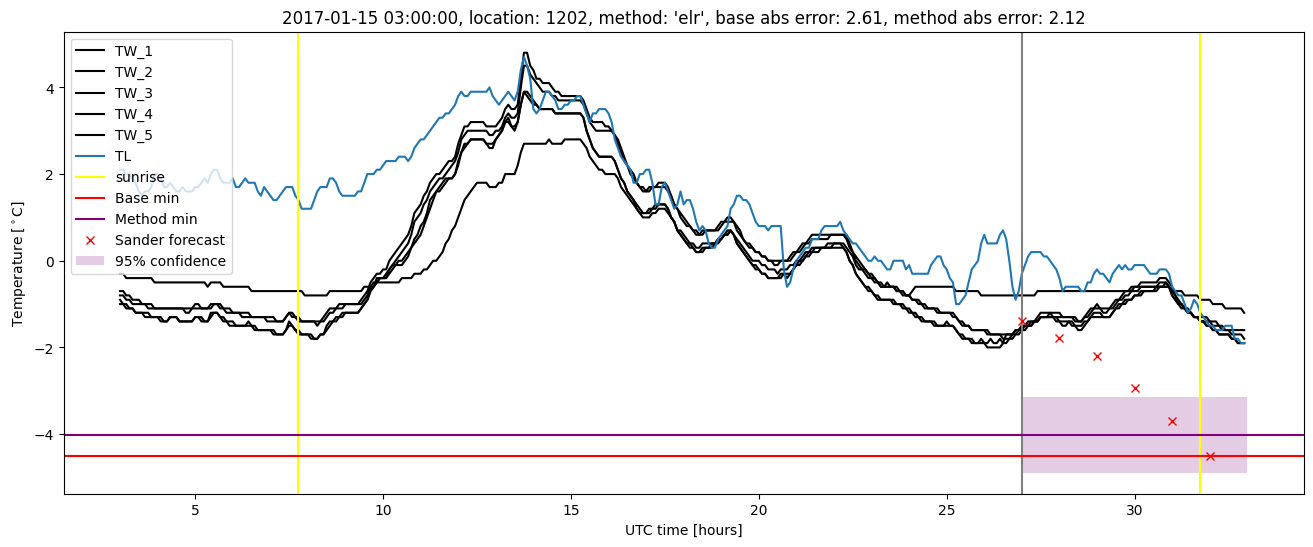
Extended logistic regression results
| names |
period |
power |
significance |
meanSquareError |
absError |
maxError |
CRPS |
IGN |
| baseline |
winter 2016 |
0.970 |
0.111 |
0.348 |
0.444 |
2.394 |
NaN |
NaN |
| elr |
winter 2016 |
0.964 |
0.074 |
0.286 |
0.431 |
2.148 |
0.556 |
3.376 |
| baseline |
winter 2017 |
0.974 |
0.027 |
0.630 |
0.565 |
2.606 |
NaN |
NaN |
| elr |
winter 2017 |
0.974 |
0.027 |
0.492 |
0.507 |
2.135 |
0.522 |
4.143 |
| baseline |
winter 2018 |
0.993 |
0.105 |
0.349 |
0.436 |
2.252 |
NaN |
NaN |
| elr |
winter 2018 |
0.986 |
0.079 |
0.338 |
0.432 |
1.873 |
0.553 |
4.175 |
| baseline |
winter 2019 |
0.993 |
0.000e+00 |
0.300 |
0.400 |
1.596 |
NaN |
NaN |
| elr |
winter 2019 |
1.000 |
0.071 |
0.289 |
0.424 |
1.655 |
0.519 |
2.987 |
| baseline |
all |
0.983 |
0.069 |
0.399 |
0.458 |
2.606 |
NaN |
NaN |
| elr |
all |
0.981 |
0.060 |
0.346 |
0.446 |
2.148 |
0.539 |
3.660 |
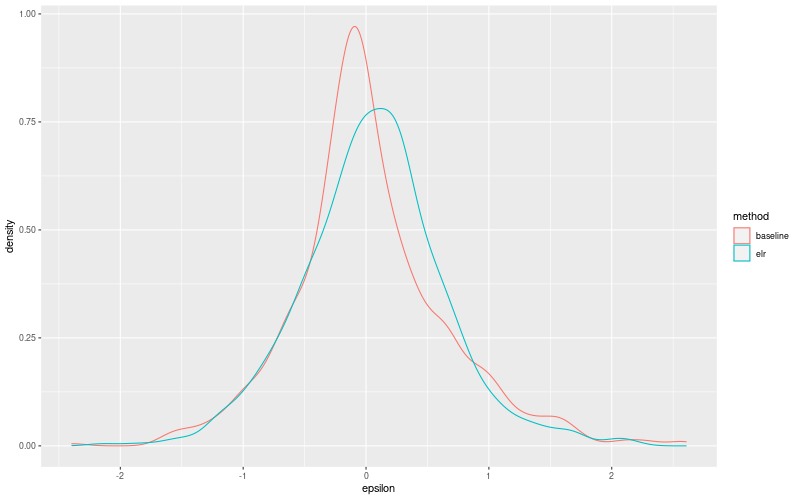
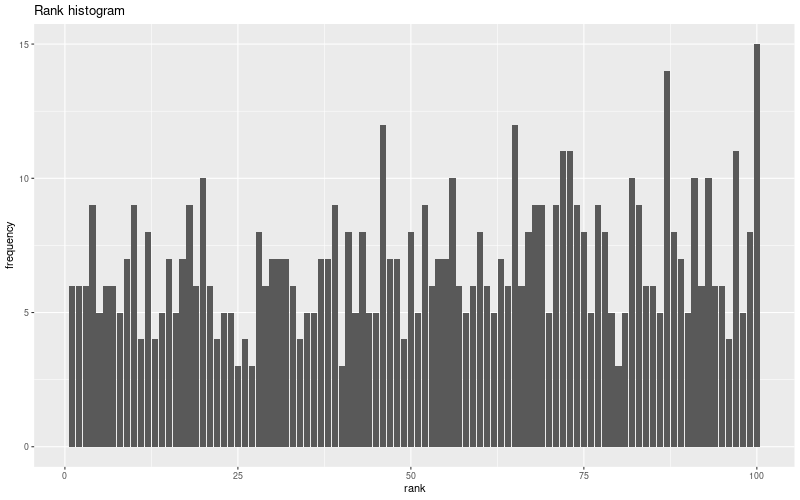
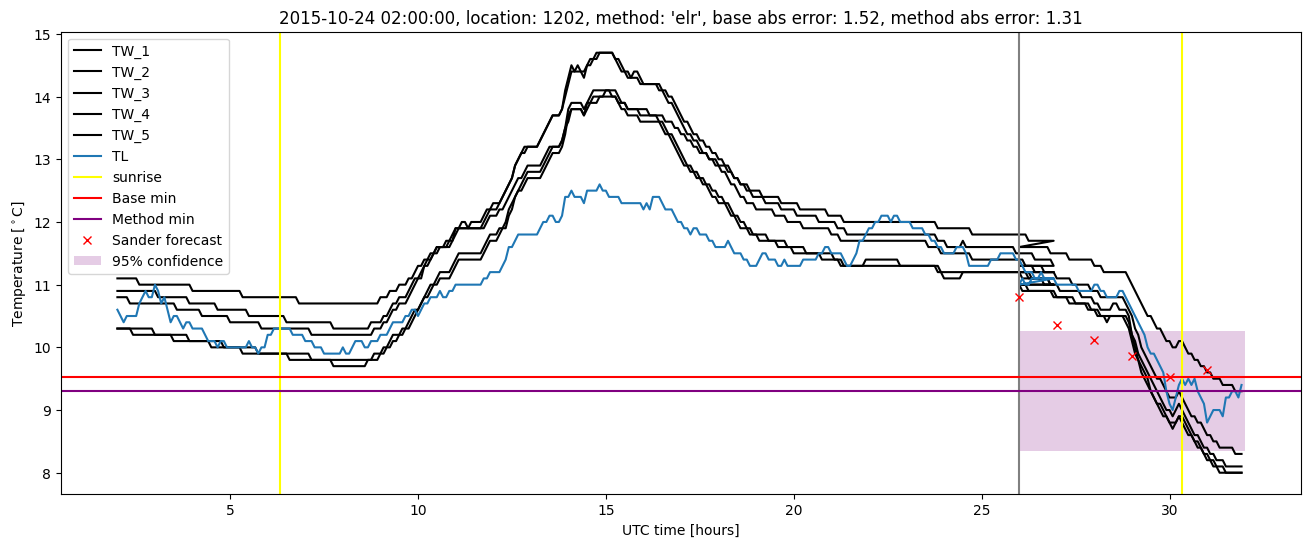
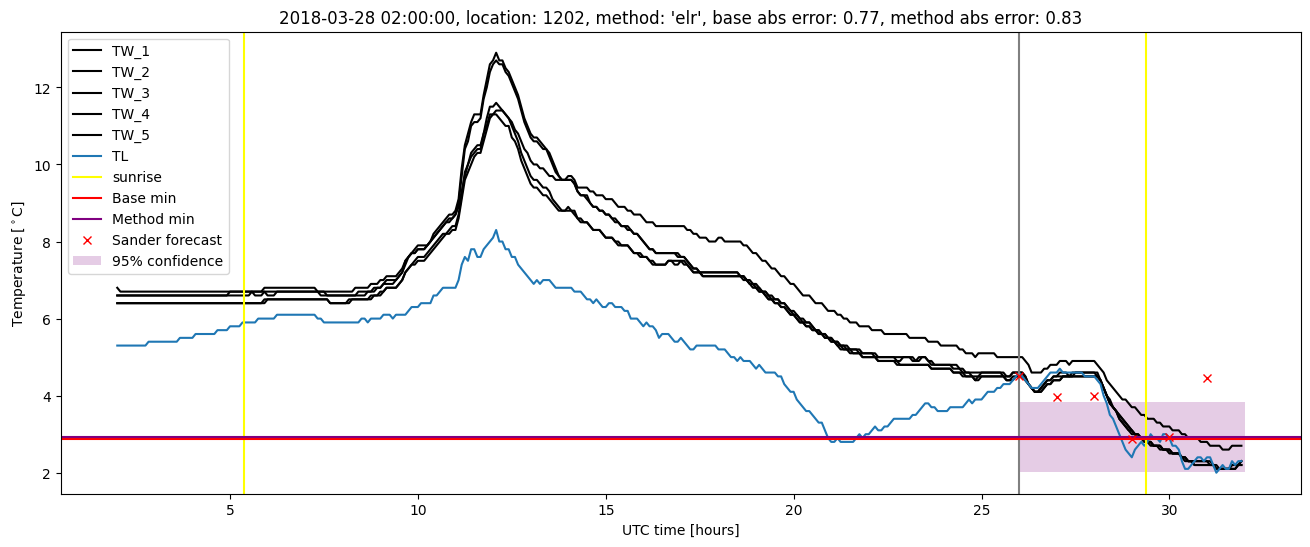
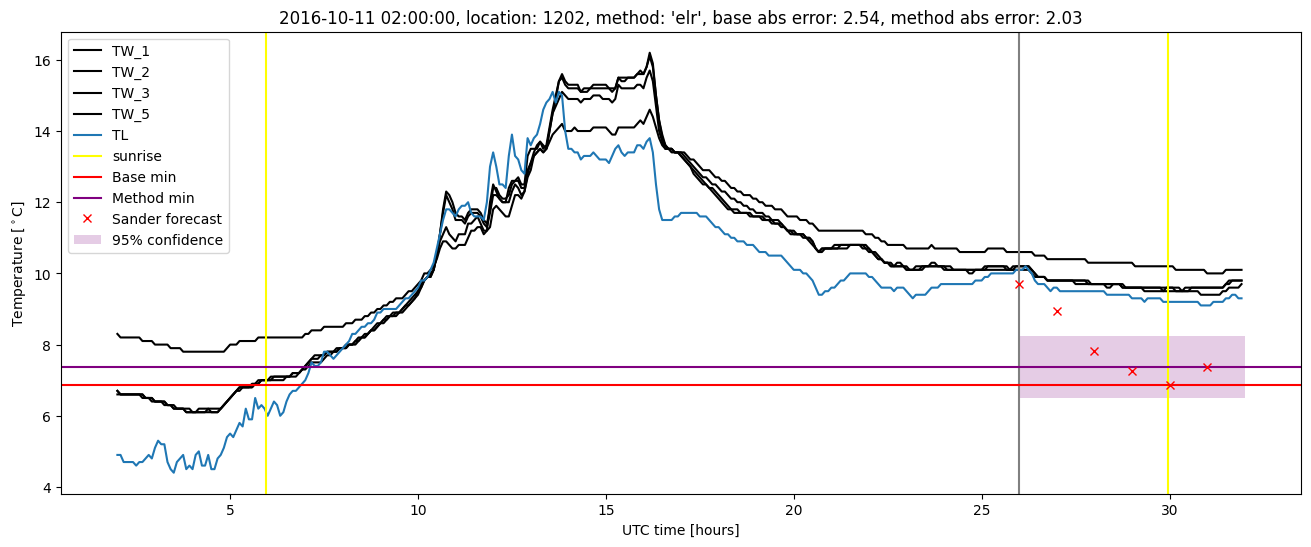
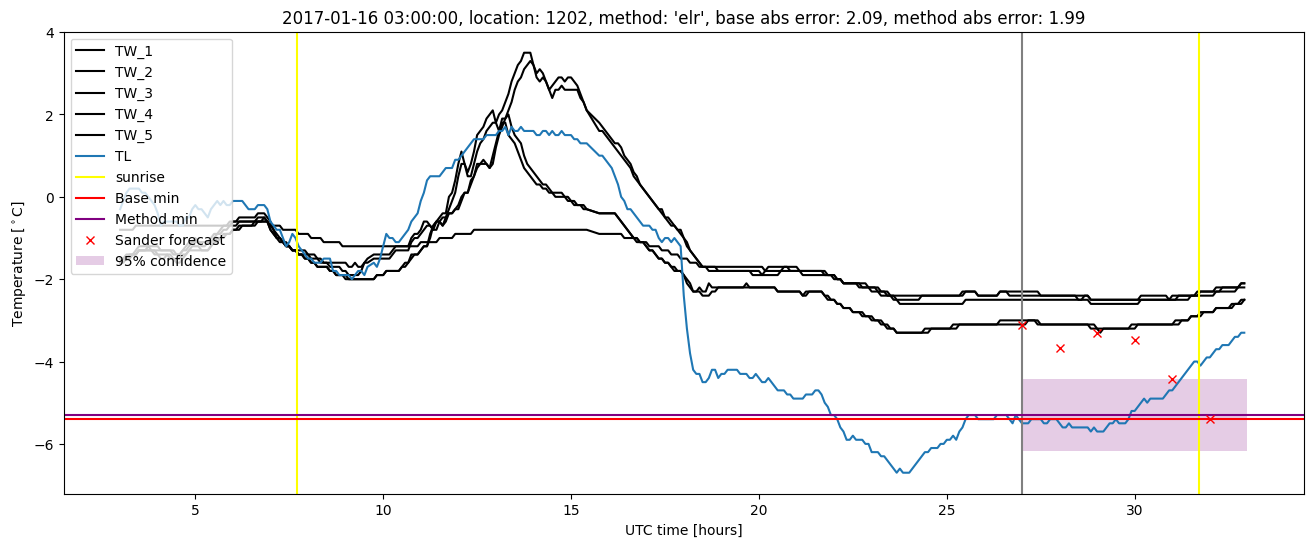
Extended logistic regression plots