GMS location: 1201
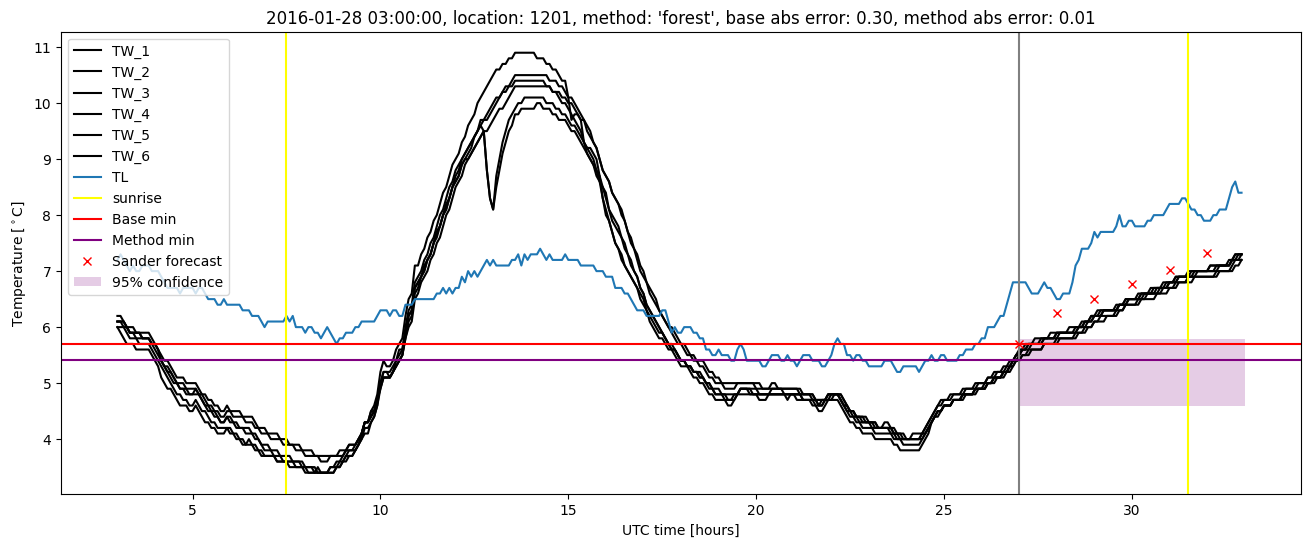
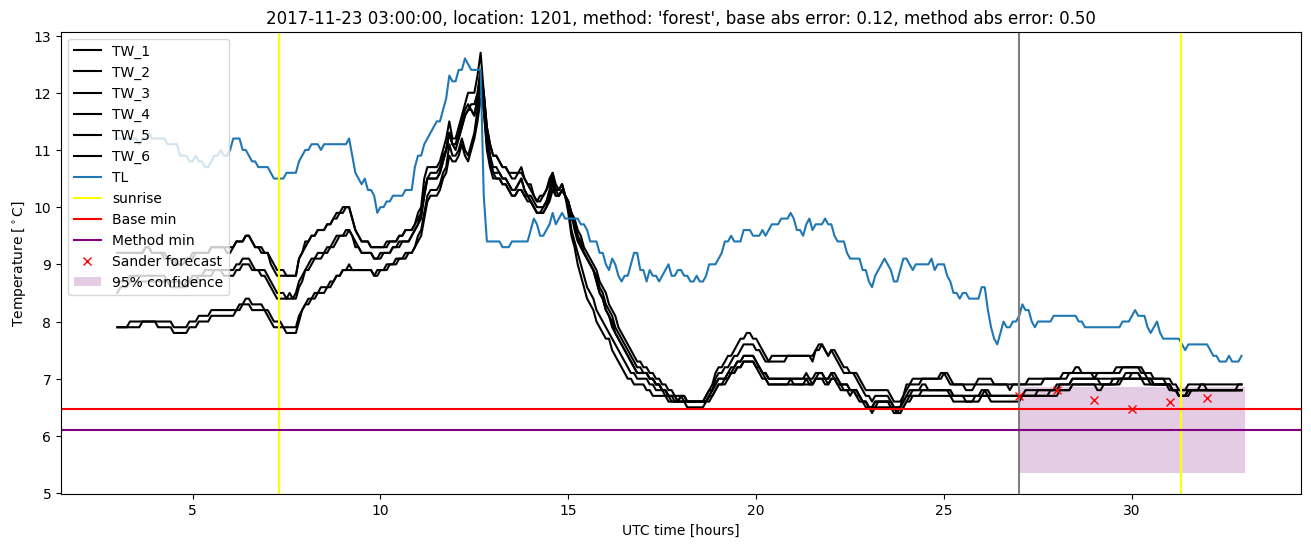
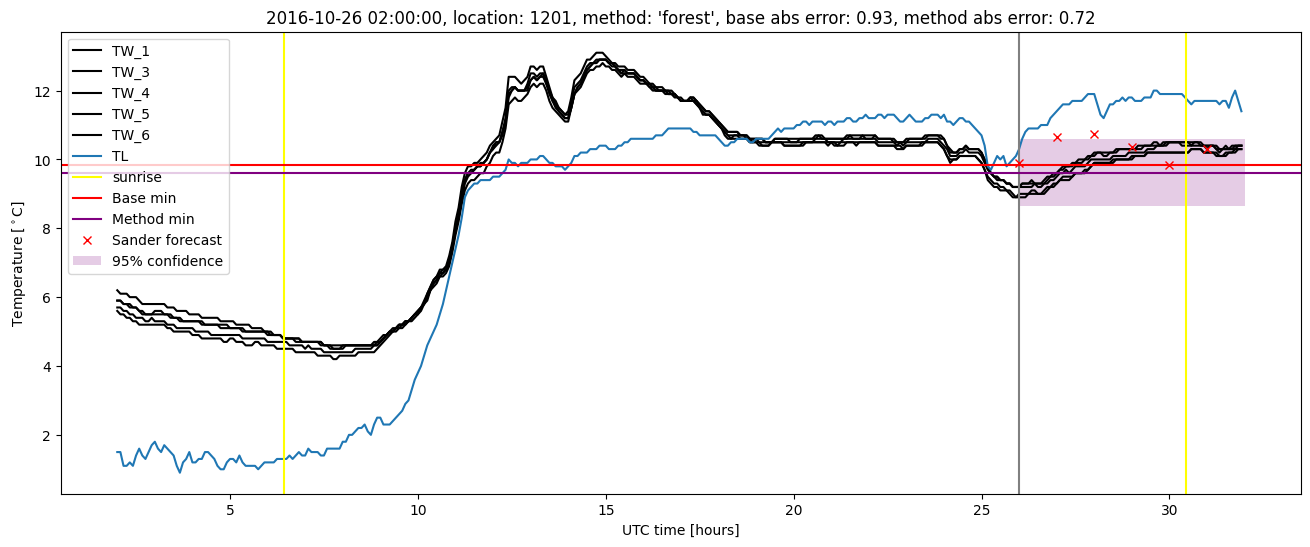
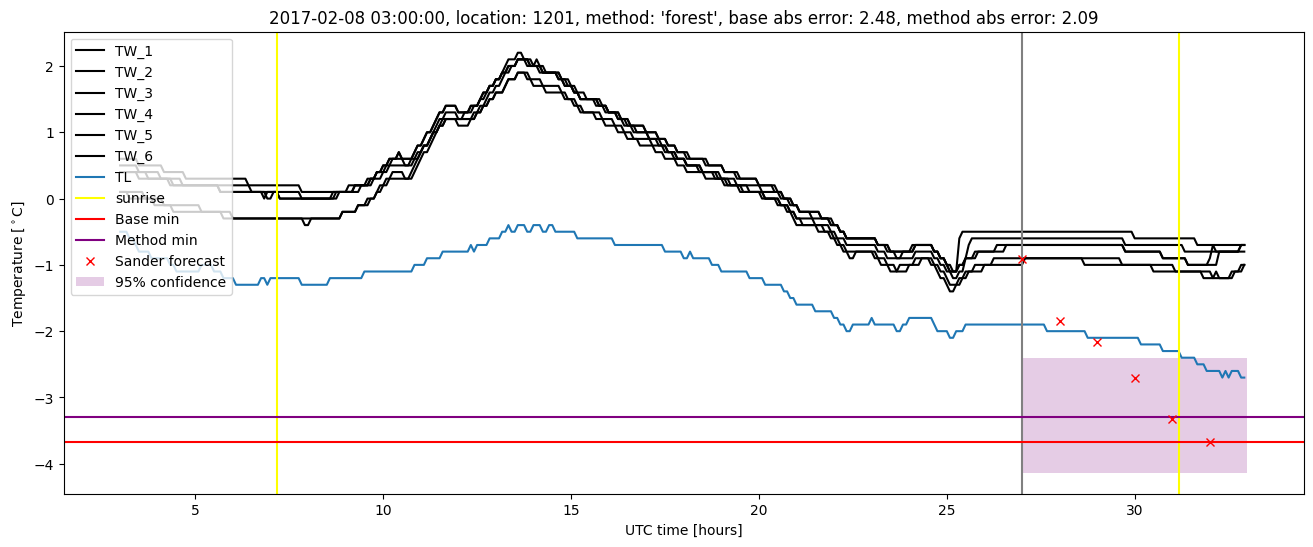
Random forest results
| names |
period |
power |
significance |
meanSquareError |
absError |
maxError |
CRPS |
IGN |
| baseline |
winter 2016 |
0.995 |
0.095 |
0.338 |
0.444 |
1.799 |
NaN |
NaN |
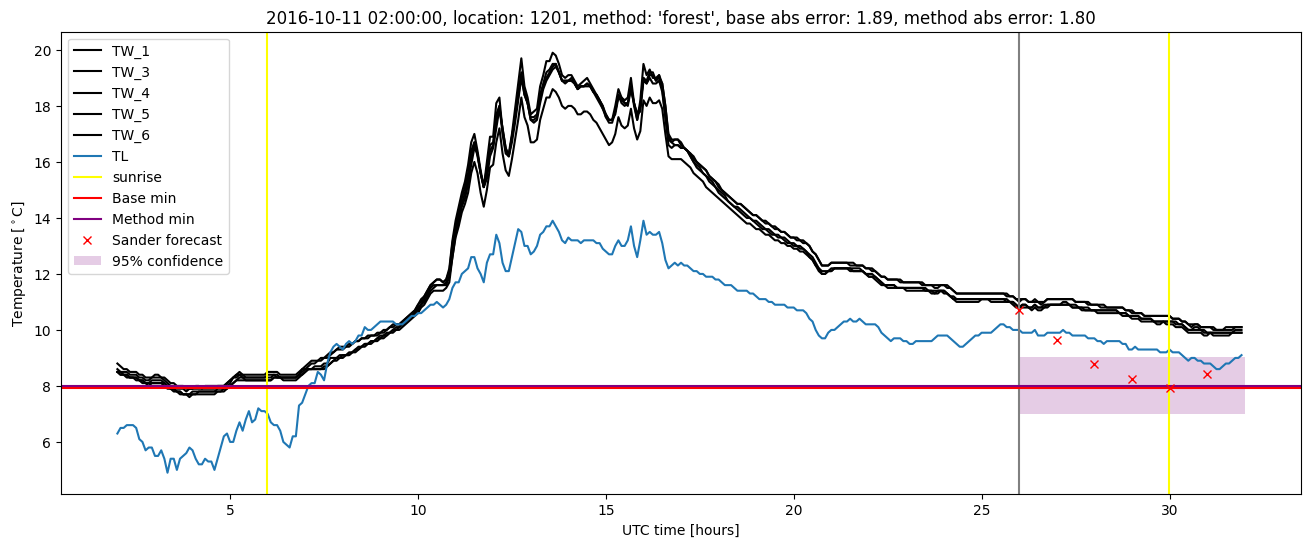
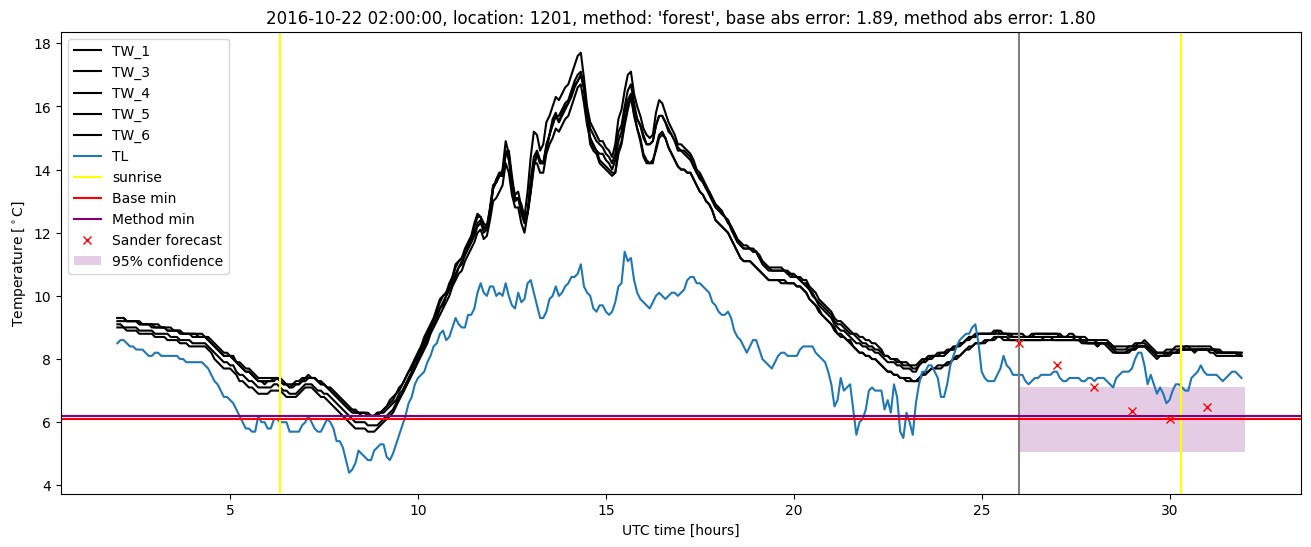
| forest |
winter 2016 |
0.989 |
0.095 |
0.276 |
0.403 |
1.681 |
0.571 |
4.550 |
| baseline |
winter 2017 |
0.992 |
0.000e+00 |
0.582 |
0.568 |
2.738 |
NaN |
NaN |
| forest |
winter 2017 |
0.992 |
0.000e+00 |
0.447 |
0.492 |
2.262 |
0.537 |
5.273 |
| baseline |
winter 2018 |
0.980 |
0.107 |
0.325 |
0.434 |
2.236 |
NaN |
NaN |
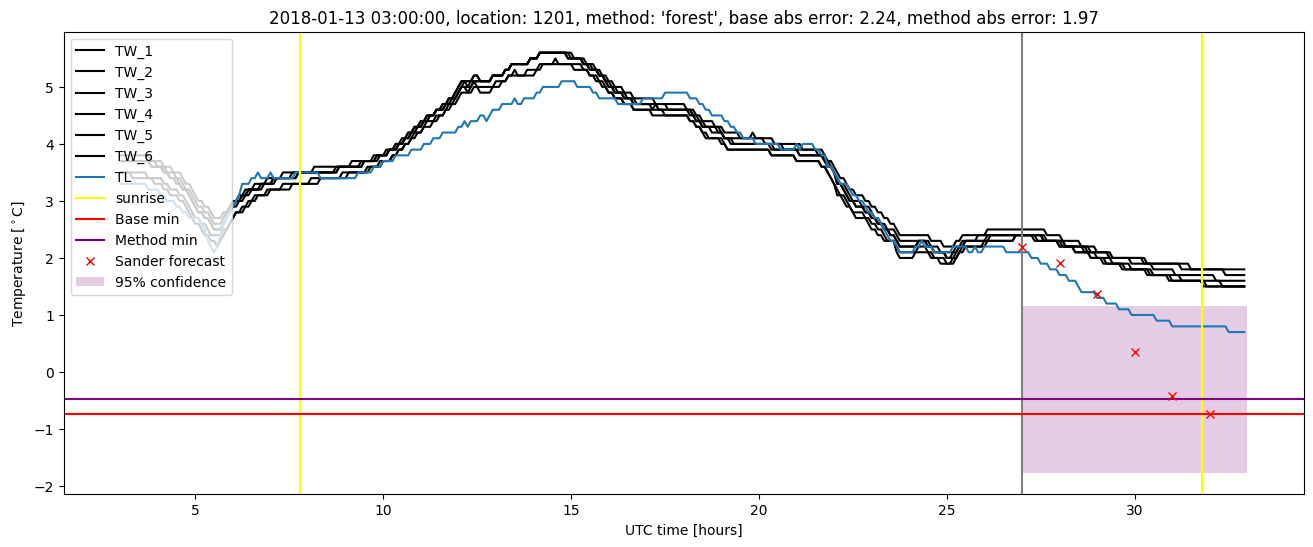
| forest |
winter 2018 |
0.974 |
0.071 |
0.277 |
0.410 |
1.974 |
0.560 |
4.318 |
| baseline |
winter 2019 |
0.993 |
0.083 |
0.277 |
0.395 |
1.634 |
NaN |
NaN |
| forest |
winter 2019 |
0.993 |
0.083 |
0.226 |
0.353 |
1.750 |
0.574 |
4.913 |
| baseline |
all |
0.990 |
0.062 |
0.375 |
0.458 |
2.738 |
NaN |
NaN |
| forest |
all |
0.987 |
0.052 |
0.303 |
0.413 |
2.262 |
0.561 |
4.730 |
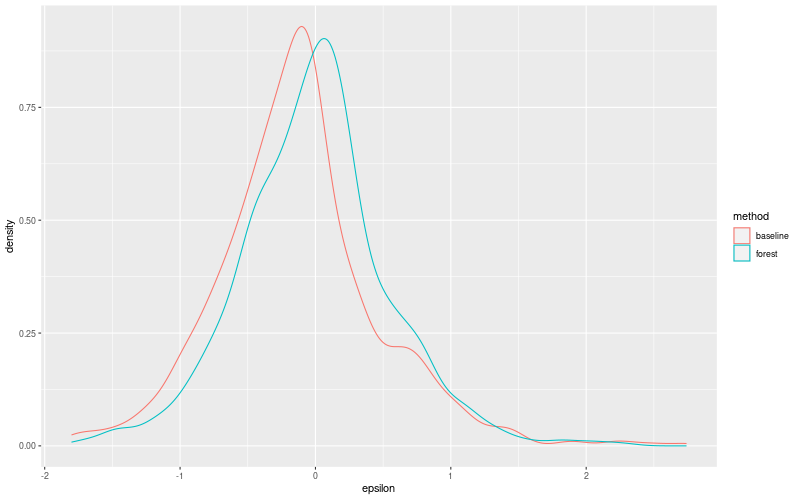
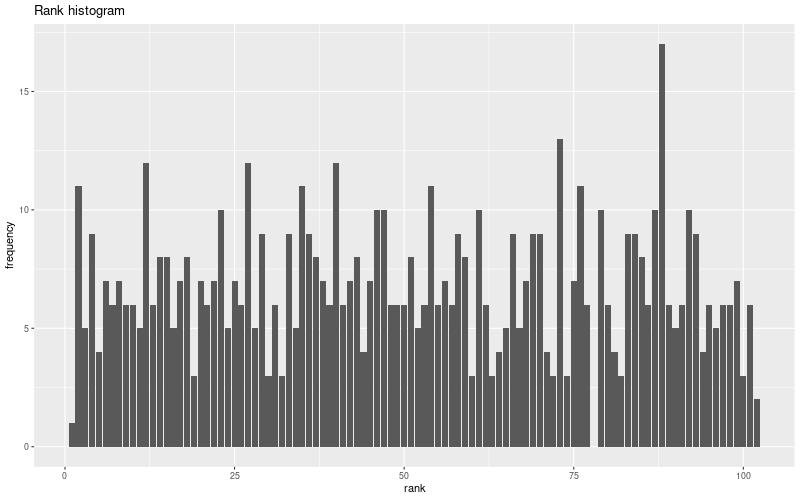
Random forest plots

Extended logistic regression results
| names |
period |
power |
significance |
meanSquareError |
absError |
maxError |
CRPS |
IGN |
| baseline |
winter 2016 |
0.995 |
0.095 |
0.338 |
0.444 |
1.799 |
NaN |
NaN |
| elr |
winter 2016 |
0.989 |
0.048 |
0.303 |
0.440 |
1.829 |
0.655 |
6.599 |
| baseline |
winter 2017 |
0.992 |
0.000e+00 |
0.582 |
0.568 |
2.738 |
NaN |
NaN |
| elr |
winter 2017 |
0.992 |
0.000e+00 |
0.444 |
0.494 |
2.308 |
0.595 |
6.957 |
| baseline |
winter 2018 |
0.980 |
0.107 |
0.325 |
0.434 |
2.236 |
NaN |
NaN |
| elr |
winter 2018 |
0.974 |
0.071 |
0.293 |
0.427 |
1.728 |
0.651 |
5.650 |
| baseline |
winter 2019 |
0.993 |
0.083 |
0.277 |
0.395 |
1.634 |
NaN |
NaN |
| elr |
winter 2019 |
0.993 |
0.083 |
0.265 |
0.411 |
1.757 |
0.622 |
5.209 |
| baseline |
all |
0.990 |
0.062 |
0.375 |
0.458 |
2.738 |
NaN |
NaN |
| elr |
all |
0.987 |
0.042 |
0.323 |
0.442 |
2.308 |
0.634 |
6.124 |
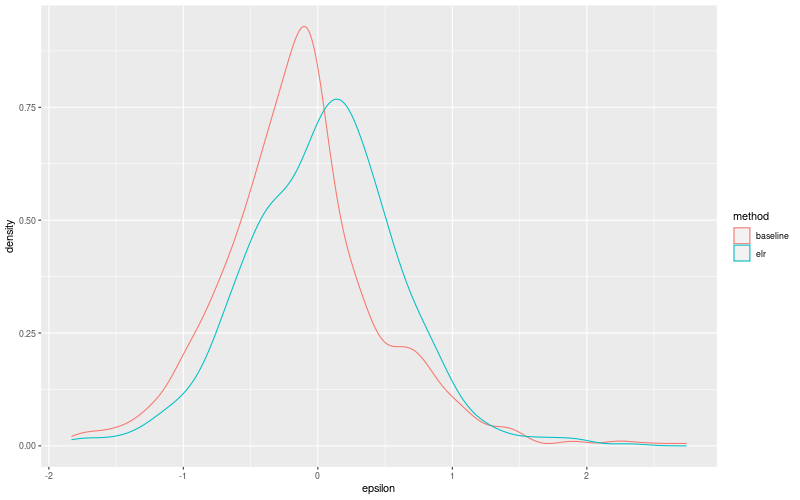
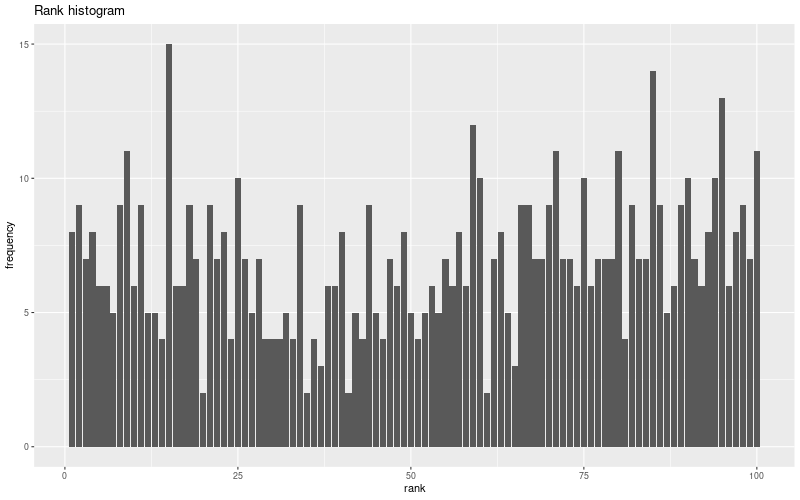
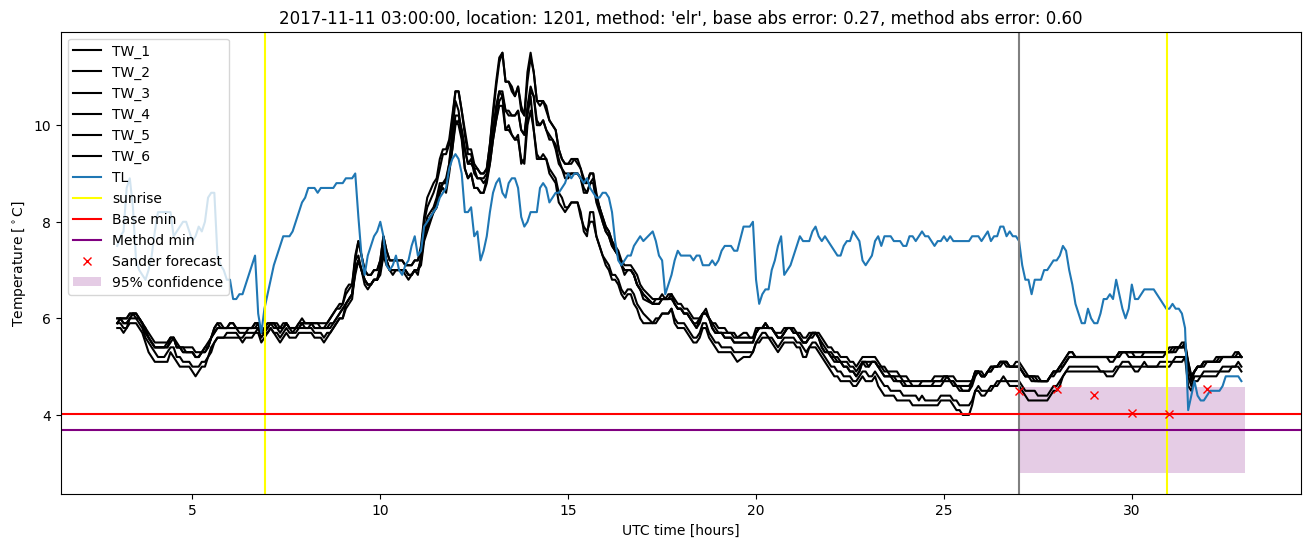
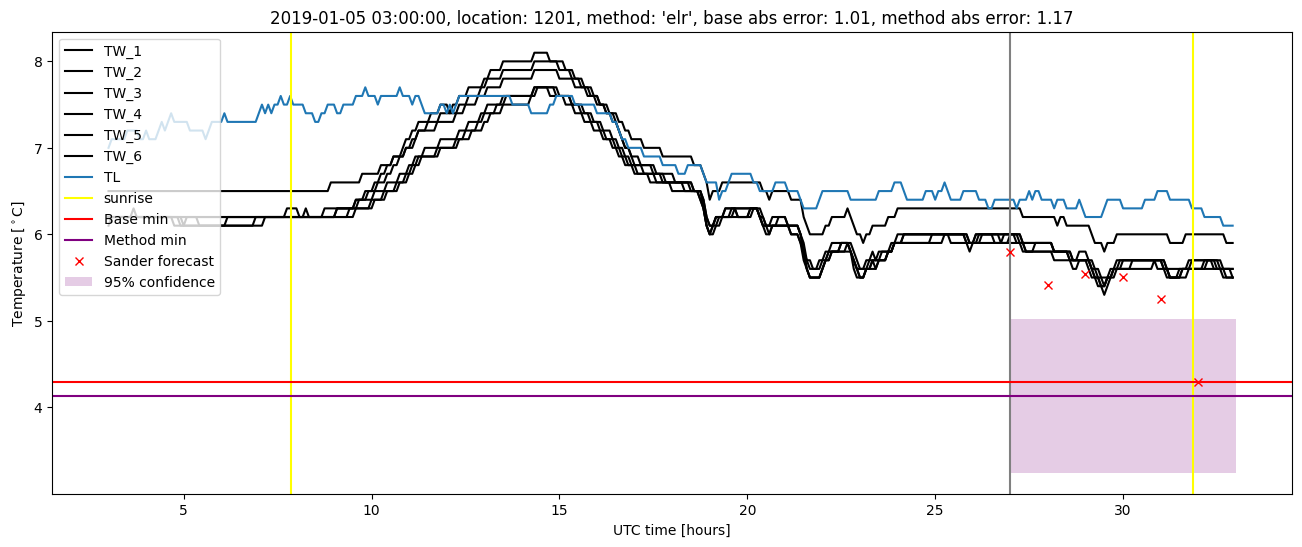
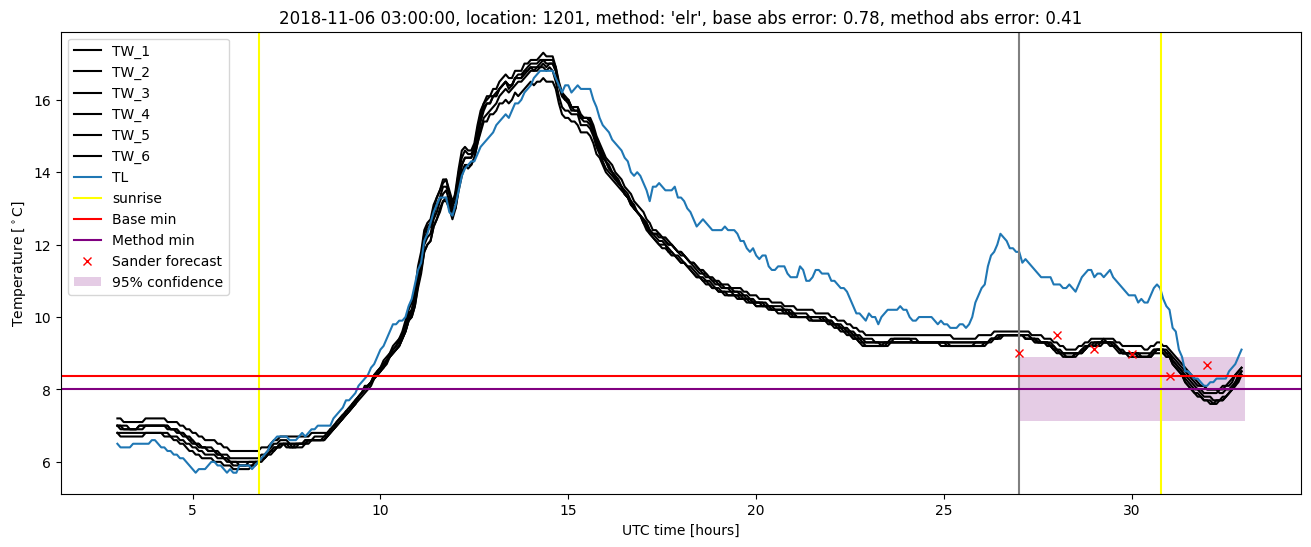
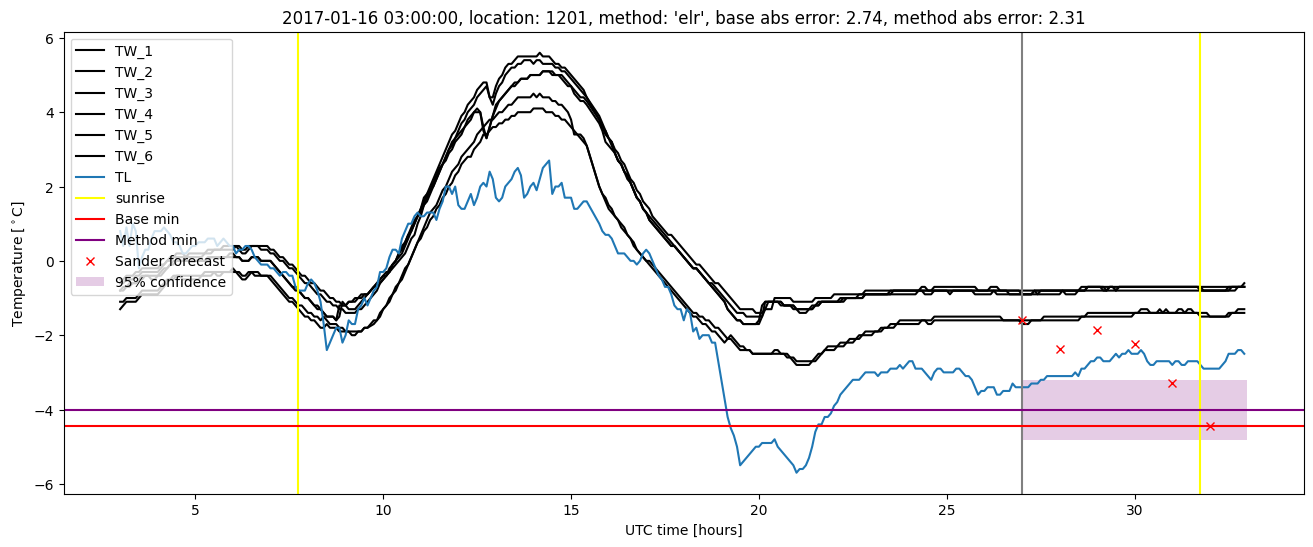
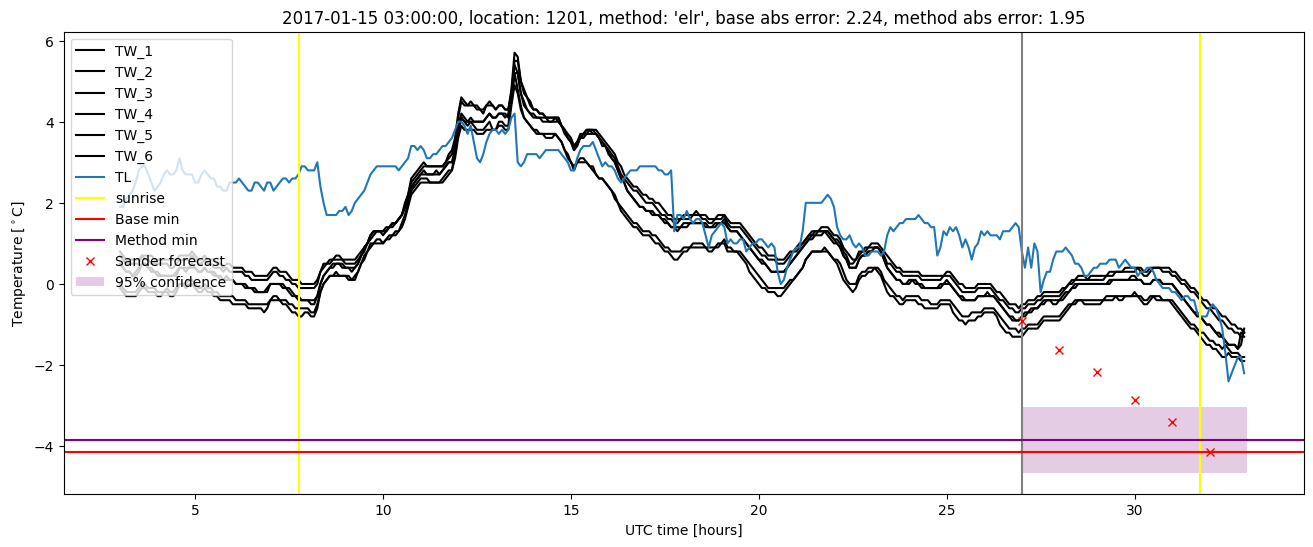
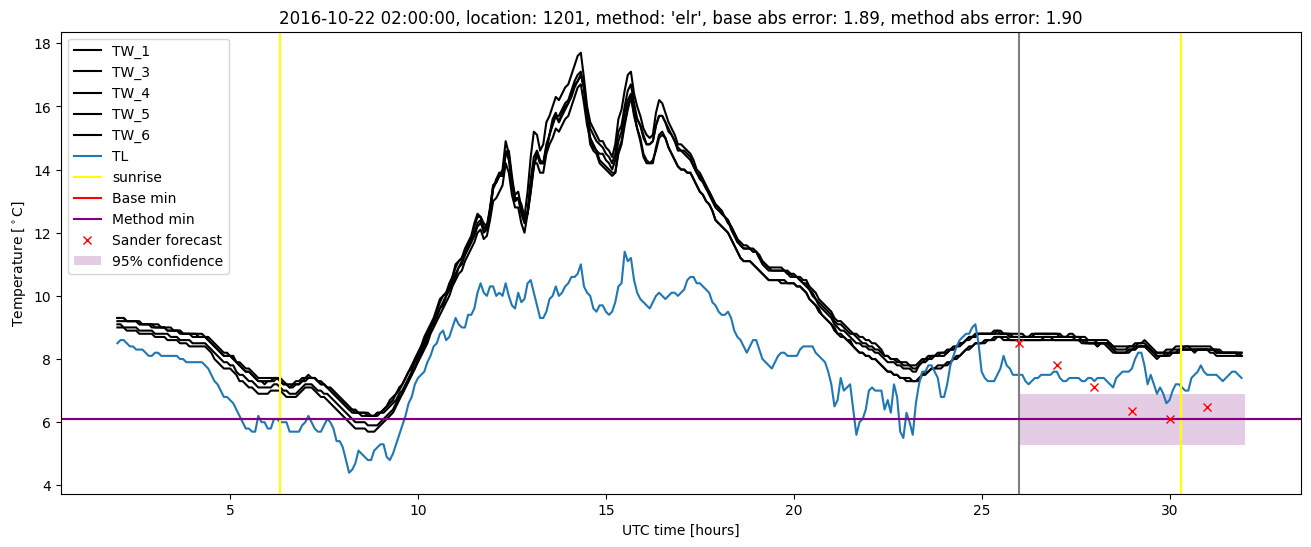
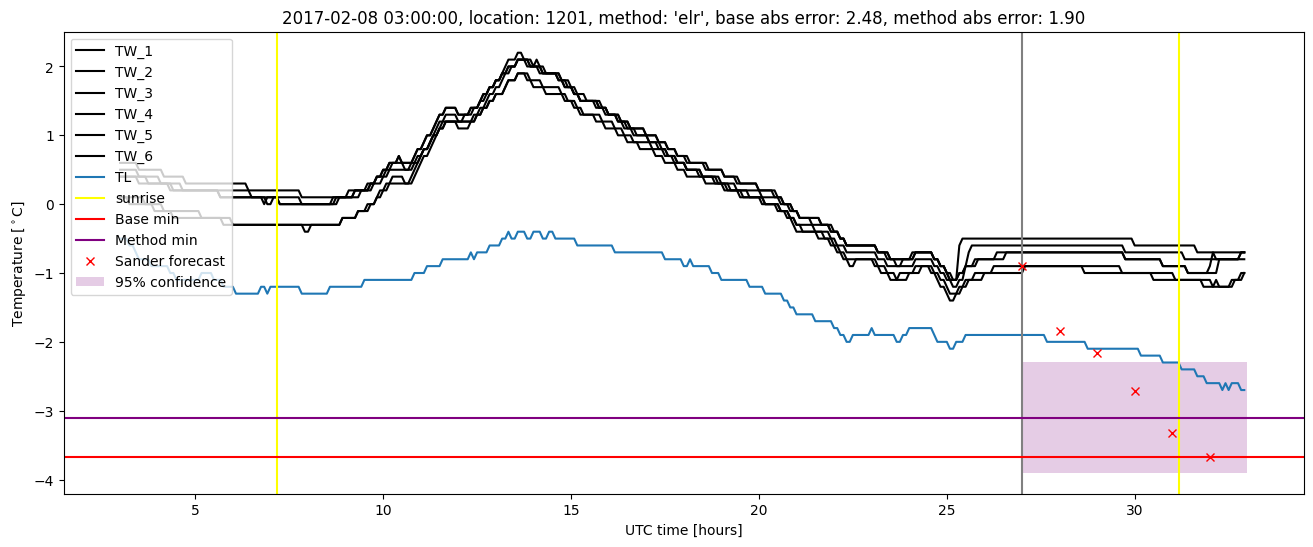
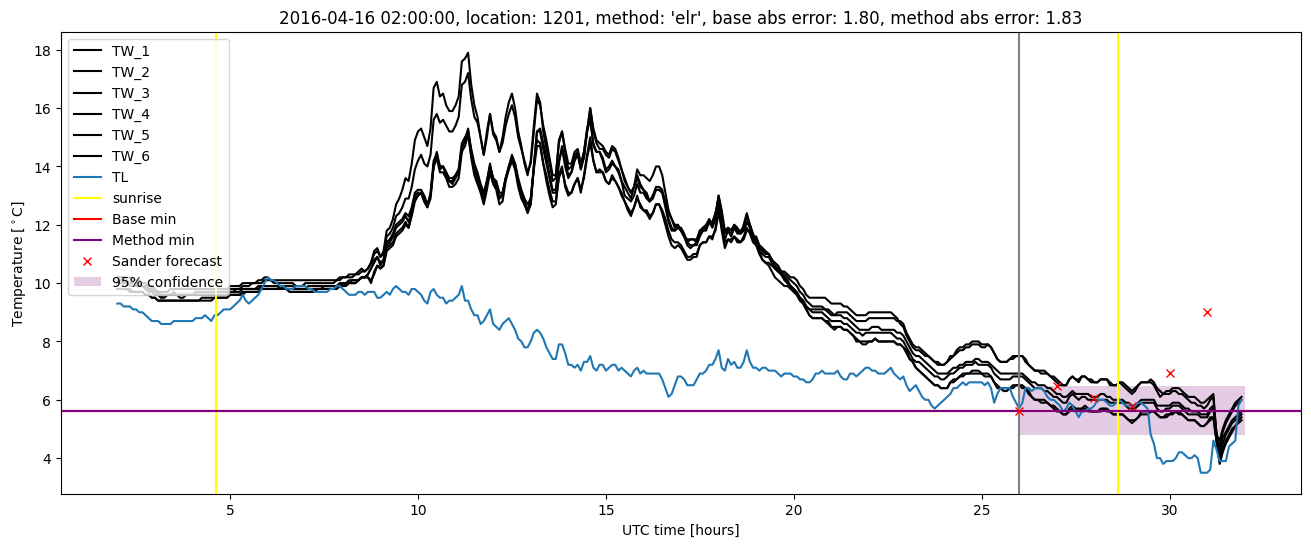
Extended logistic regression plots