GMS location: 1175
Random forest results
| names |
period |
power |
significance |
meanSquareError |
absError |
maxError |
CRPS |
IGN |
| baseline |
winter 2016 |
0.989 |
0.000e+00 |
0.337 |
0.420 |
2.282 |
NaN |
NaN |
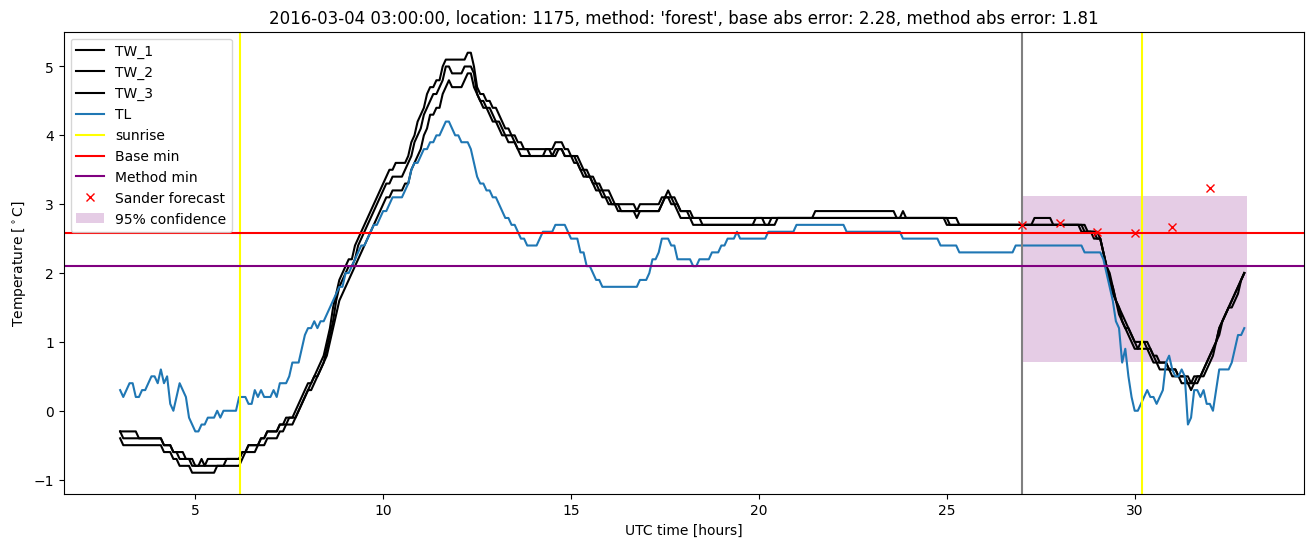
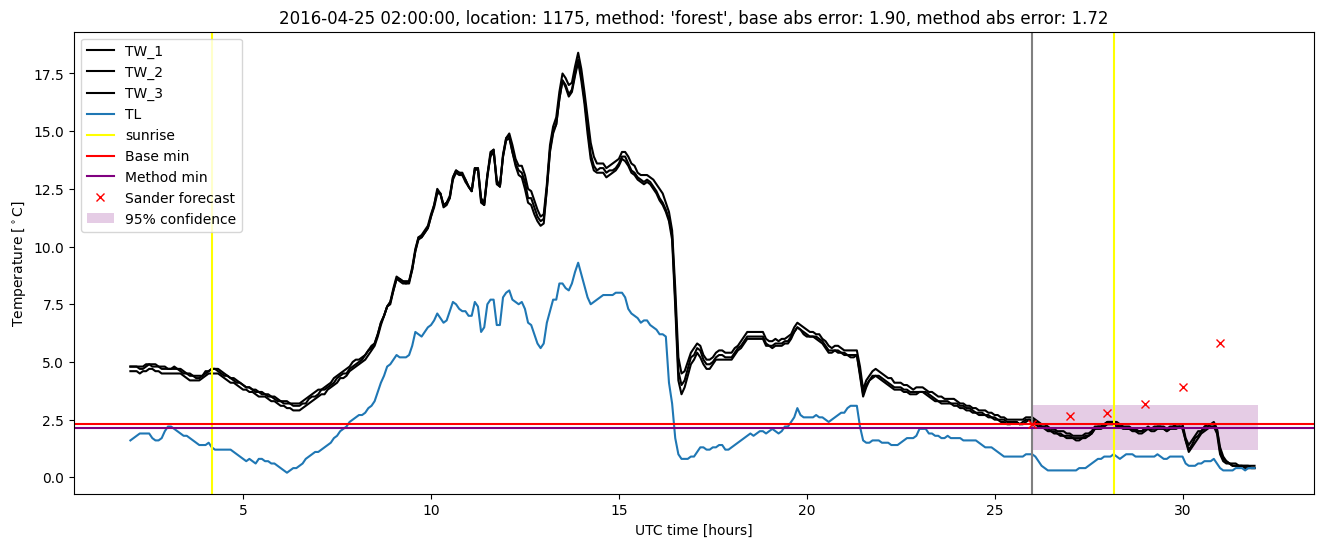
| forest |
winter 2016 |
0.983 |
0.000e+00 |
0.278 |
0.386 |
1.808 |
0.529 |
2.965 |
| baseline |
winter 2017 |
0.983 |
0.026 |
0.369 |
0.445 |
1.815 |
NaN |
NaN |
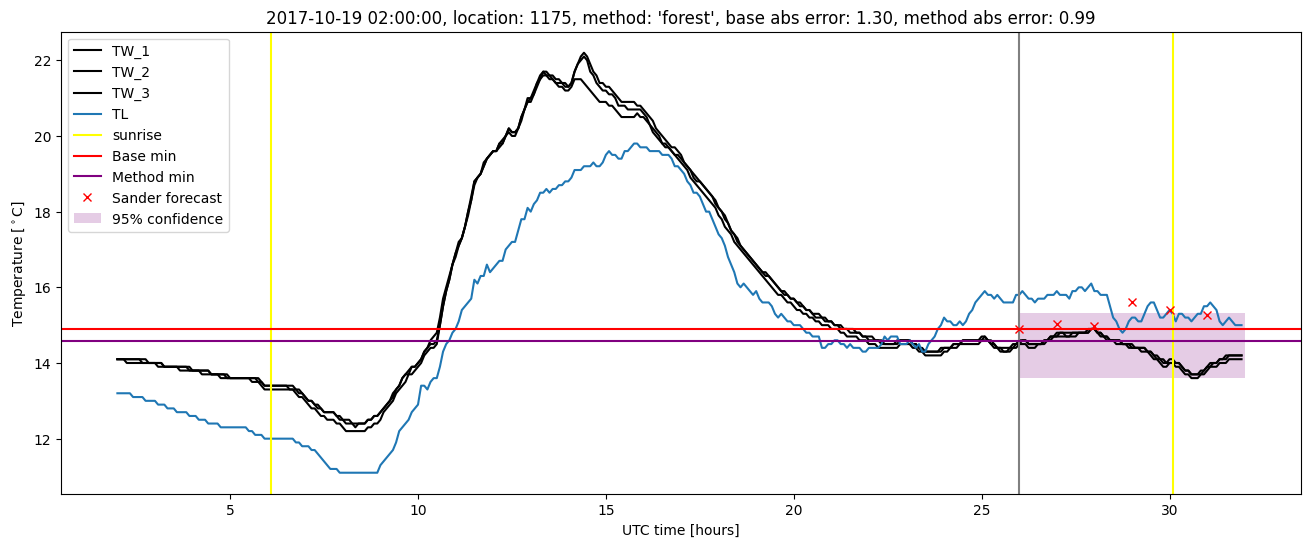
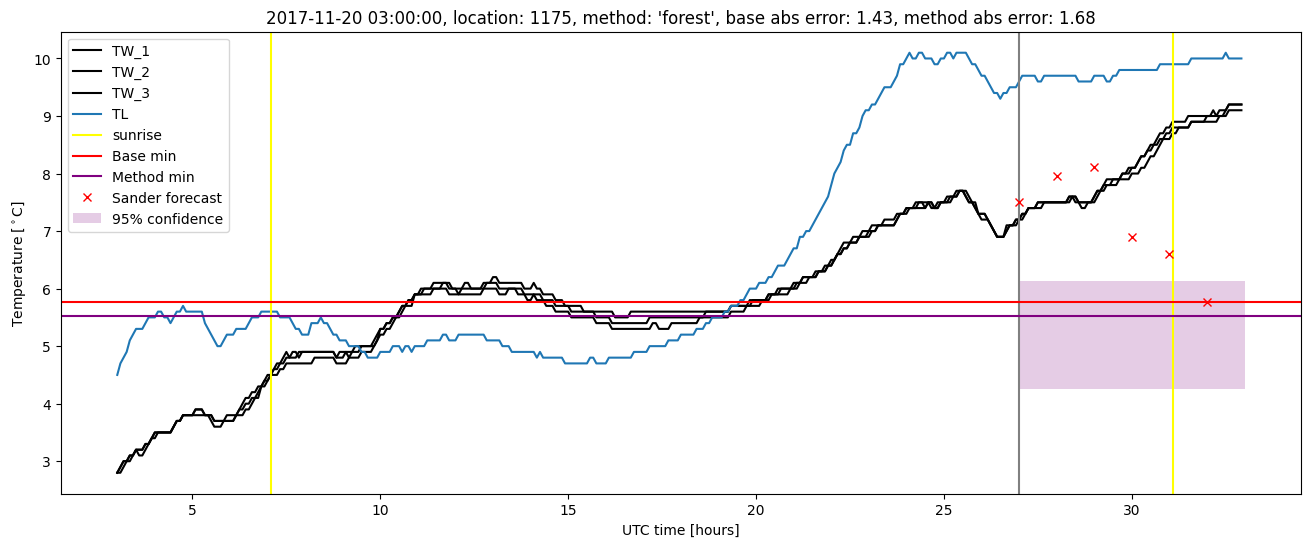
| forest |
winter 2017 |
0.983 |
0.026 |
0.290 |
0.397 |
1.626 |
0.518 |
4.227 |
| baseline |
winter 2018 |
0.978 |
0.125 |
0.379 |
0.436 |
2.033 |
NaN |
NaN |
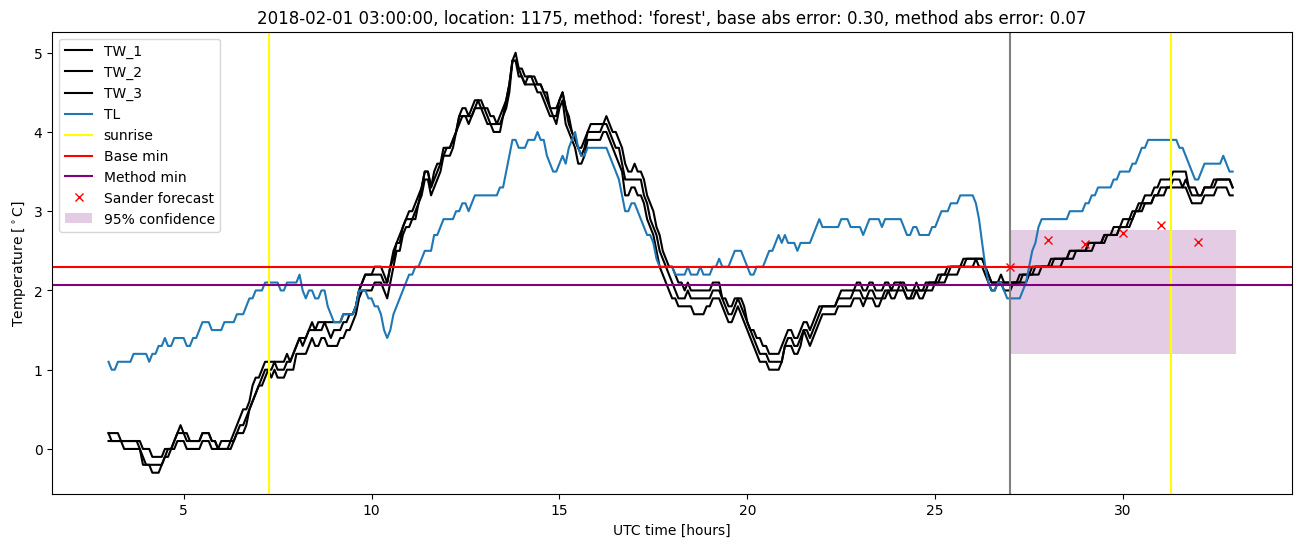
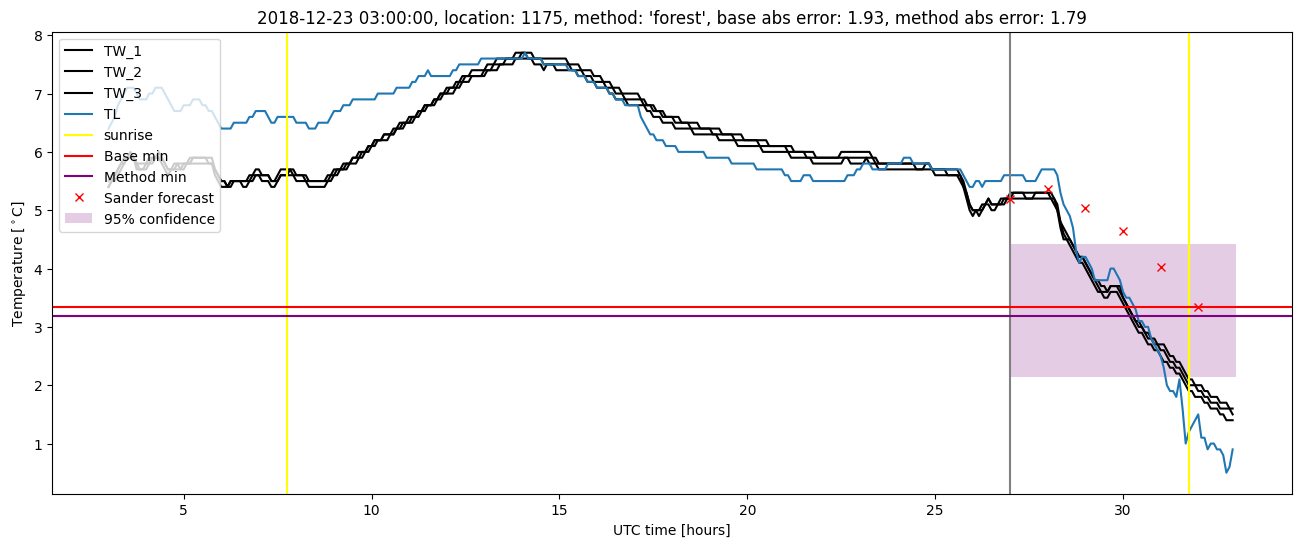
| forest |
winter 2018 |
0.986 |
0.125 |
0.323 |
0.425 |
1.681 |
0.537 |
3.680 |
| baseline |
winter 2019 |
0.993 |
0.000e+00 |
0.384 |
0.406 |
3.084 |
NaN |
NaN |
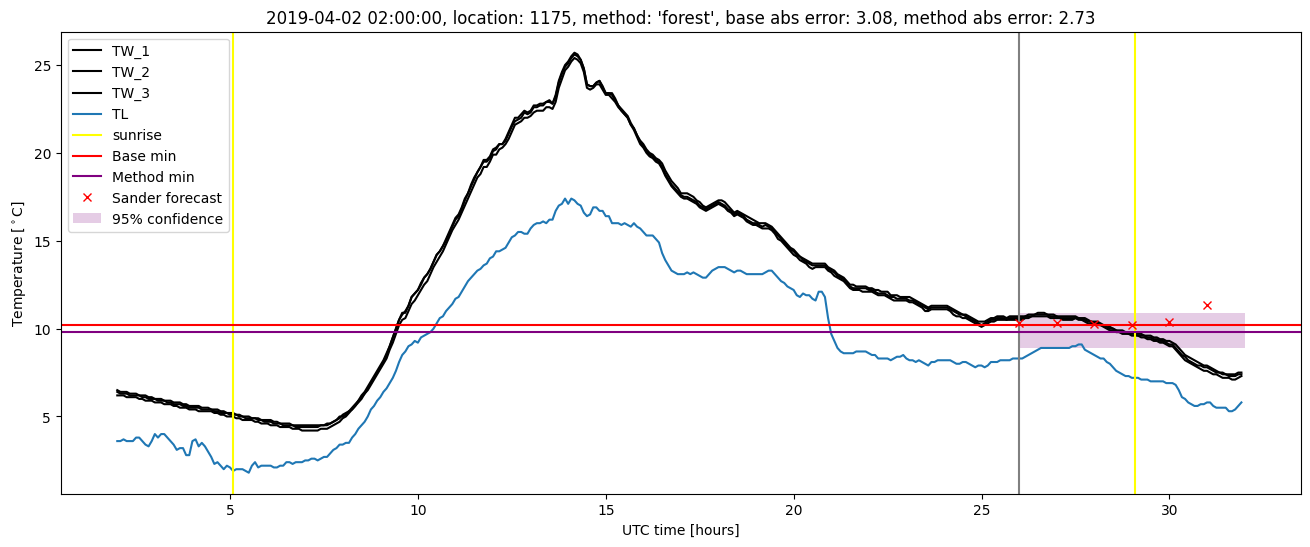
| forest |
winter 2019 |
0.993 |
0.000e+00 |
0.297 |
0.383 |
2.729 |
0.520 |
3.845 |
| baseline |
all |
0.986 |
0.043 |
0.365 |
0.426 |
3.084 |
NaN |
NaN |
| forest |
all |
0.986 |
0.043 |
0.296 |
0.397 |
2.729 |
0.526 |
3.623 |
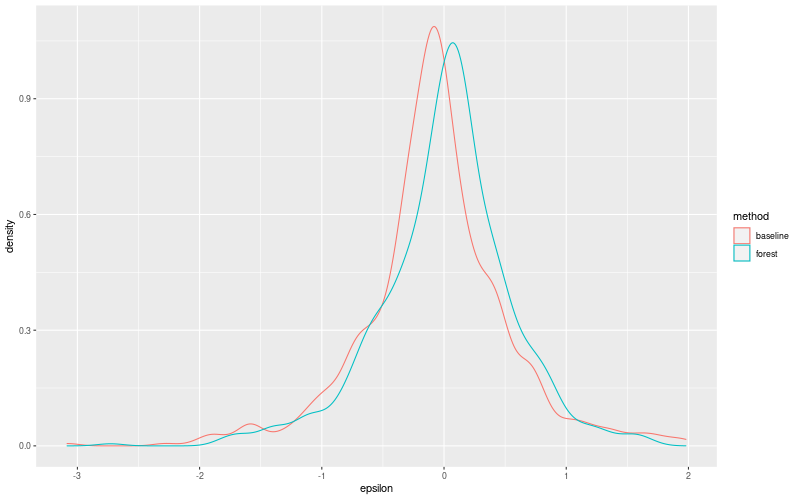
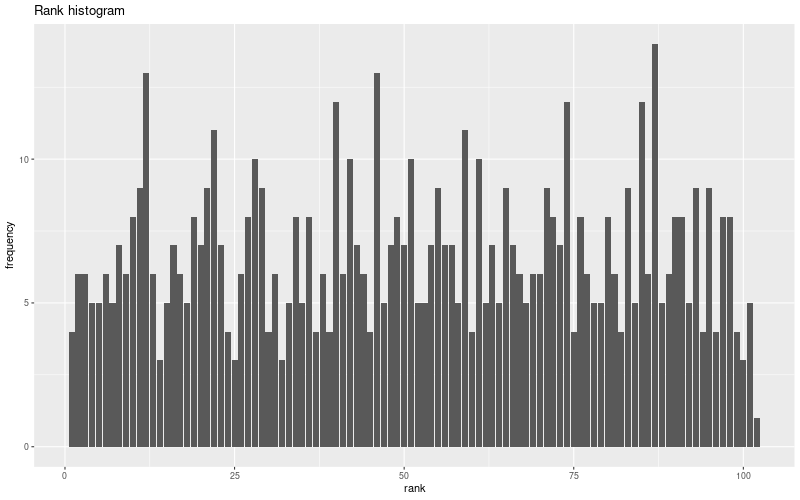
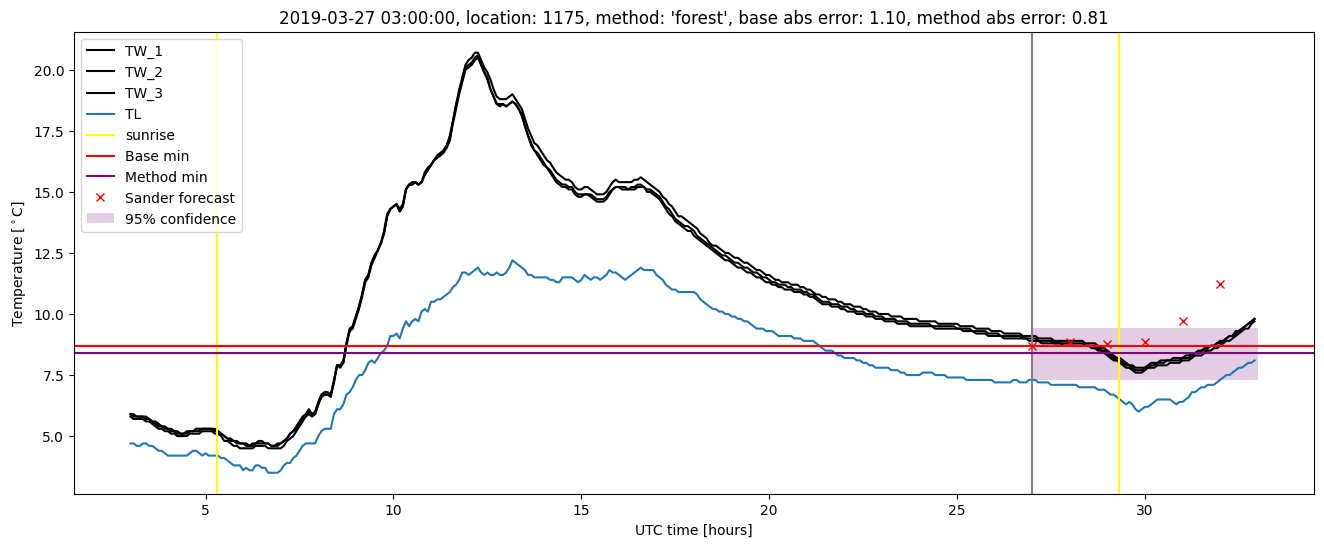
Random forest plots
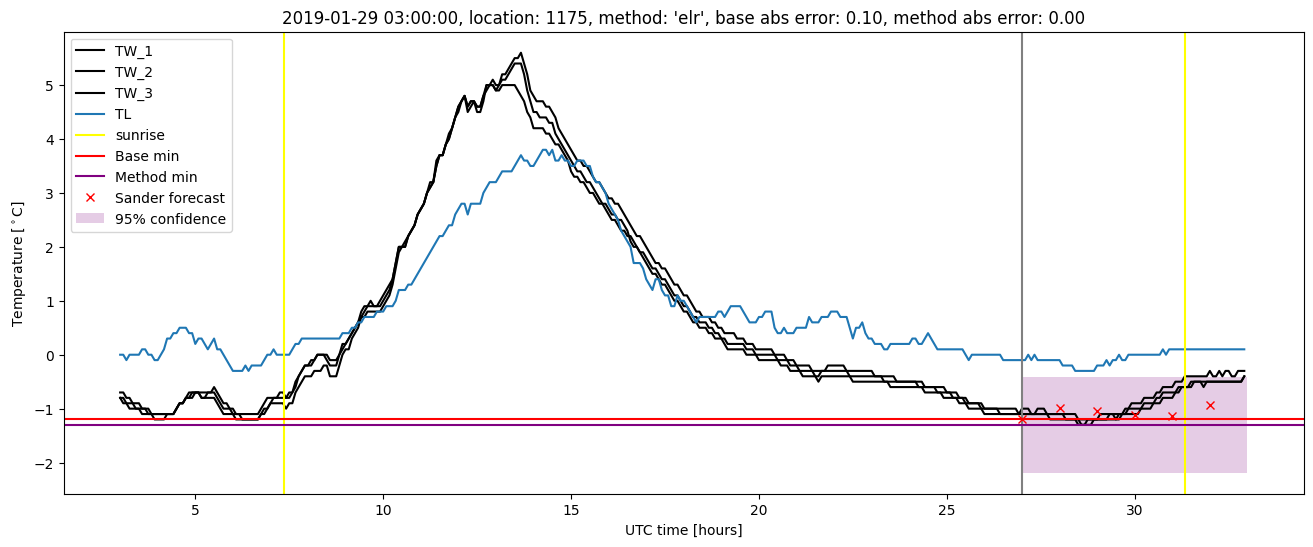
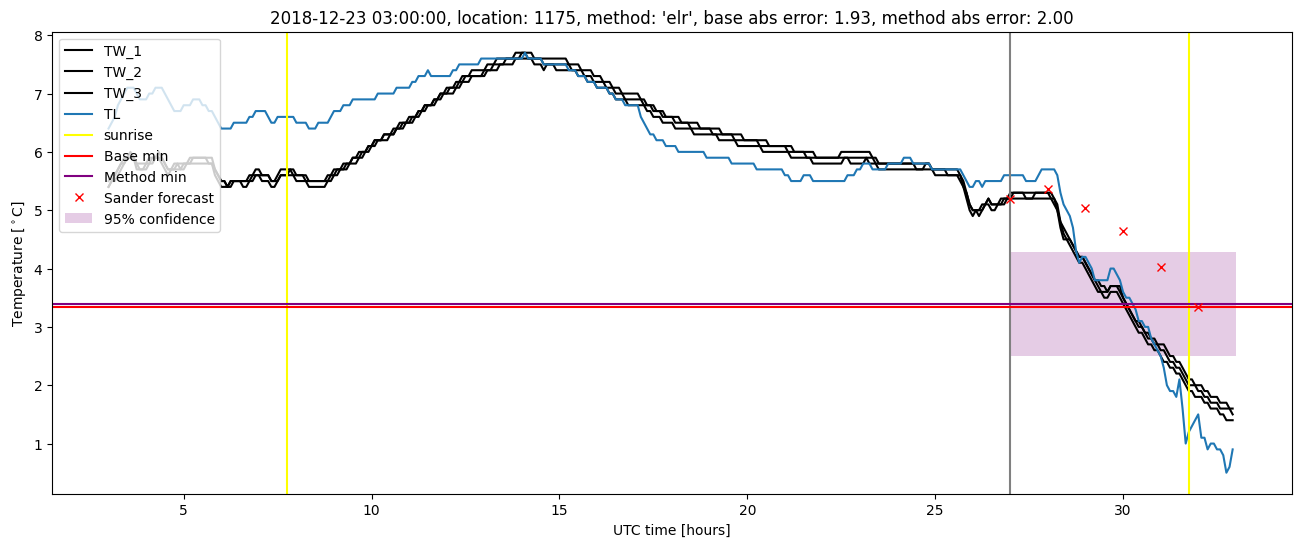
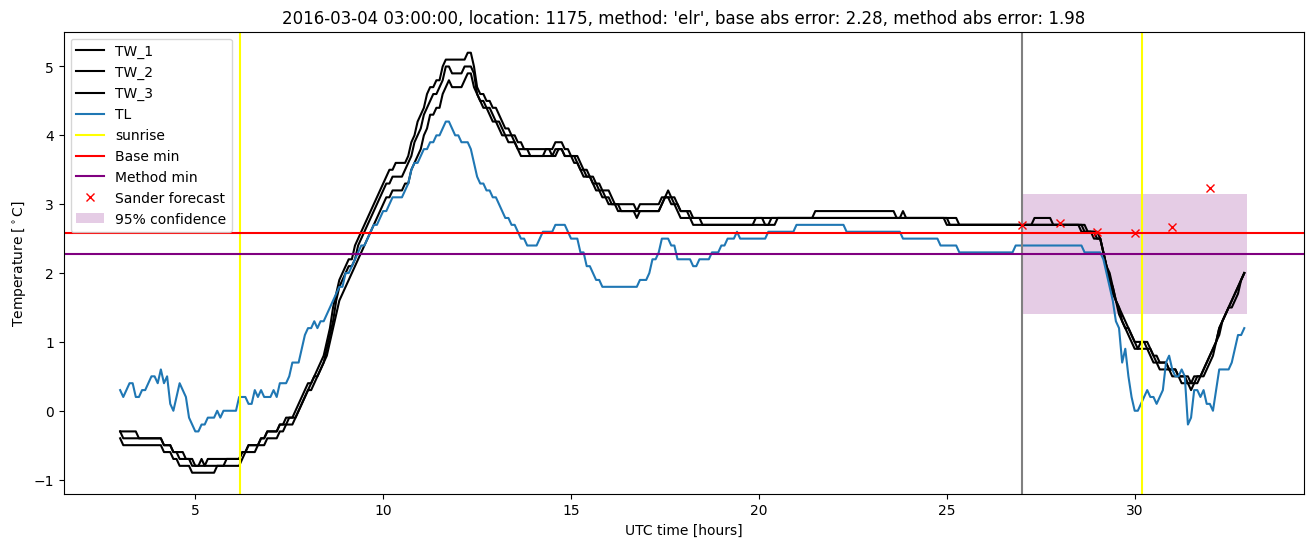
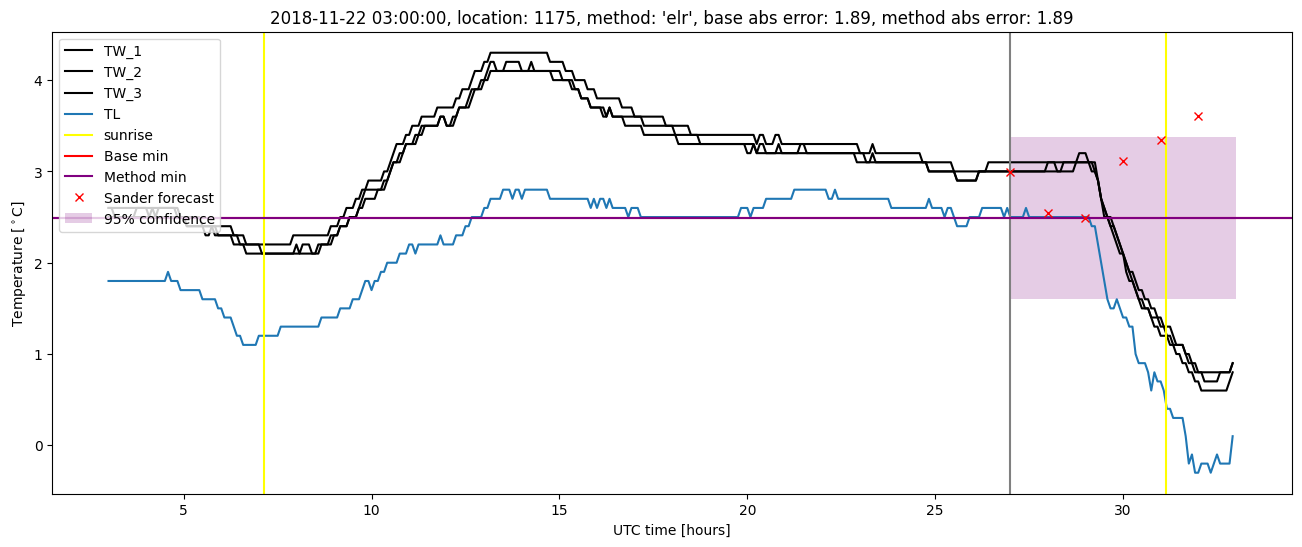
Extended logistic regression results
| names |
period |
power |
significance |
meanSquareError |
absError |
maxError |
CRPS |
IGN |
| baseline |
winter 2016 |
0.989 |
0.000e+00 |
0.337 |
0.420 |
2.282 |
NaN |
NaN |
| elr |
winter 2016 |
0.983 |
0.000e+00 |
0.339 |
0.458 |
1.982 |
0.618 |
5.646 |
| baseline |
winter 2017 |
0.983 |
0.026 |
0.369 |
0.445 |
1.815 |
NaN |
NaN |
| elr |
winter 2017 |
0.983 |
0.026 |
0.317 |
0.412 |
1.867 |
0.537 |
3.543 |
| baseline |
winter 2018 |
0.978 |
0.125 |
0.379 |
0.436 |
2.033 |
NaN |
NaN |
| elr |
winter 2018 |
0.986 |
0.156 |
0.344 |
0.455 |
1.809 |
0.610 |
5.175 |
| baseline |
winter 2019 |
0.993 |
0.000e+00 |
0.384 |
0.406 |
3.084 |
NaN |
NaN |
| elr |
winter 2019 |
0.993 |
0.000e+00 |
0.373 |
0.438 |
2.901 |
0.531 |
3.914 |
| baseline |
all |
0.986 |
0.043 |
0.365 |
0.426 |
3.084 |
NaN |
NaN |
| elr |
all |
0.986 |
0.052 |
0.343 |
0.442 |
2.901 |
0.579 |
4.669 |
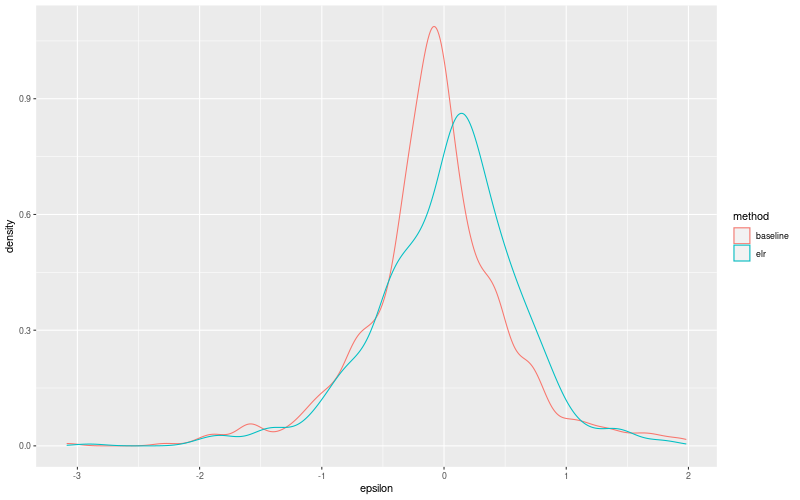
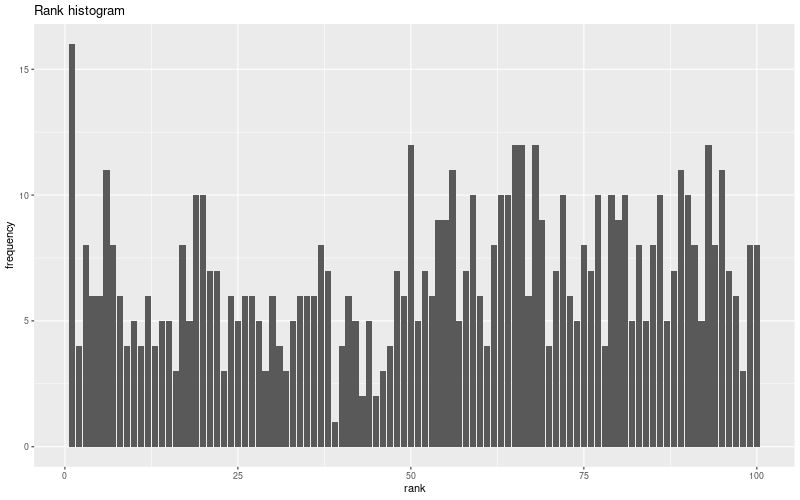
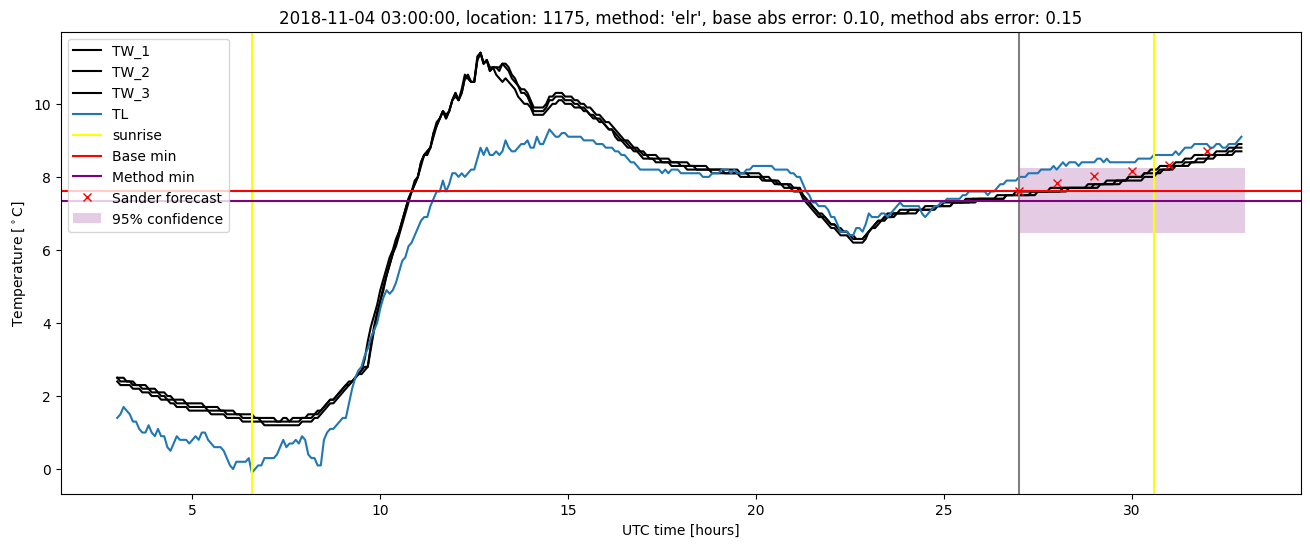
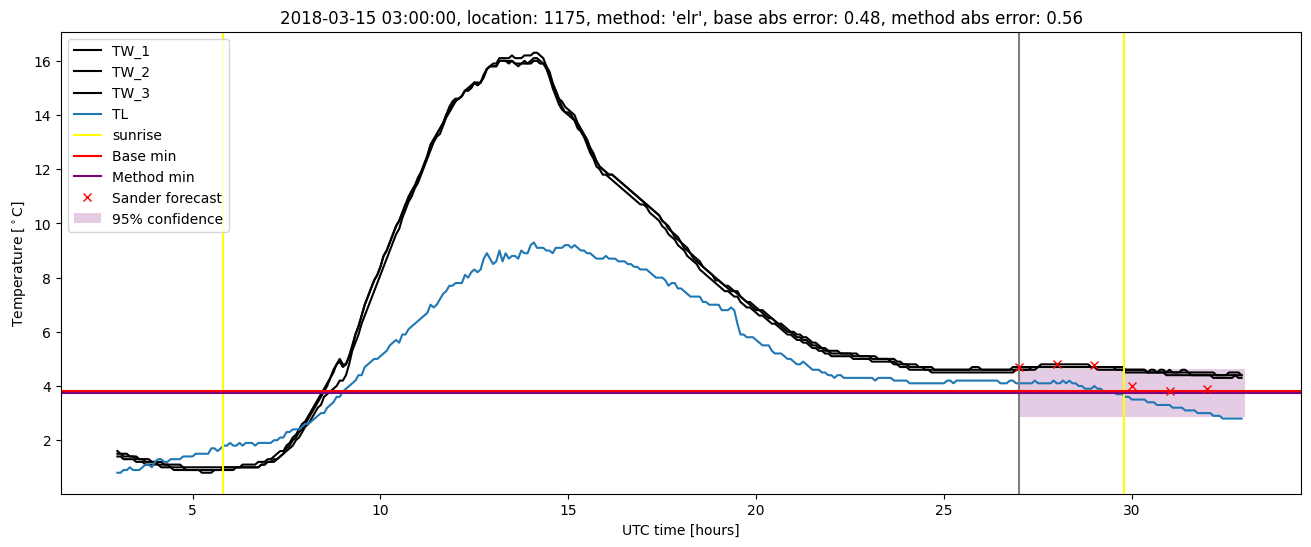
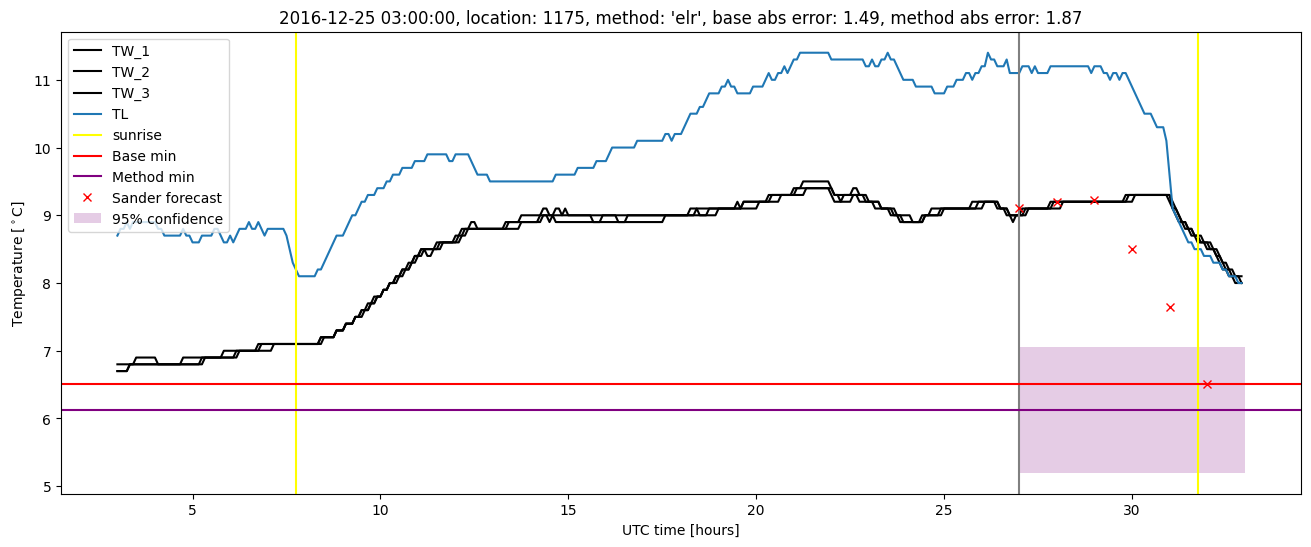
Extended logistic regression plots