GMS location: 1173
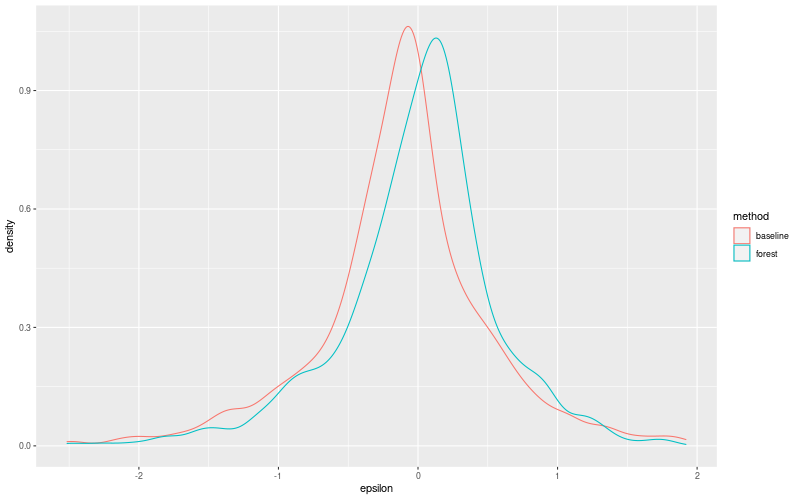
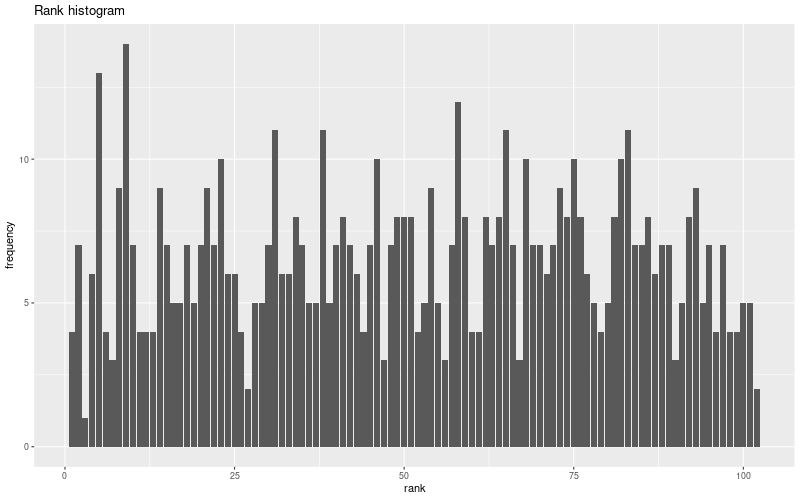
Random forest results
| names |
period |
power |
significance |
meanSquareError |
absError |
maxError |
CRPS |
IGN |
| baseline |
winter 2016 |
0.994 |
0.094 |
0.311 |
0.411 |
2.161 |
NaN |
NaN |
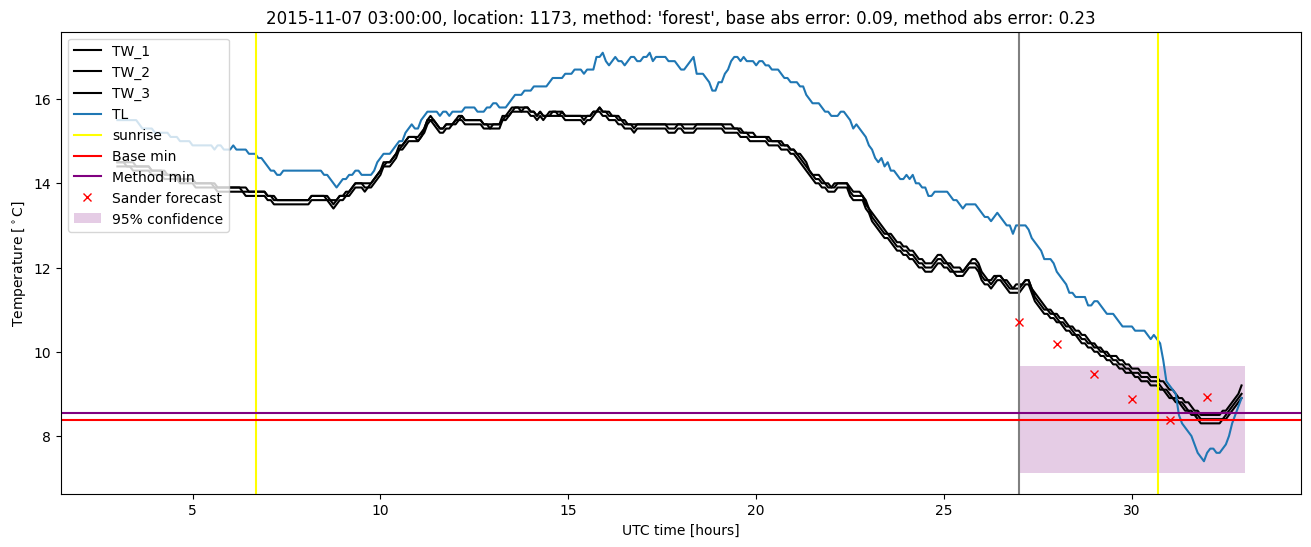
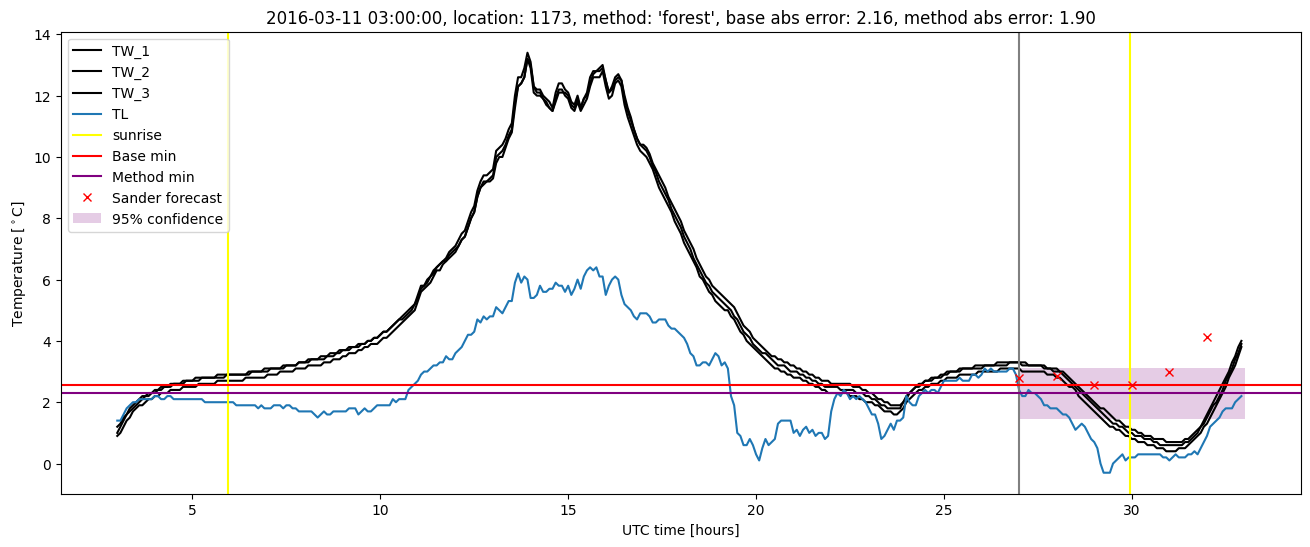
| forest |
winter 2016 |
0.994 |
0.062 |
0.286 |
0.395 |
1.903 |
0.550 |
3.413 |
| baseline |
winter 2017 |
0.975 |
0.000e+00 |
0.392 |
0.456 |
1.920 |
NaN |
NaN |
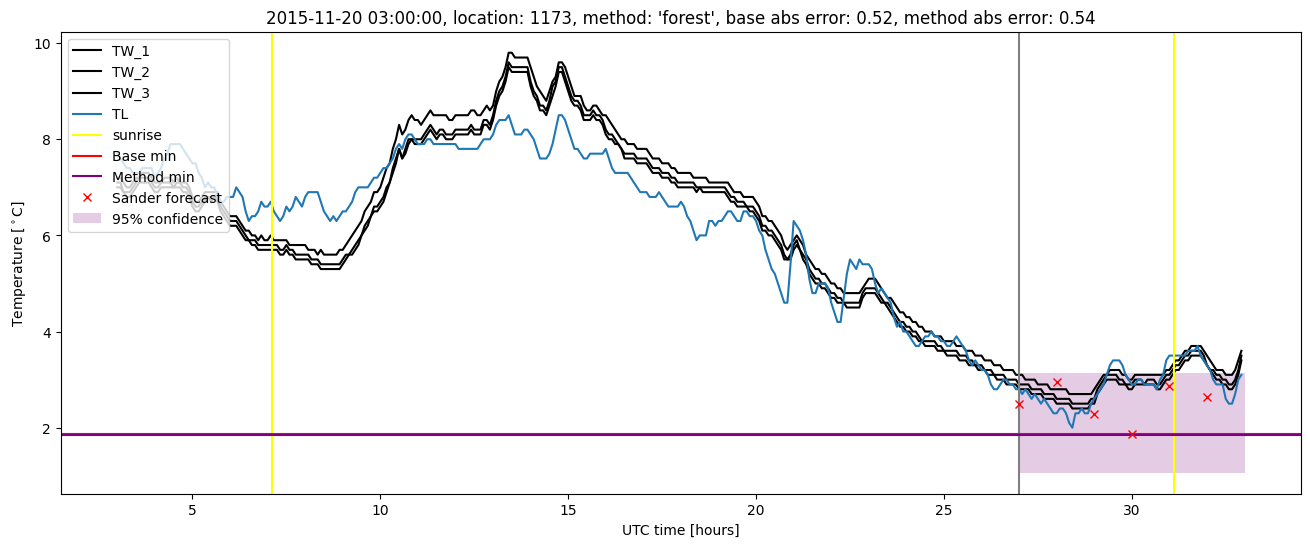
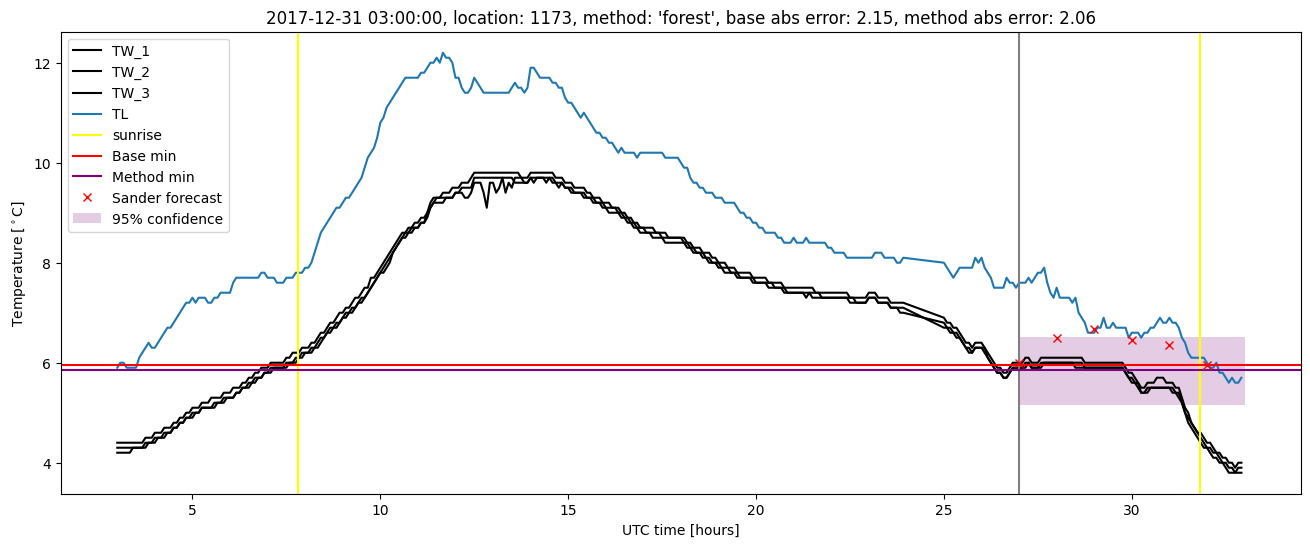
| forest |
winter 2017 |
0.992 |
0.000e+00 |
0.308 |
0.416 |
1.661 |
0.532 |
4.010 |
| baseline |
winter 2018 |
0.985 |
0.088 |
0.487 |
0.468 |
2.514 |
NaN |
NaN |
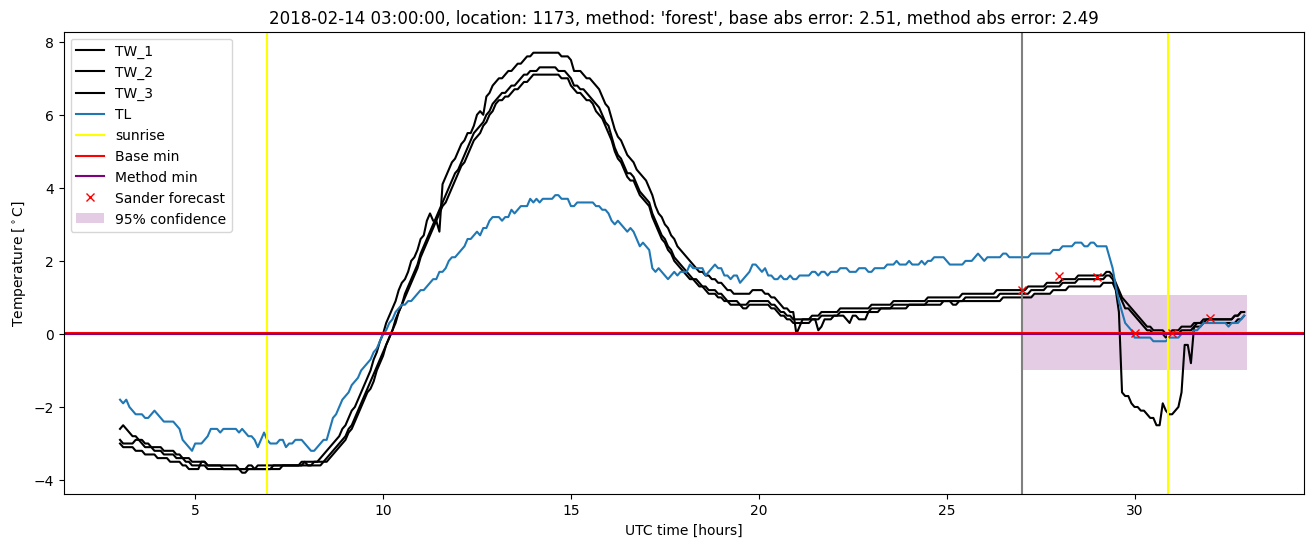
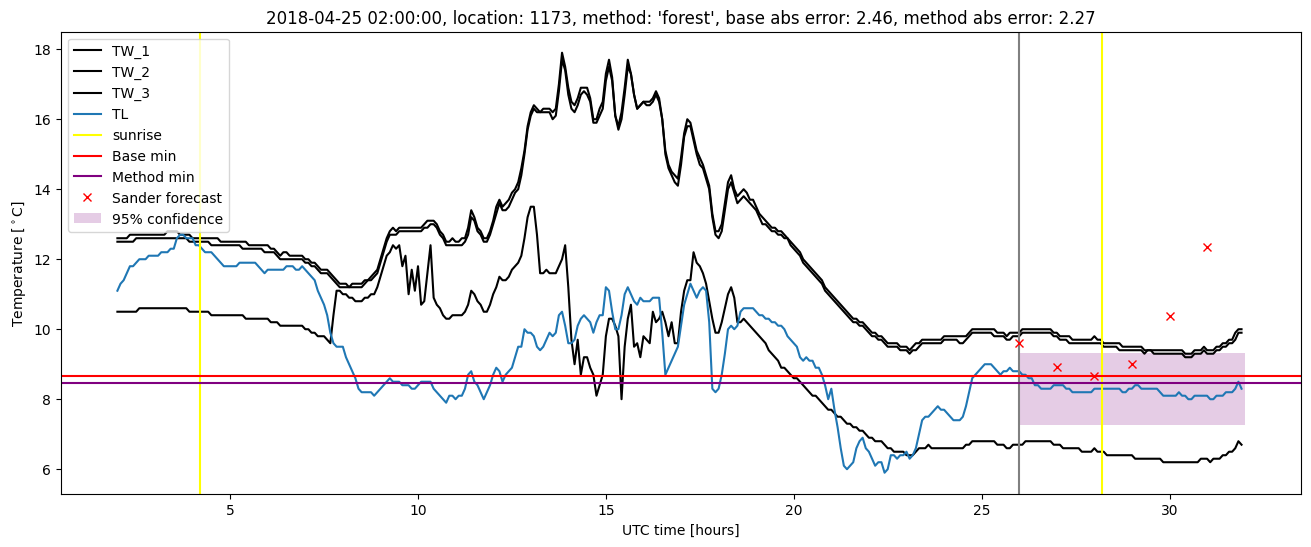
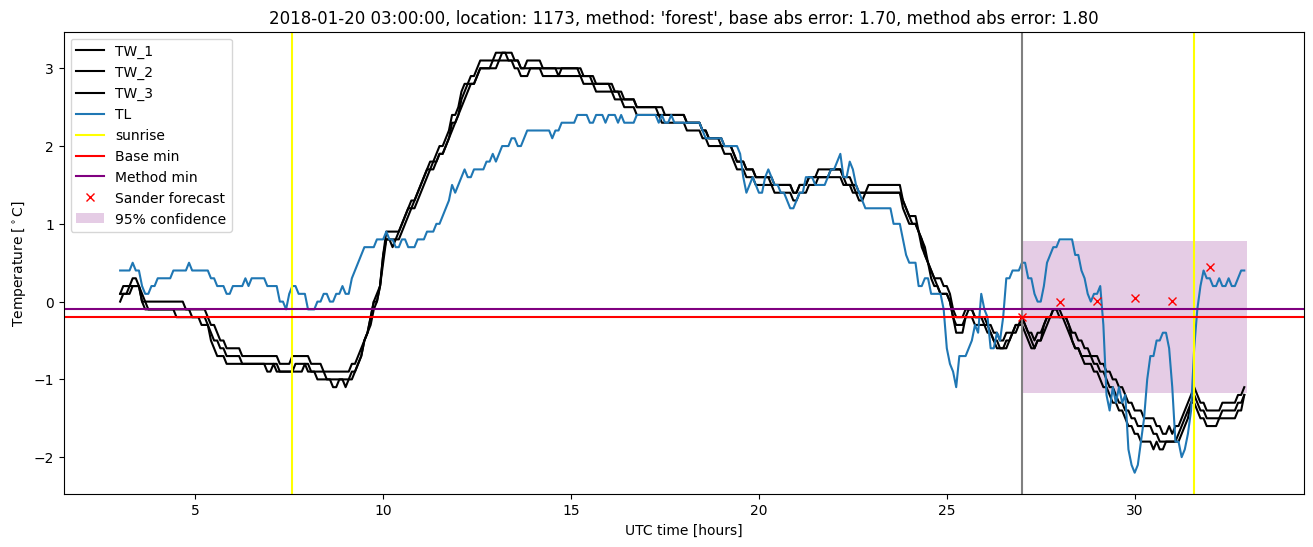
| forest |
winter 2018 |
0.978 |
0.059 |
0.436 |
0.456 |
2.491 |
0.542 |
4.054 |
| baseline |
winter 2019 |
0.992 |
0.000e+00 |
0.379 |
0.437 |
1.851 |
NaN |
NaN |
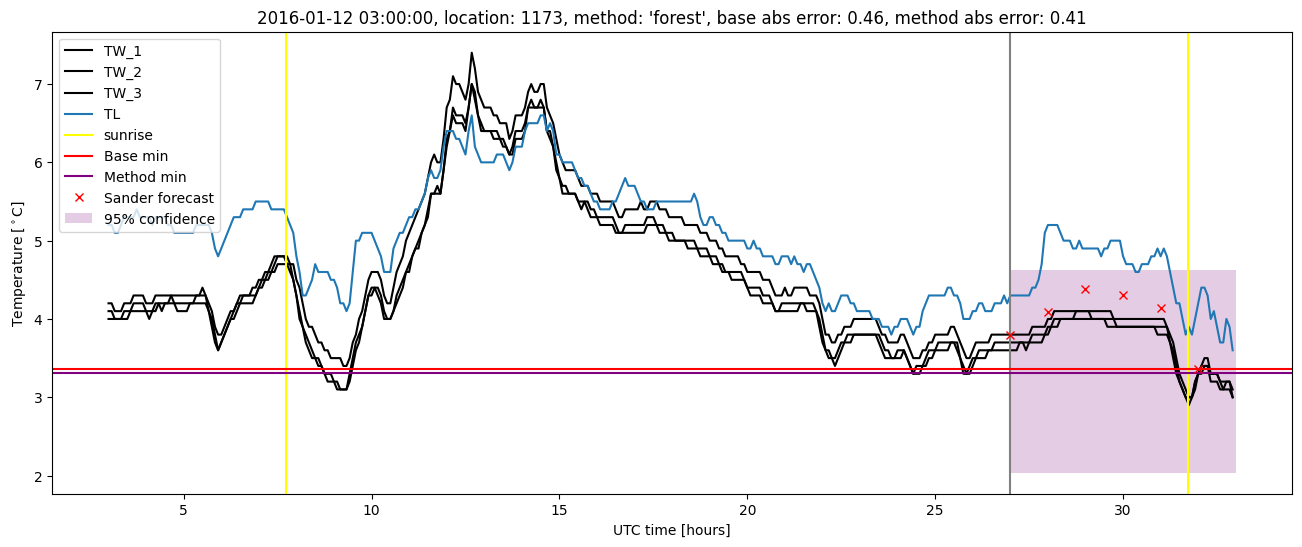
| forest |
winter 2019 |
1.000 |
0.000e+00 |
0.241 |
0.370 |
1.504 |
0.562 |
4.024 |
| baseline |
all |
0.988 |
0.054 |
0.388 |
0.441 |
2.514 |
NaN |
NaN |
| forest |
all |
0.991 |
0.036 |
0.320 |
0.410 |
2.491 |
0.547 |
3.840 |
Random forest plots
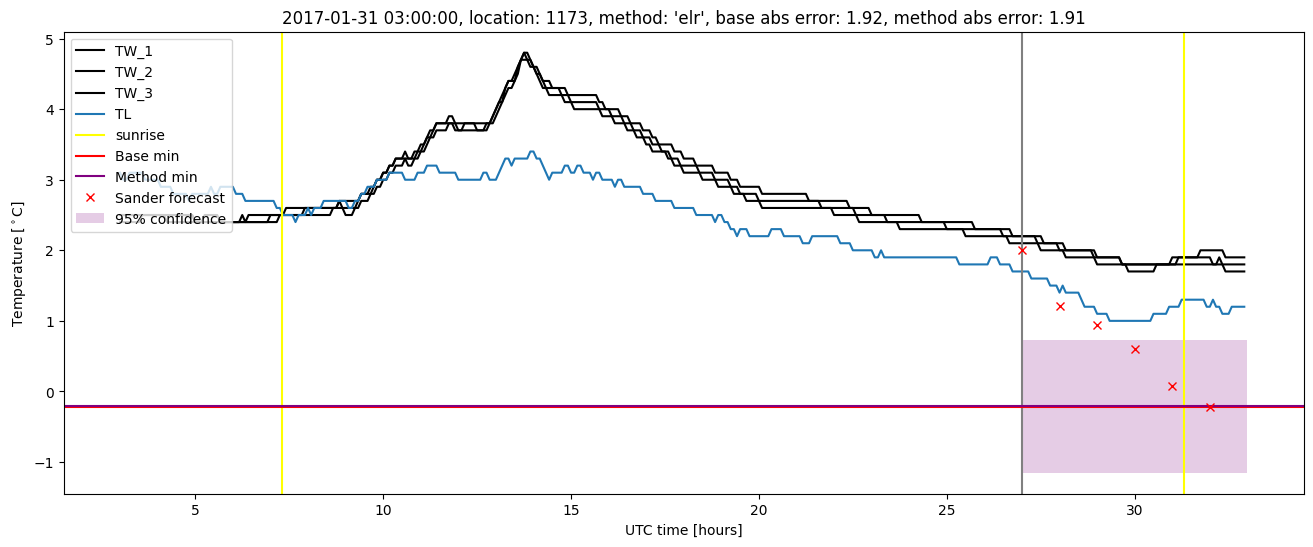
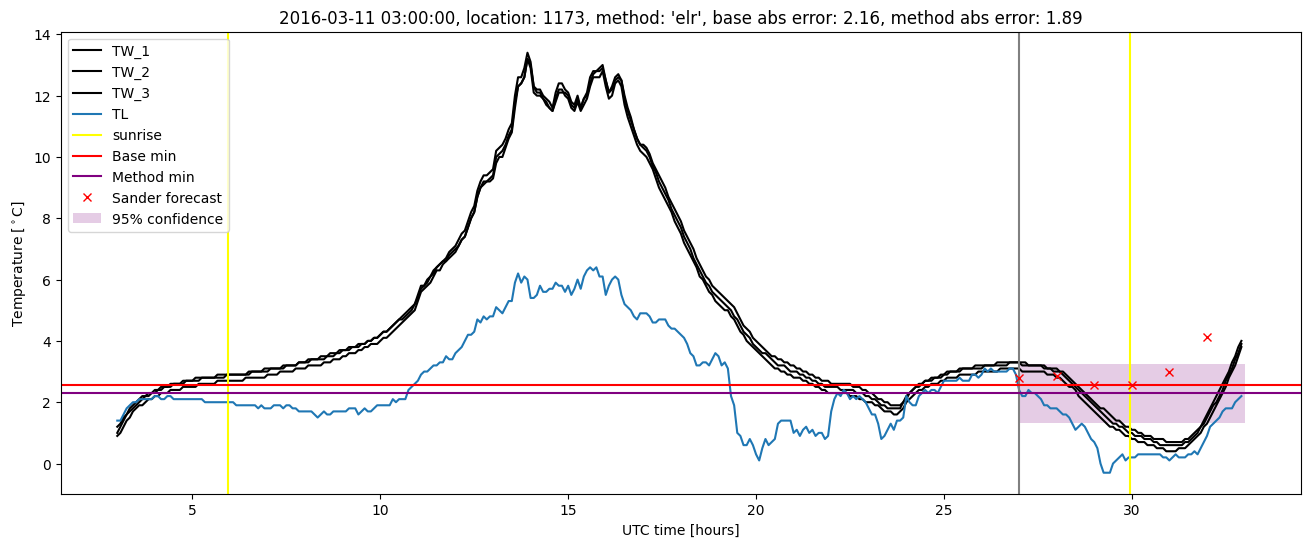
Extended logistic regression results
| names |
period |
power |
significance |
meanSquareError |
absError |
maxError |
CRPS |
IGN |
| baseline |
winter 2016 |
0.994 |
0.094 |
0.311 |
0.411 |
2.161 |
NaN |
NaN |
| elr |
winter 2016 |
0.994 |
0.094 |
0.303 |
0.426 |
1.895 |
0.630 |
4.005 |
| baseline |
winter 2017 |
0.975 |
0.000e+00 |
0.392 |
0.456 |
1.920 |
NaN |
NaN |
| elr |
winter 2017 |
0.983 |
0.000e+00 |
0.368 |
0.451 |
1.913 |
0.581 |
3.924 |
| baseline |
winter 2018 |
0.985 |
0.088 |
0.487 |
0.468 |
2.514 |
NaN |
NaN |
| elr |
winter 2018 |
0.978 |
0.147 |
0.450 |
0.489 |
2.561 |
0.624 |
5.105 |
| baseline |
winter 2019 |
0.992 |
0.000e+00 |
0.379 |
0.437 |
1.851 |
NaN |
NaN |
| elr |
winter 2019 |
0.992 |
0.000e+00 |
0.350 |
0.460 |
1.698 |
0.613 |
4.075 |
| baseline |
all |
0.988 |
0.054 |
0.388 |
0.441 |
2.514 |
NaN |
NaN |
| elr |
all |
0.988 |
0.073 |
0.365 |
0.455 |
2.561 |
0.614 |
4.279 |
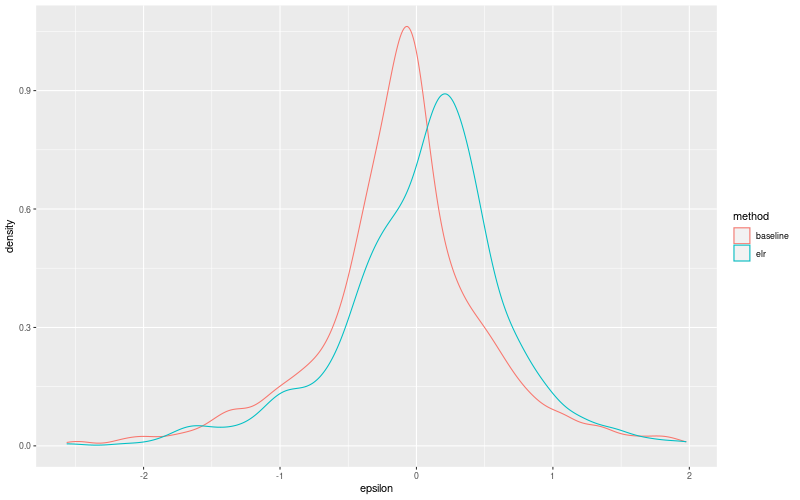
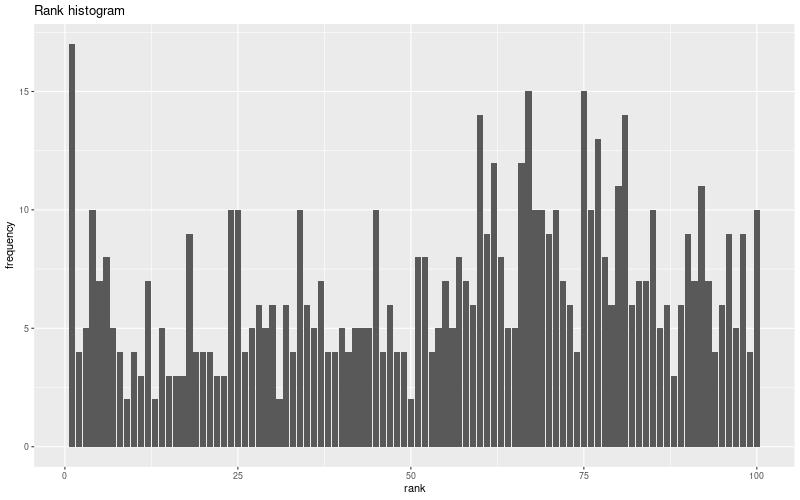
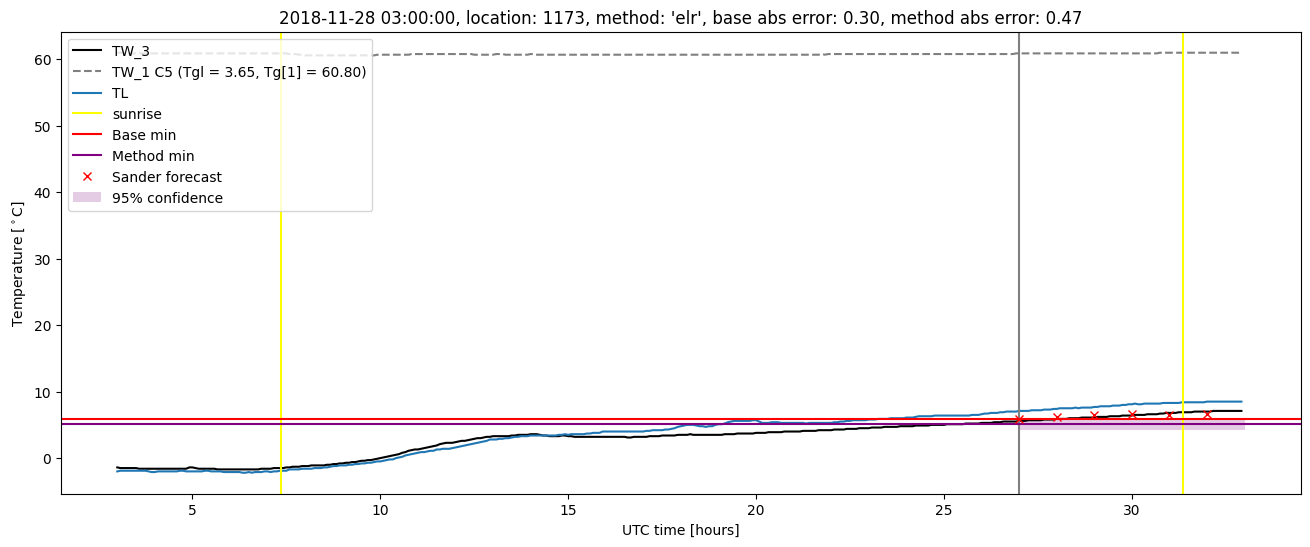
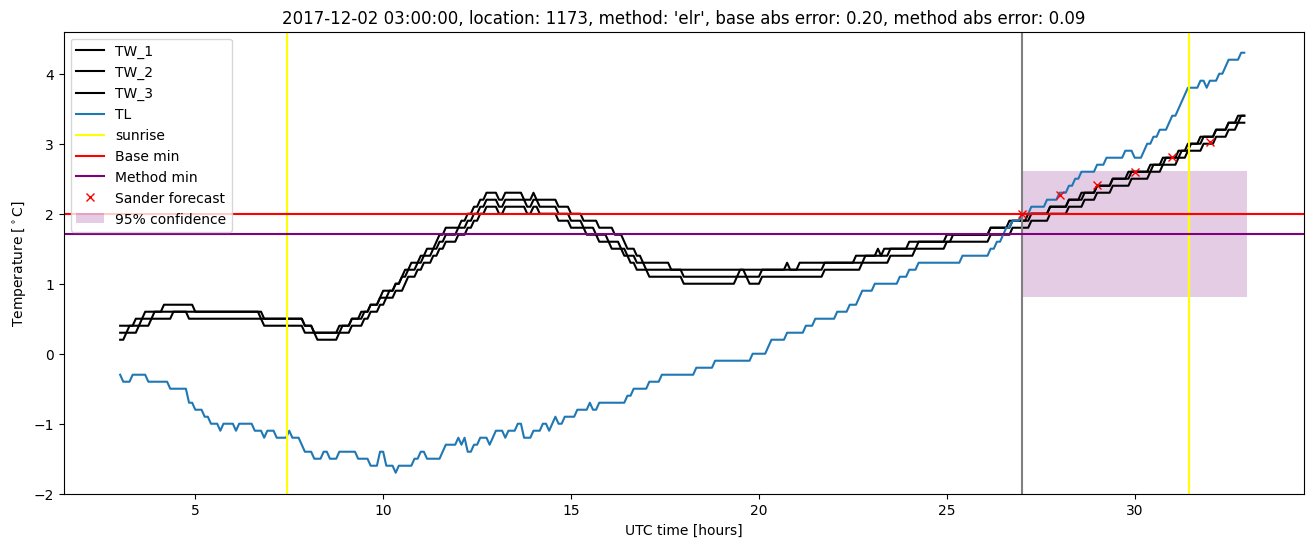
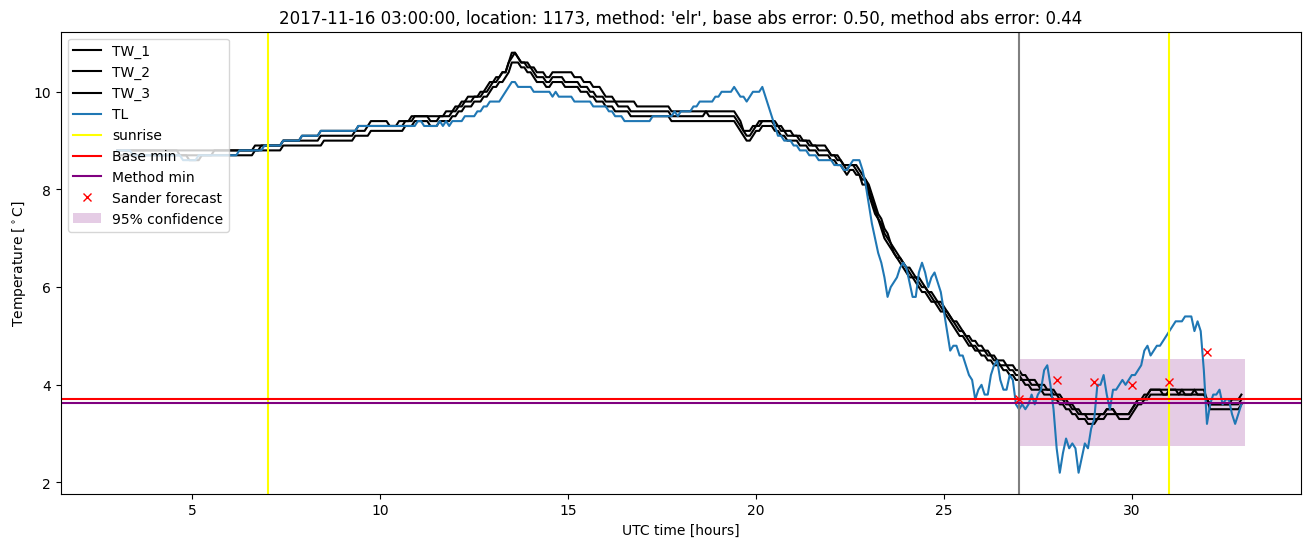
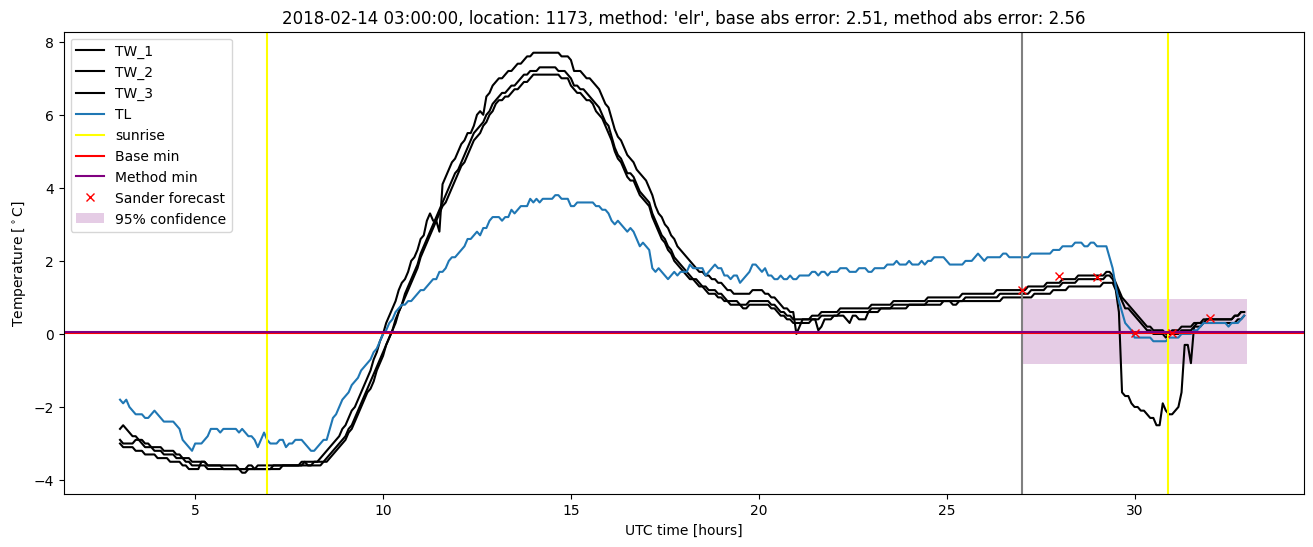
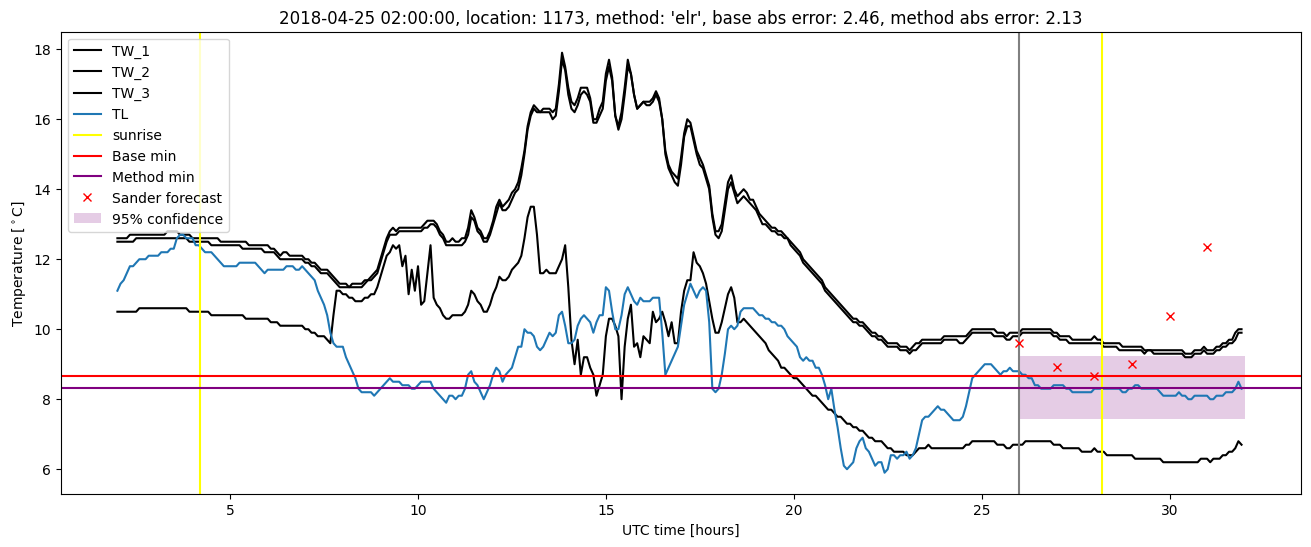
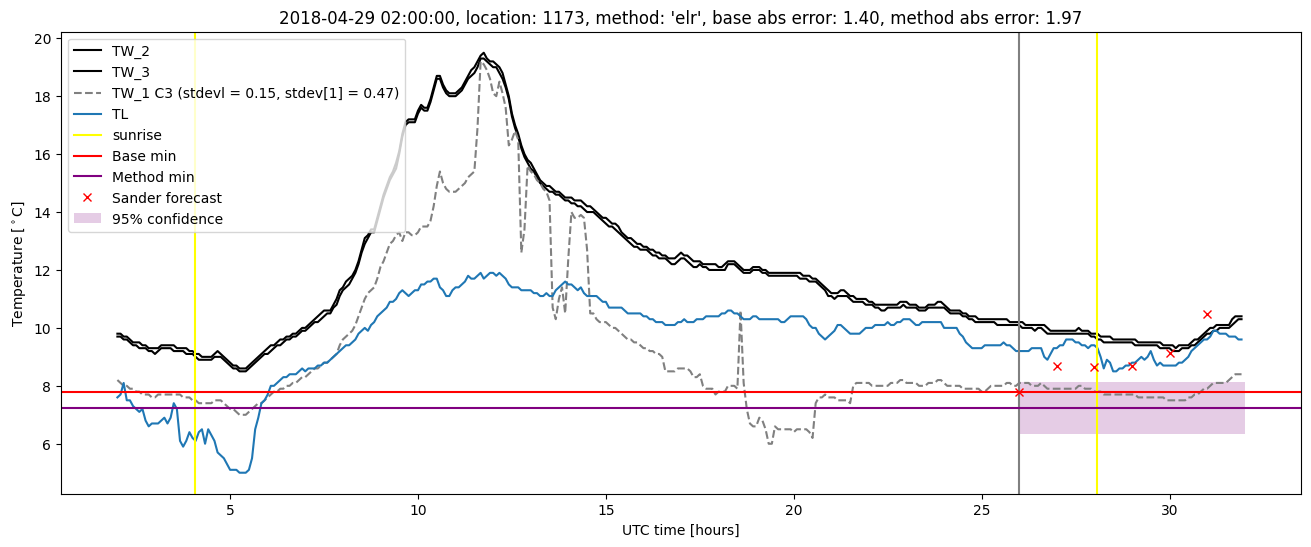
Extended logistic regression plots