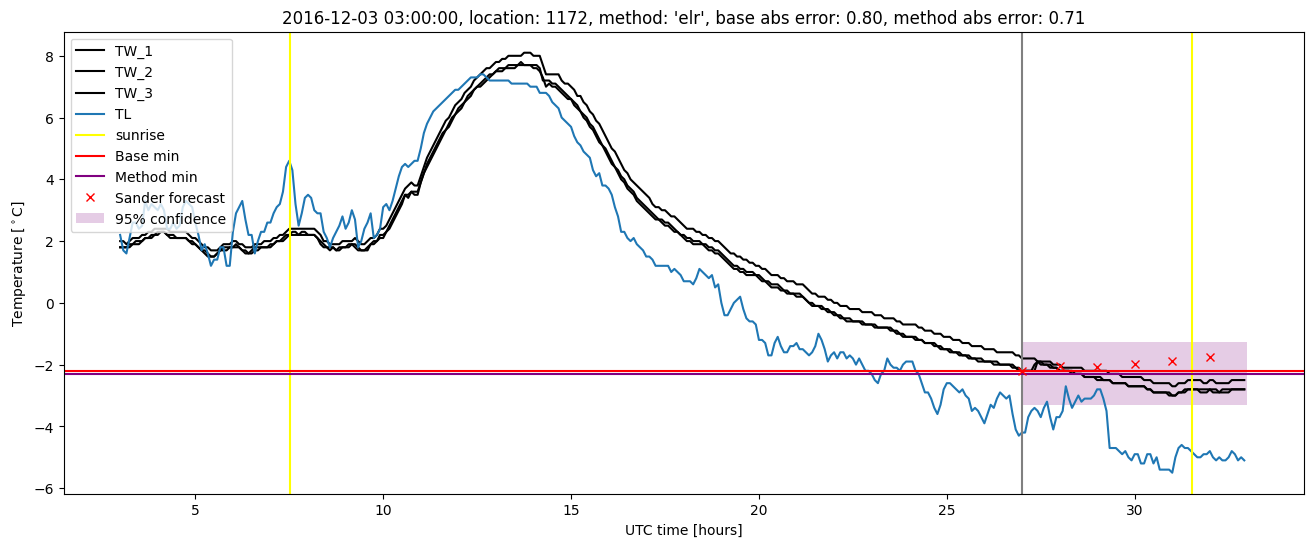
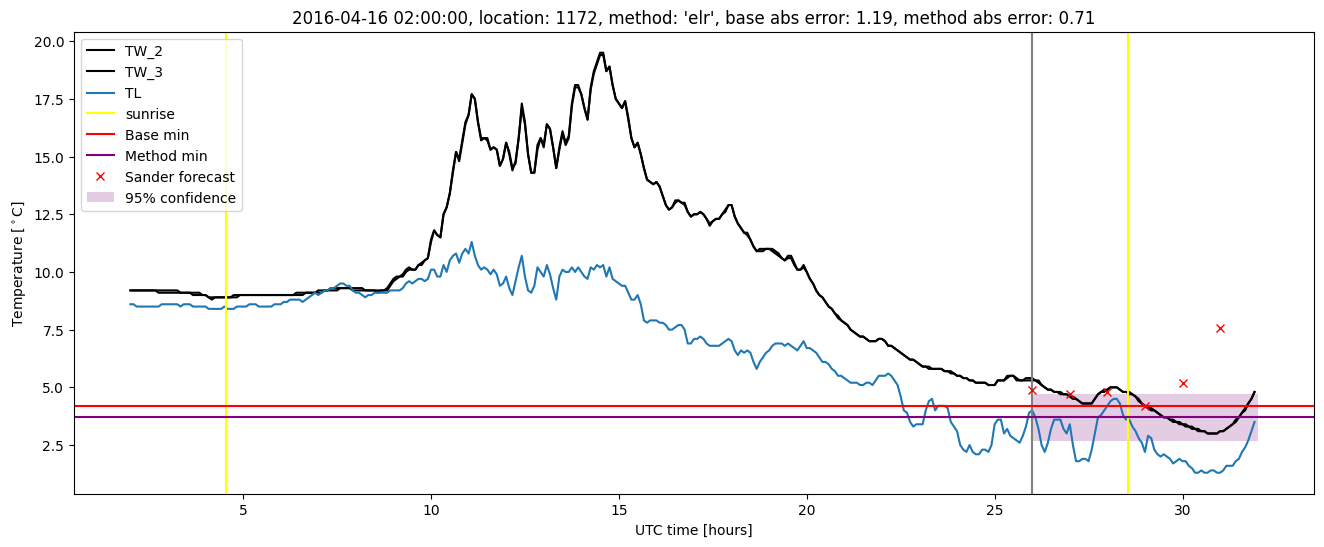
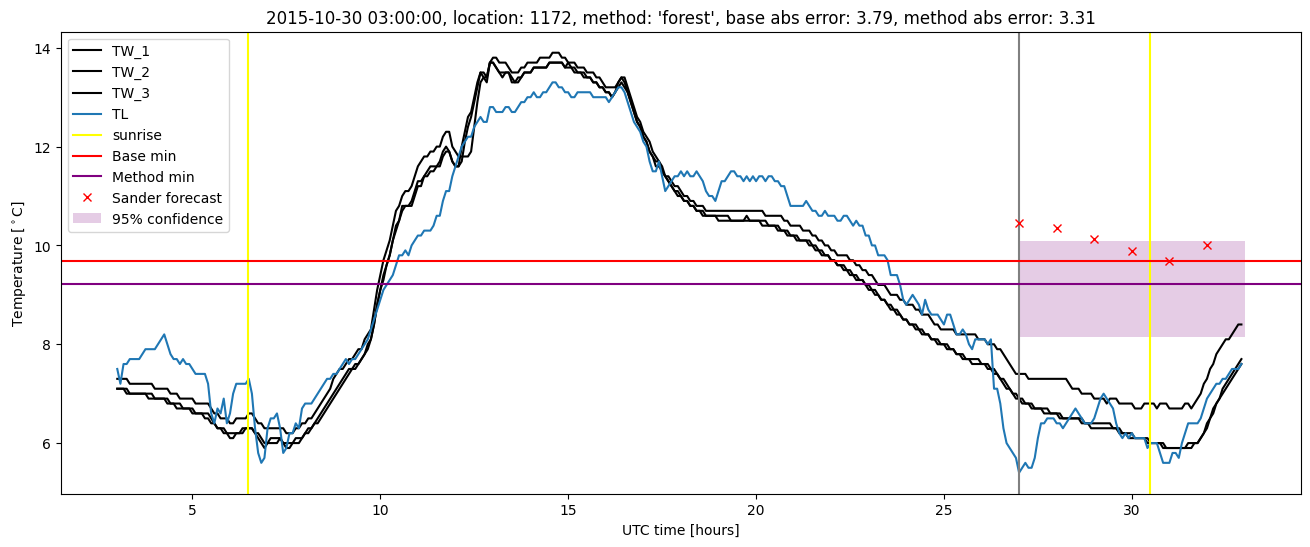
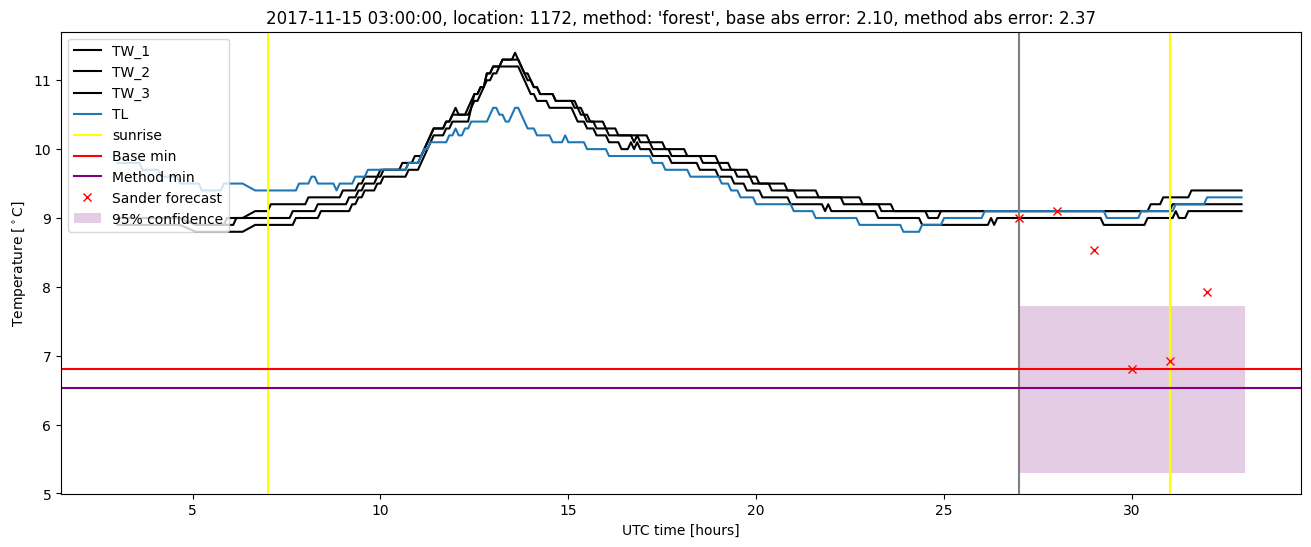
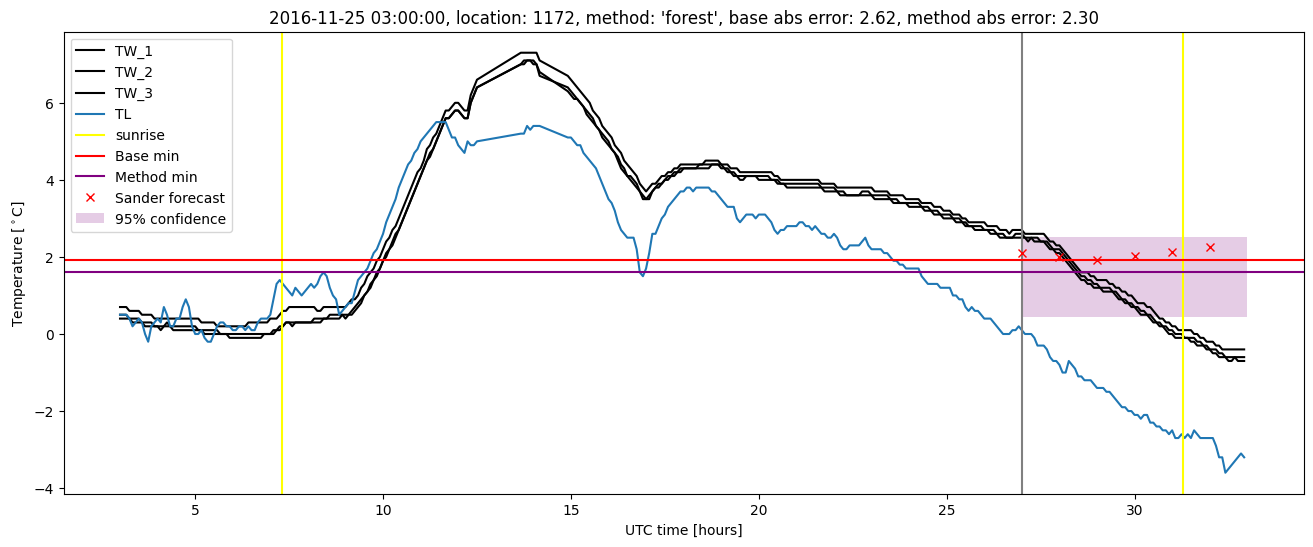
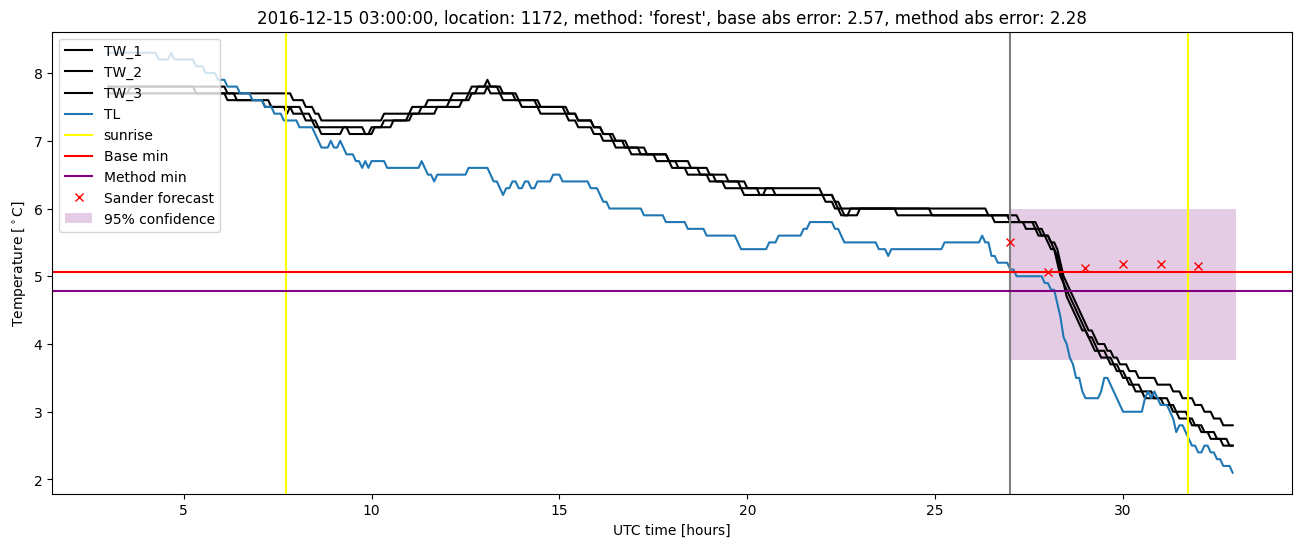
GMS location: 1172
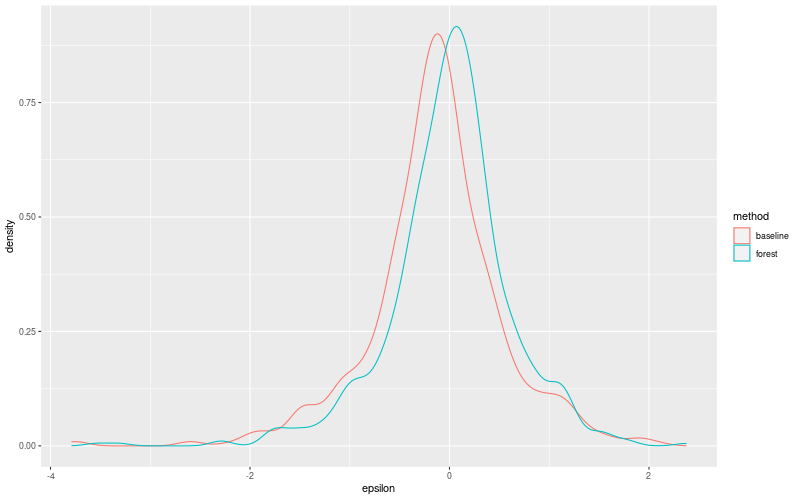
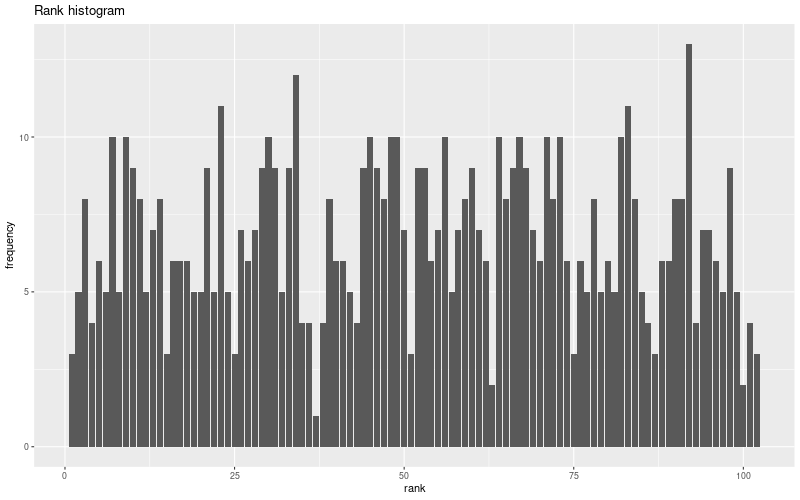
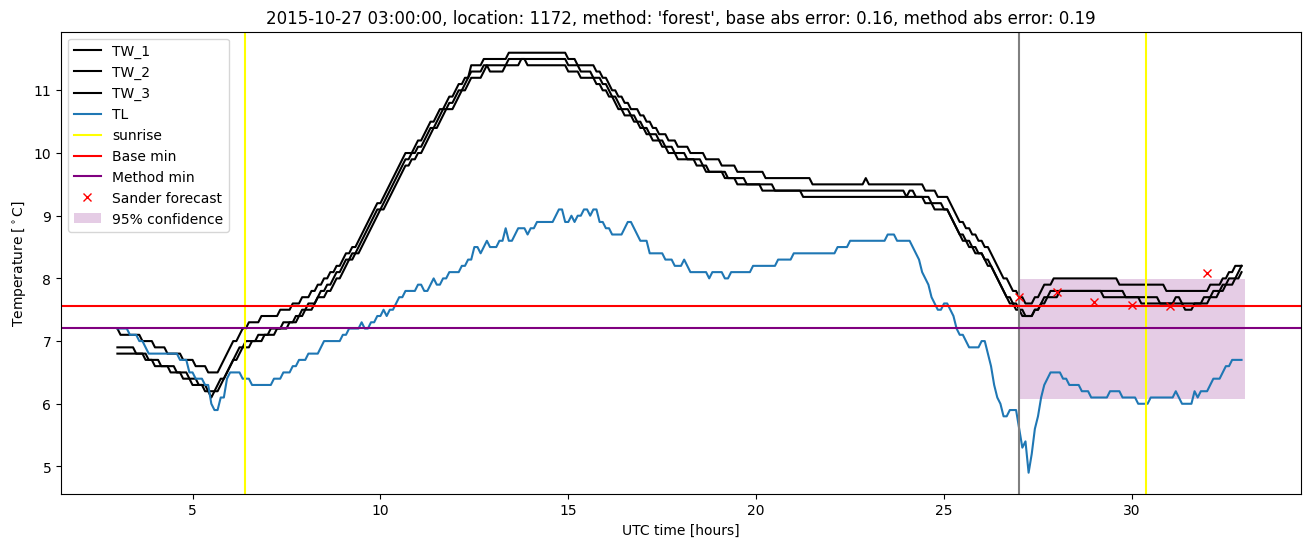
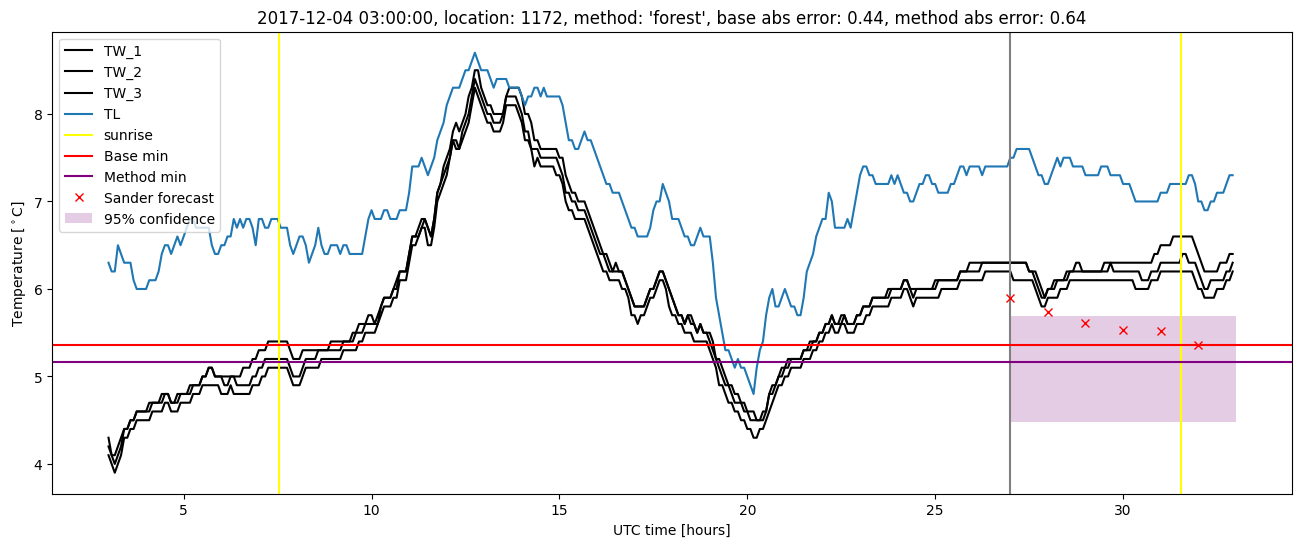
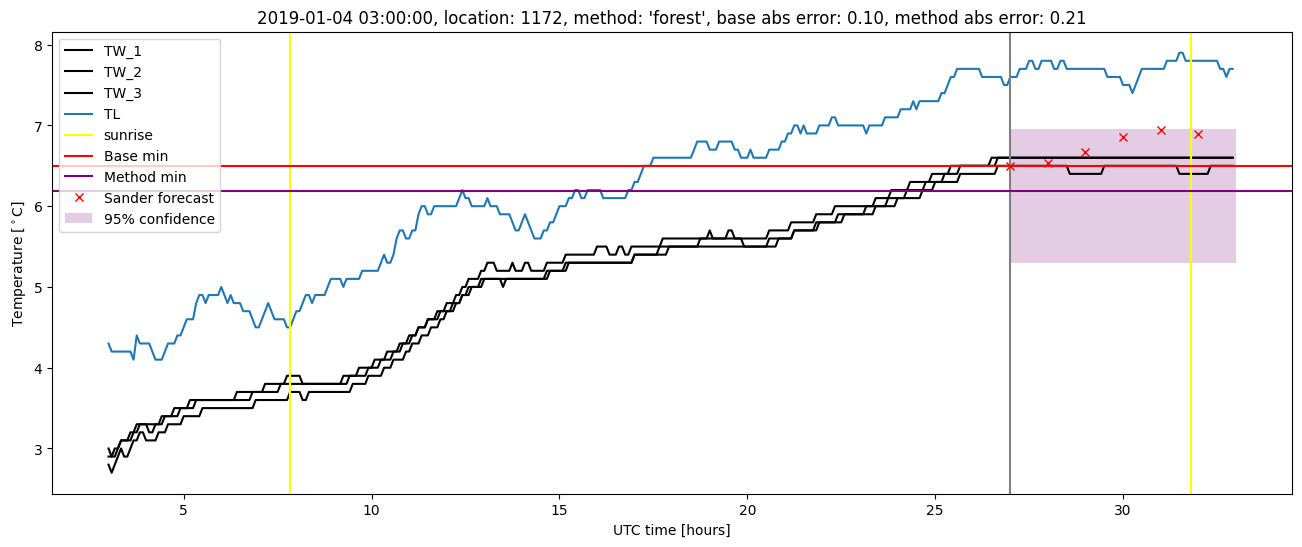
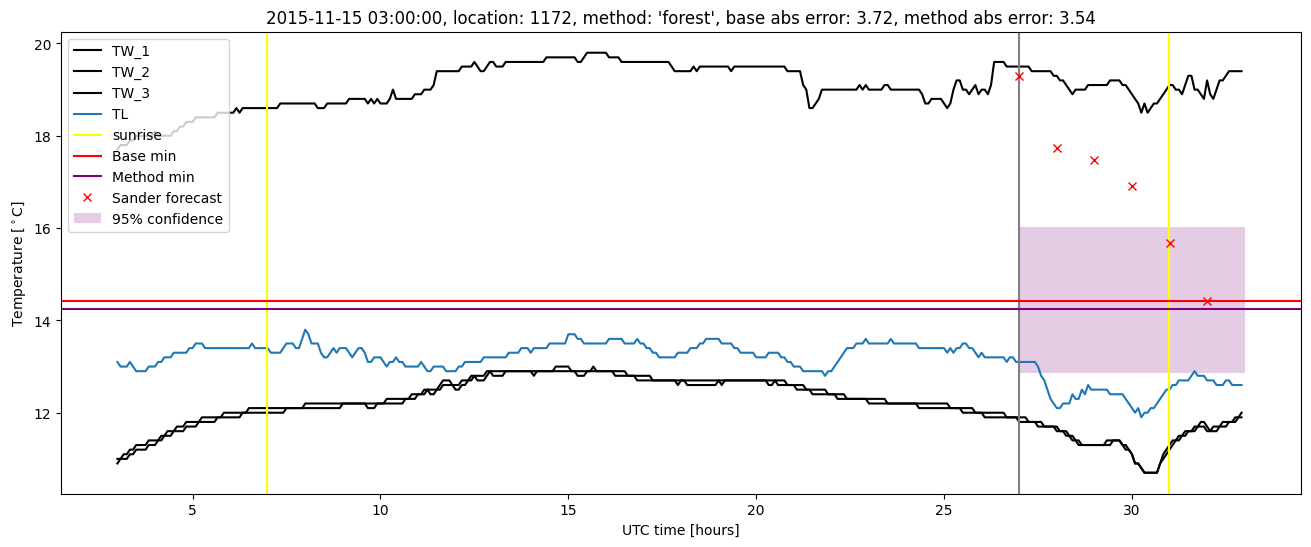
Random forest results
| names |
period |
power |
significance |
meanSquareError |
absError |
maxError |
CRPS |
IGN |
| baseline |
winter 2016 |
0.994 |
0.091 |
0.509 |
0.478 |
3.786 |
NaN |
NaN |
| forest |
winter 2016 |
0.989 |
0.030 |
0.420 |
0.441 |
3.540 |
0.536 |
2.454 |
| baseline |
winter 2017 |
0.983 |
0.083 |
0.551 |
0.529 |
2.623 |
NaN |
NaN |
| forest |
winter 2017 |
0.991 |
0.056 |
0.421 |
0.463 |
2.299 |
0.544 |
2.806 |
| baseline |
winter 2018 |
0.993 |
0.114 |
0.390 |
0.460 |
2.097 |
NaN |
NaN |
| forest |
winter 2018 |
0.970 |
0.068 |
0.372 |
0.449 |
2.373 |
0.556 |
2.202 |
| baseline |
winter 2019 |
0.993 |
0.167 |
0.422 |
0.477 |
1.943 |
NaN |
NaN |
| forest |
winter 2019 |
1.000 |
0.167 |
0.298 |
0.401 |
1.787 |
0.535 |
2.384 |
| baseline |
all |
0.991 |
0.104 |
0.468 |
0.484 |
3.786 |
NaN |
NaN |
| forest |
all |
0.988 |
0.064 |
0.381 |
0.439 |
3.540 |
0.543 |
2.451 |
Random forest plots
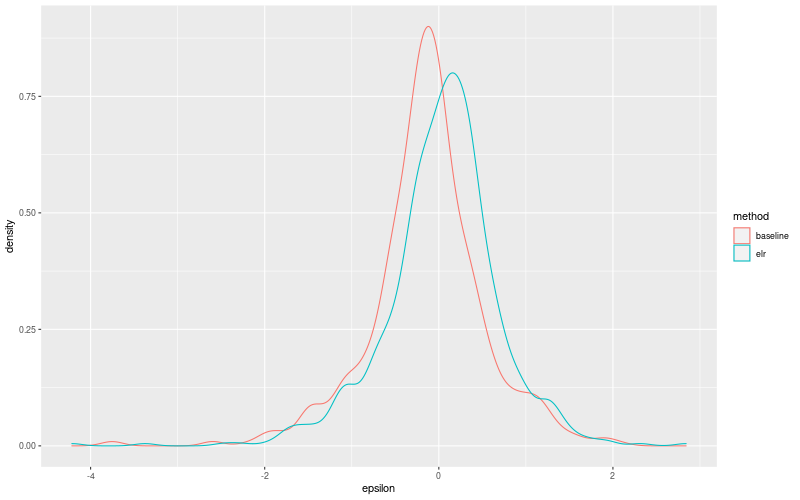
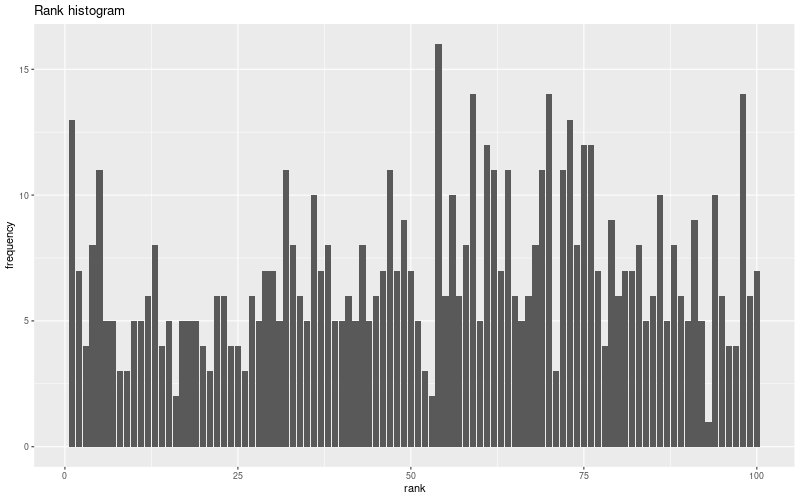
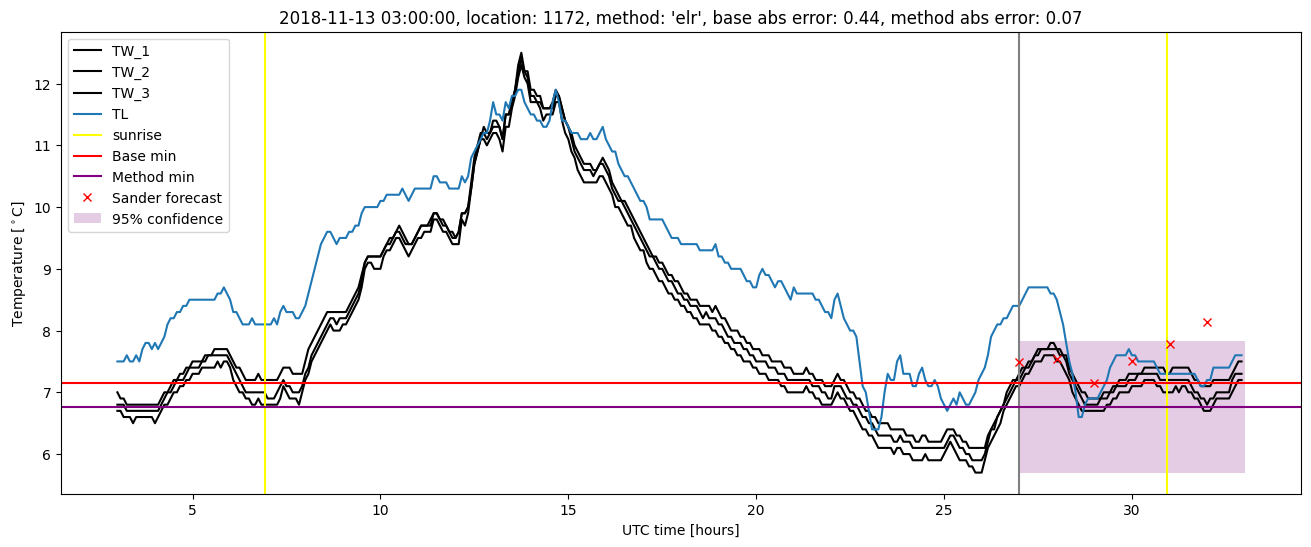
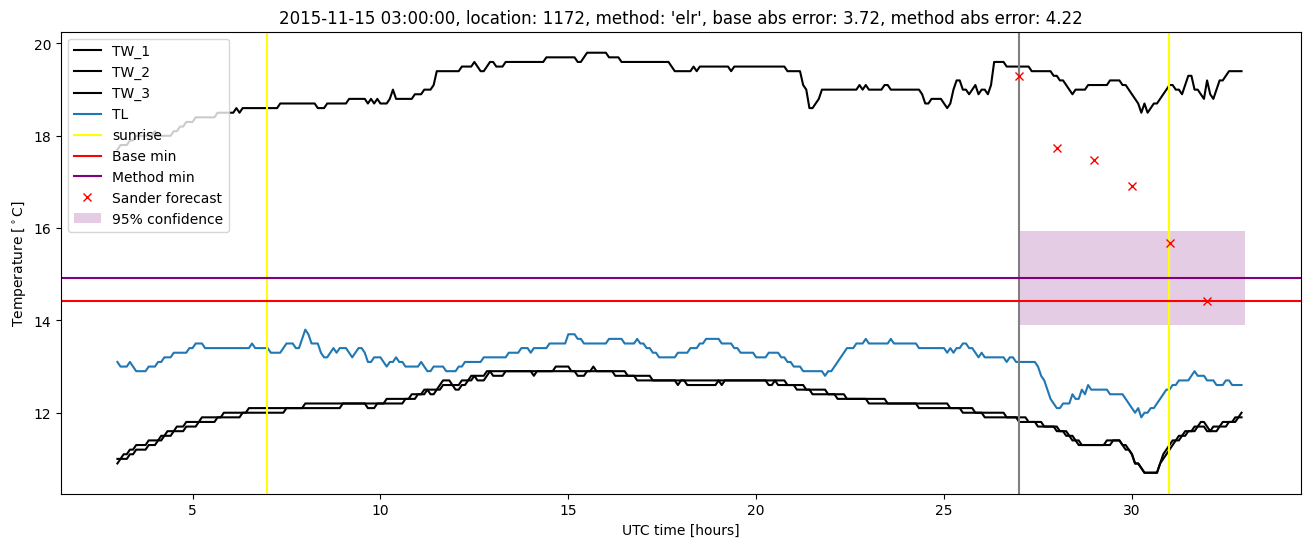
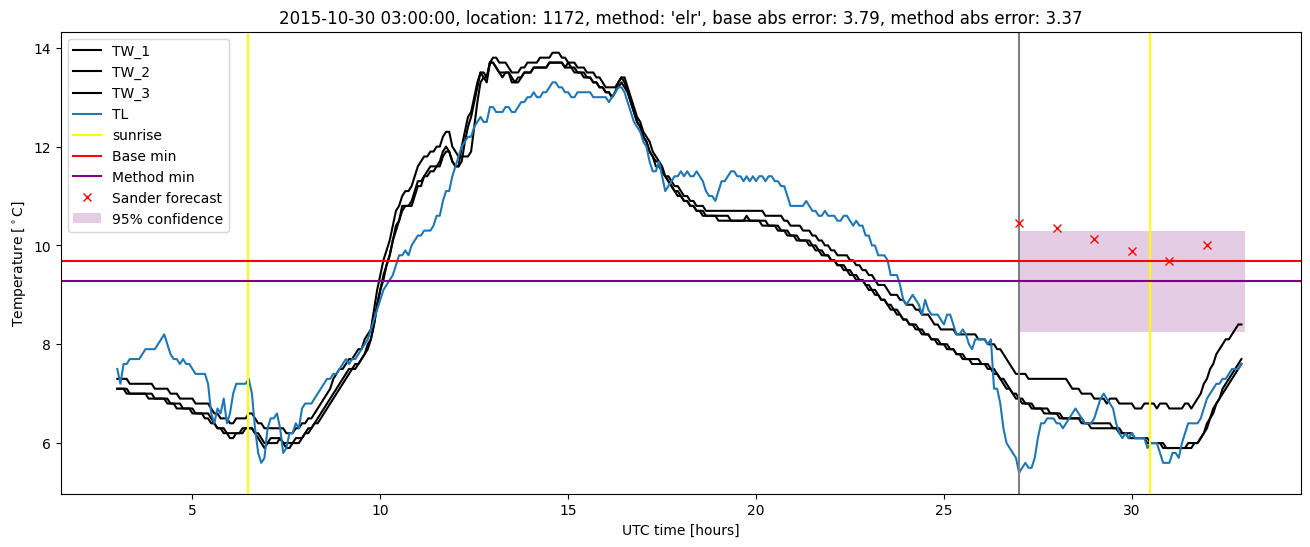
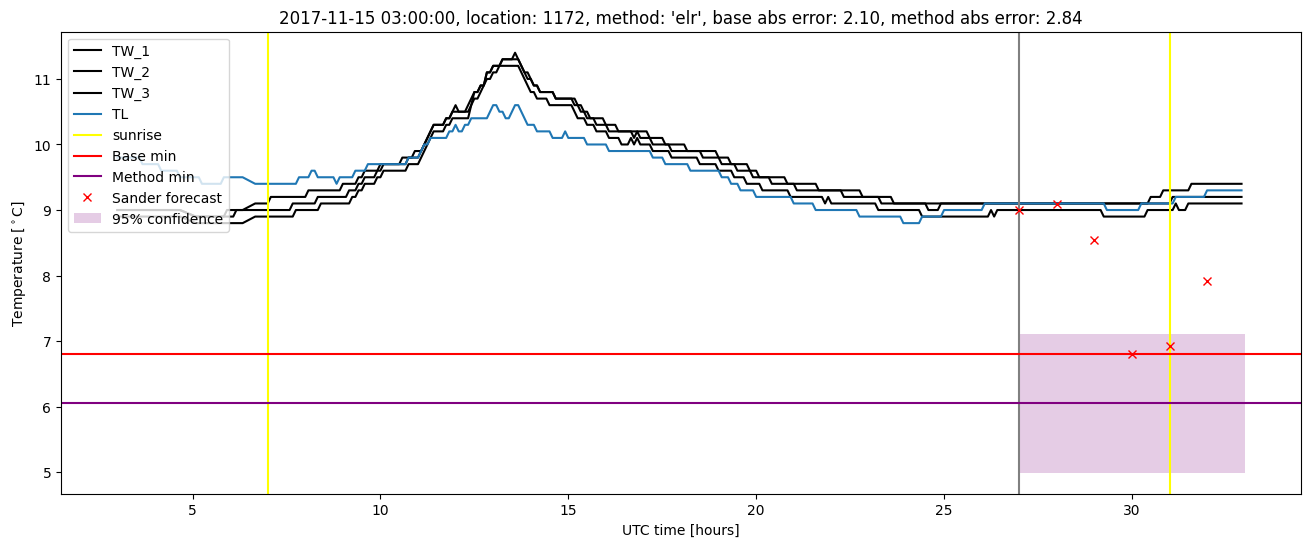
Extended logistic regression results
| names |
period |
power |
significance |
meanSquareError |
absError |
maxError |
CRPS |
IGN |
| baseline |
winter 2016 |
0.994 |
0.091 |
0.509 |
0.478 |
3.786 |
NaN |
NaN |
| elr |
winter 2016 |
0.989 |
0.030 |
0.481 |
0.487 |
4.215 |
0.607 |
3.216 |
| baseline |
winter 2017 |
0.983 |
0.083 |
0.551 |
0.529 |
2.623 |
NaN |
NaN |
| elr |
winter 2017 |
0.983 |
0.056 |
0.501 |
0.510 |
2.471 |
0.571 |
2.888 |
| baseline |
winter 2018 |
0.993 |
0.114 |
0.390 |
0.460 |
2.097 |
NaN |
NaN |
| elr |
winter 2018 |
0.985 |
0.068 |
0.444 |
0.489 |
2.841 |
0.612 |
2.942 |
| baseline |
winter 2019 |
0.993 |
0.167 |
0.422 |
0.477 |
1.943 |
NaN |
NaN |
| elr |
winter 2019 |
1.000 |
0.167 |
0.335 |
0.434 |
1.787 |
0.593 |
2.733 |
| baseline |
all |
0.991 |
0.104 |
0.468 |
0.484 |
3.786 |
NaN |
NaN |
| elr |
all |
0.989 |
0.064 |
0.444 |
0.481 |
4.215 |
0.597 |
2.967 |
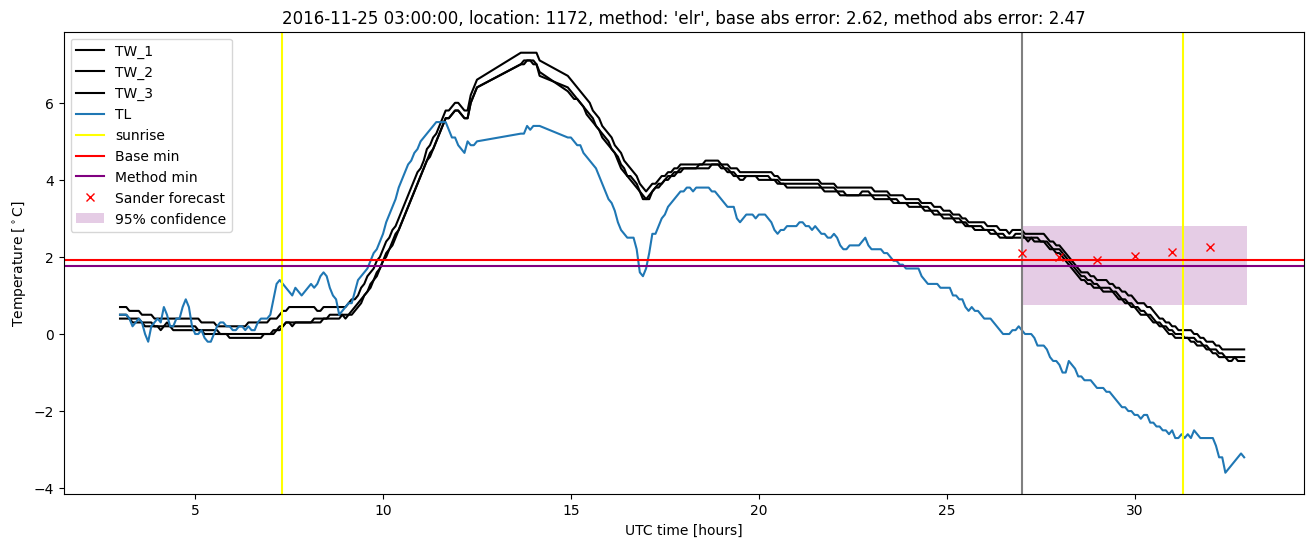
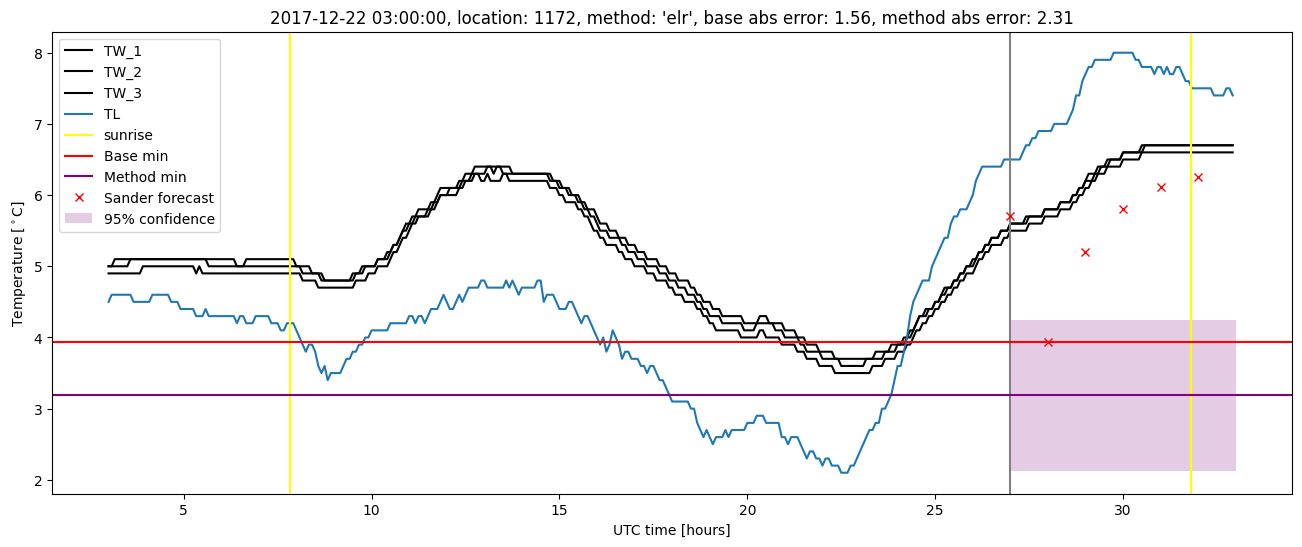
Extended logistic regression plots