GMS location: 1171
Random forest results
| names |
period |
power |
significance |
meanSquareError |
absError |
maxError |
CRPS |
IGN |
| baseline |
winter 2016 |
1.000 |
0.097 |
0.409 |
0.468 |
2.104 |
NaN |
NaN |
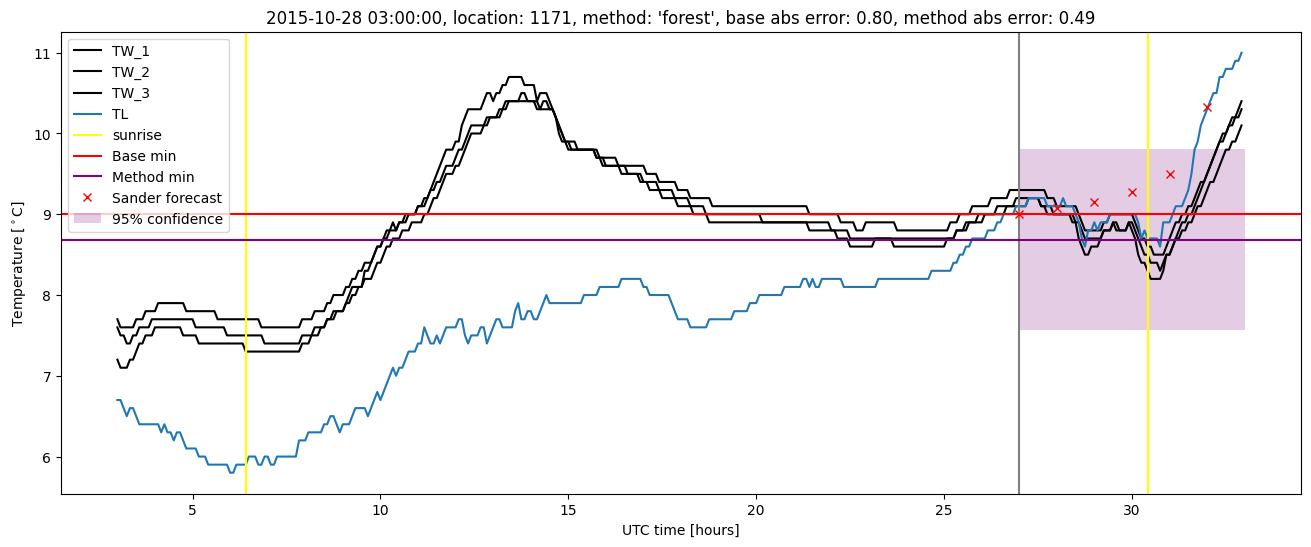
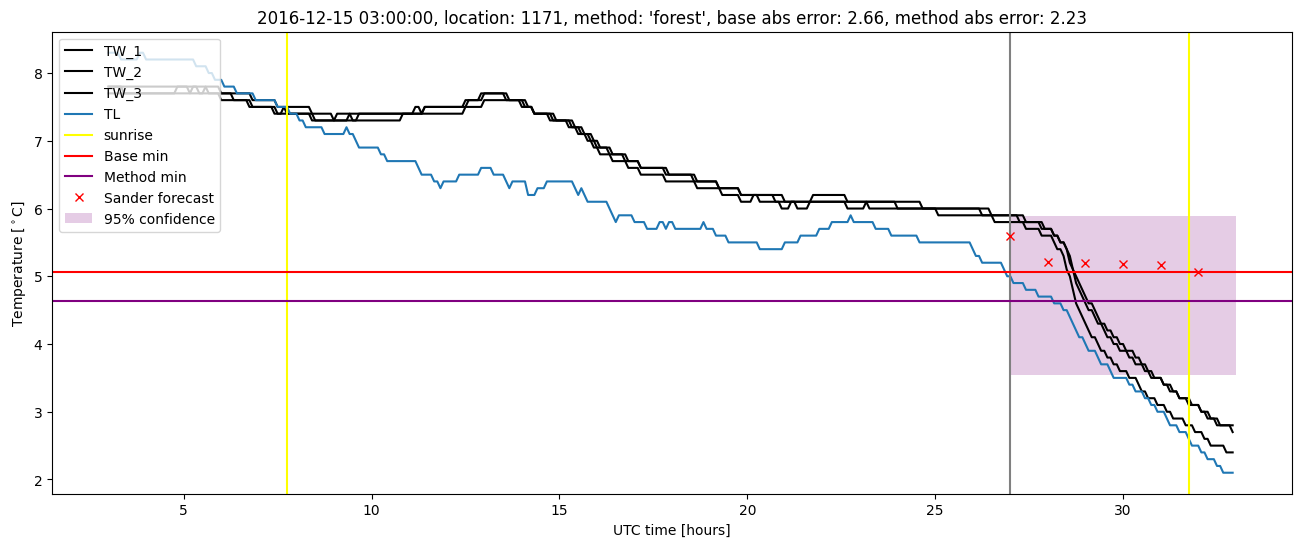
| forest |
winter 2016 |
0.994 |
0.097 |
0.299 |
0.405 |
1.825 |
0.561 |
2.599 |
| baseline |
winter 2017 |
0.983 |
0.057 |
0.524 |
0.535 |
2.664 |
NaN |
NaN |
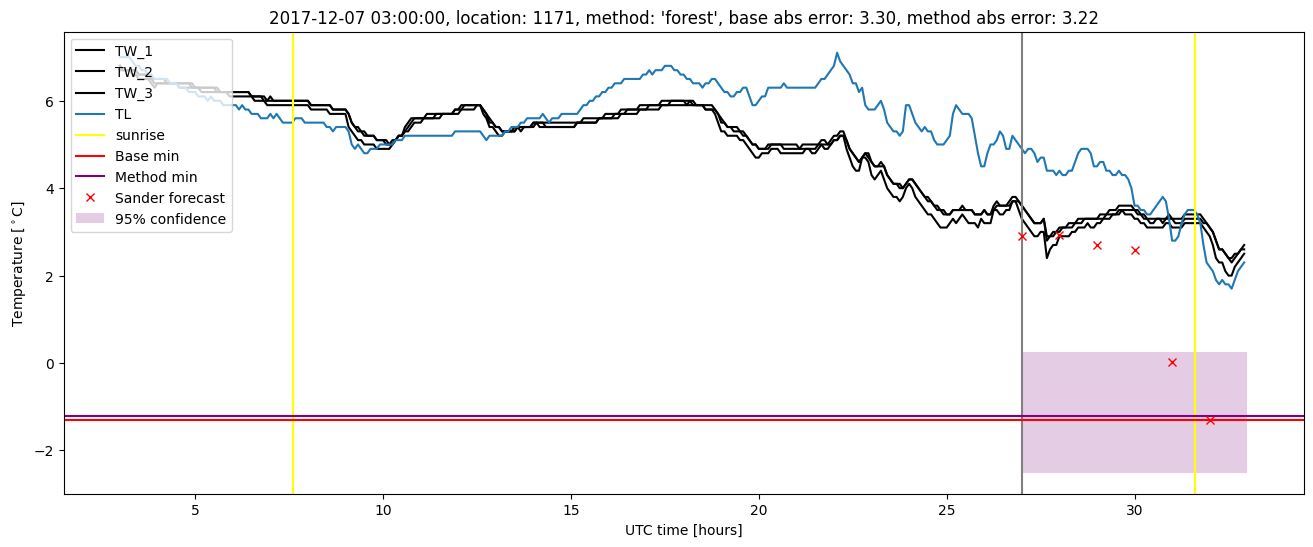
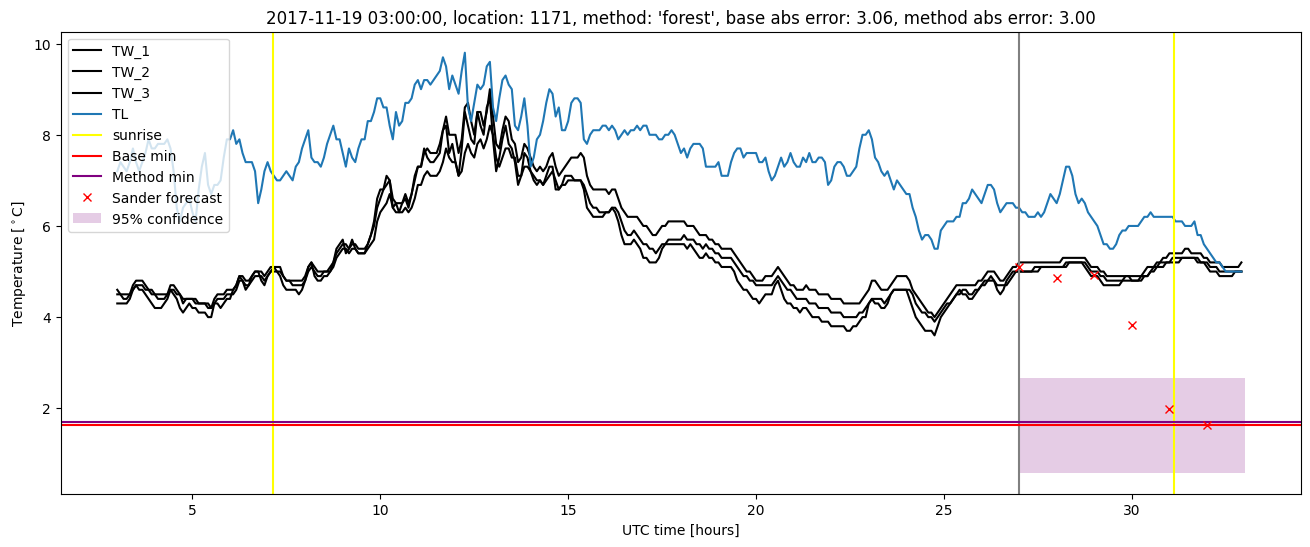
| forest |
winter 2017 |
0.983 |
0.029 |
0.398 |
0.456 |
2.233 |
0.567 |
3.057 |
| baseline |
winter 2018 |
0.985 |
0.214 |
0.472 |
0.482 |
3.303 |
NaN |
NaN |
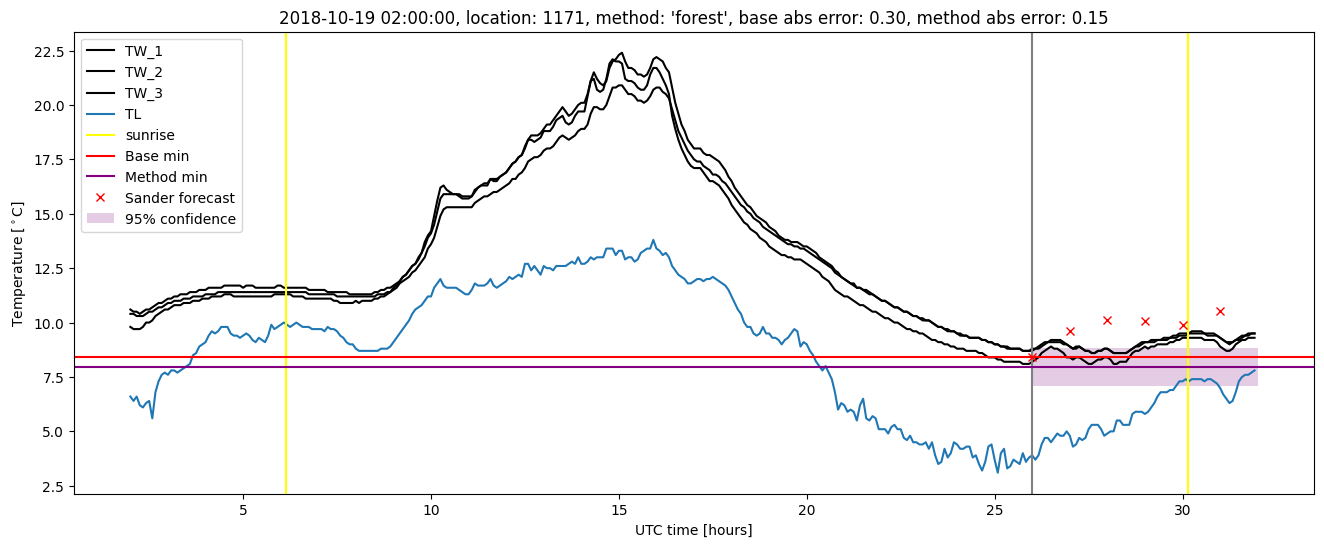
| forest |
winter 2018 |
0.985 |
0.143 |
0.411 |
0.439 |
3.221 |
0.589 |
2.819 |
| baseline |
winter 2019 |
0.986 |
0.077 |
0.441 |
0.502 |
2.130 |
NaN |
NaN |
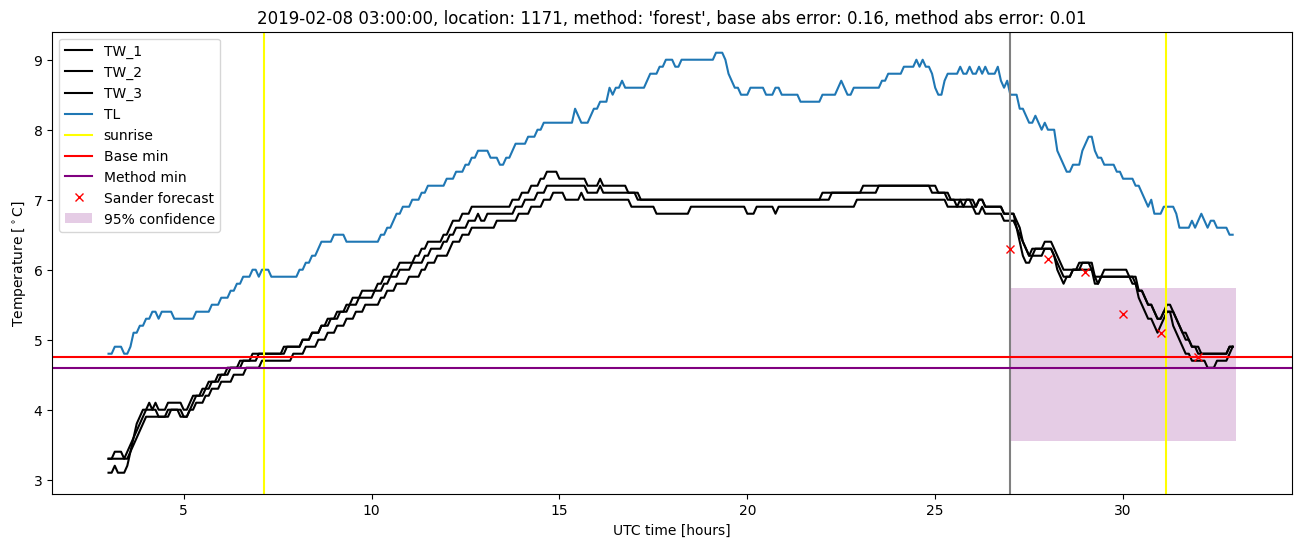
| forest |
winter 2019 |
0.986 |
0.000e+00 |
0.300 |
0.412 |
1.754 |
0.600 |
3.090 |
| baseline |
all |
0.990 |
0.124 |
0.458 |
0.494 |
3.303 |
NaN |
NaN |
| forest |
all |
0.988 |
0.083 |
0.350 |
0.426 |
3.221 |
0.579 |
2.869 |
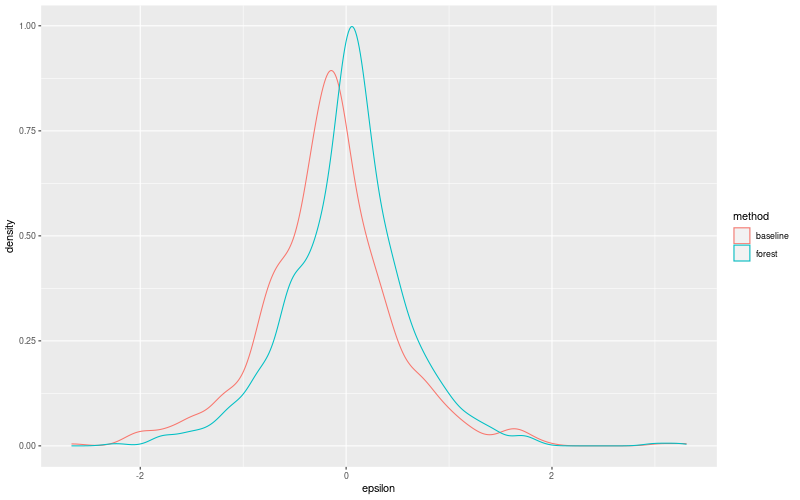
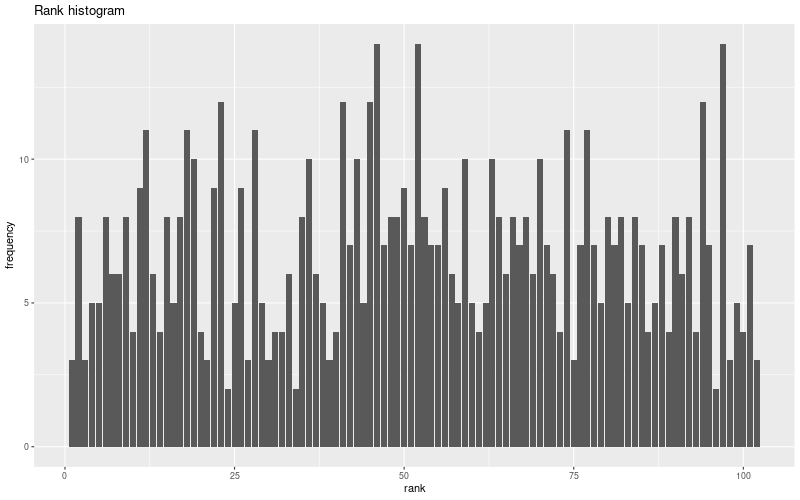
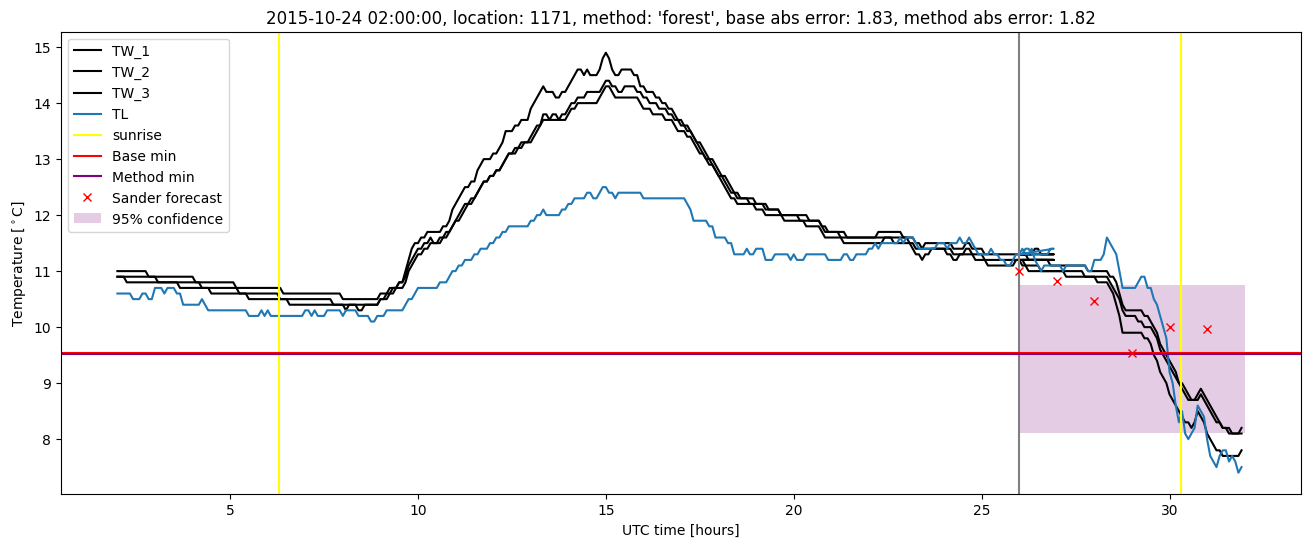
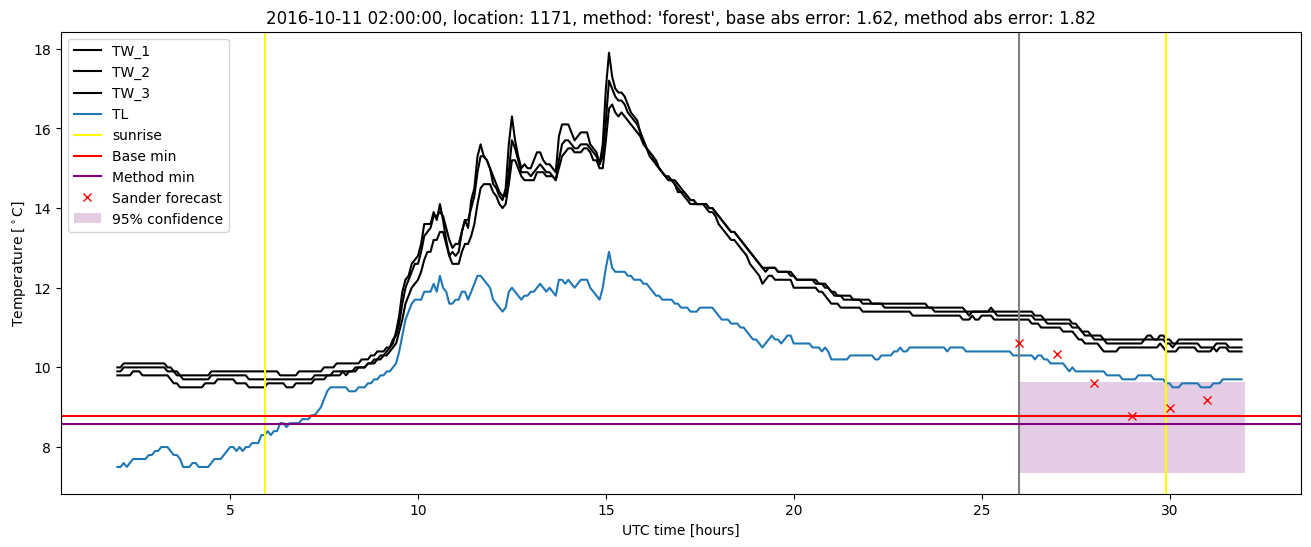
Random forest plots
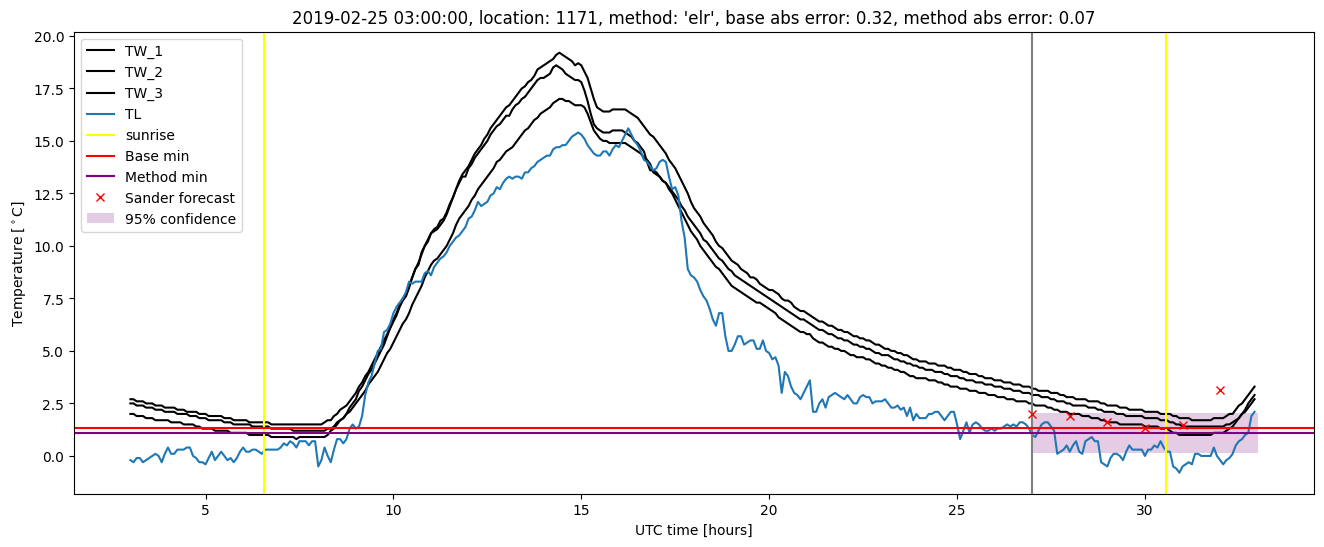
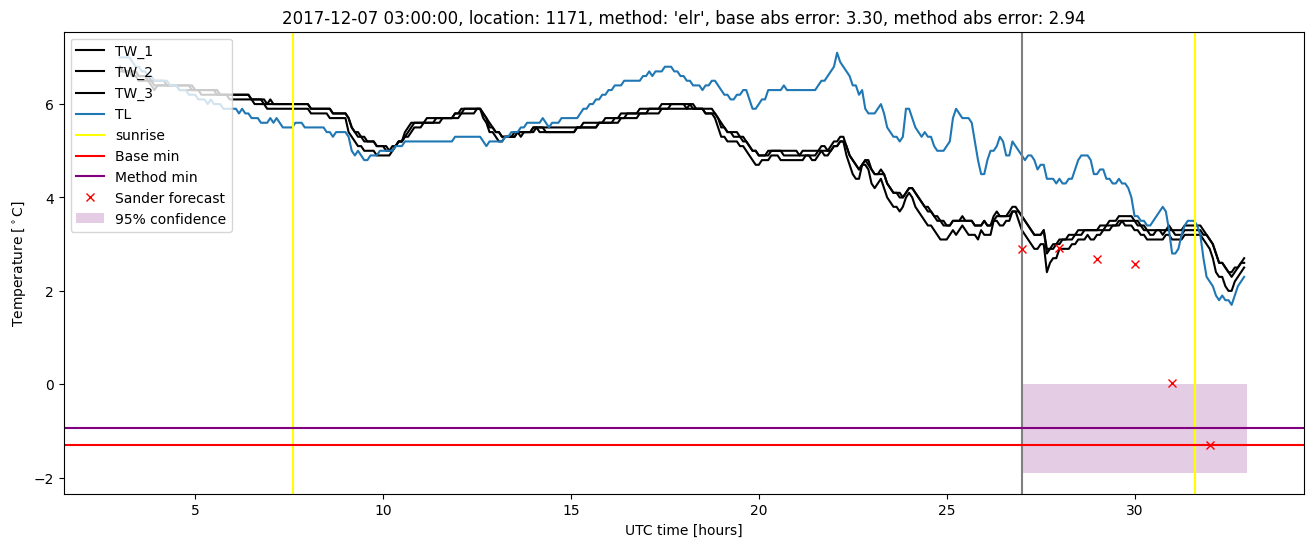
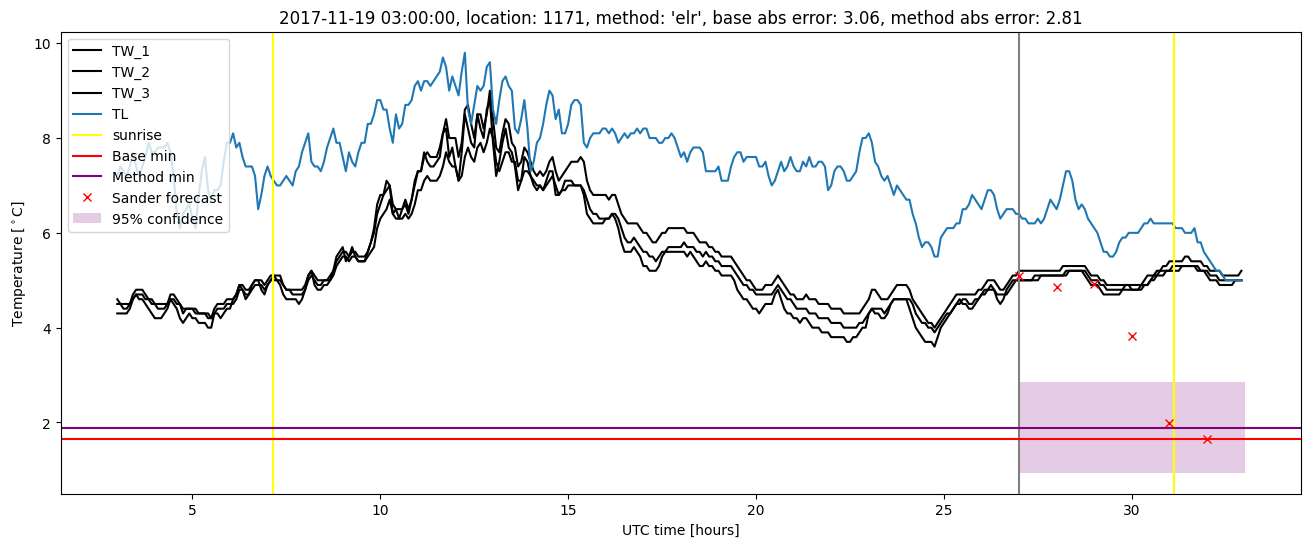
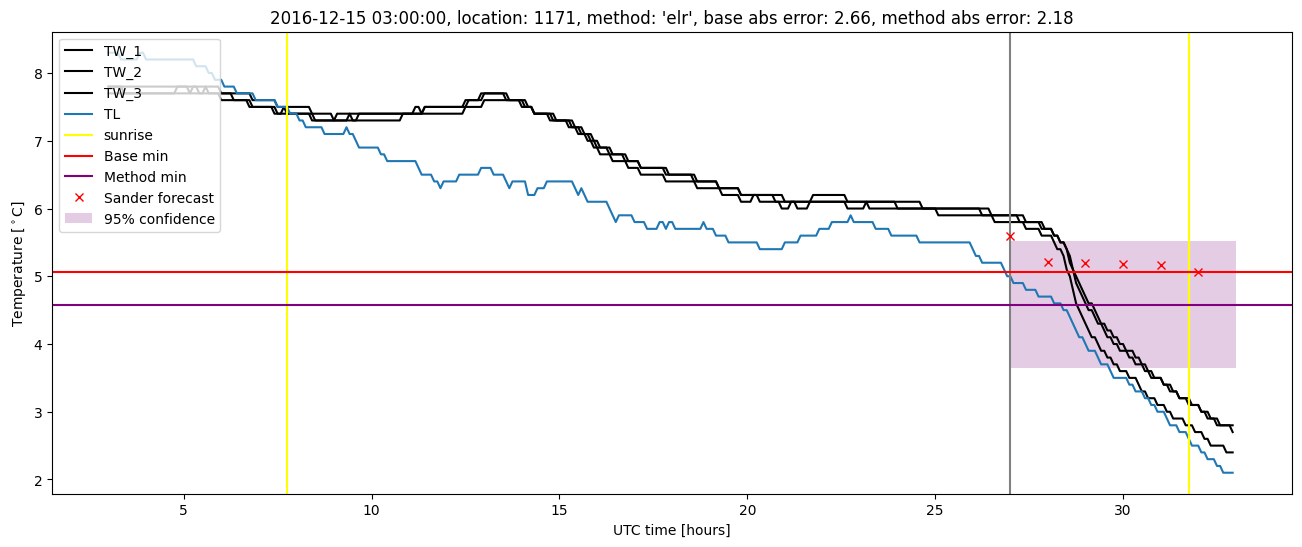
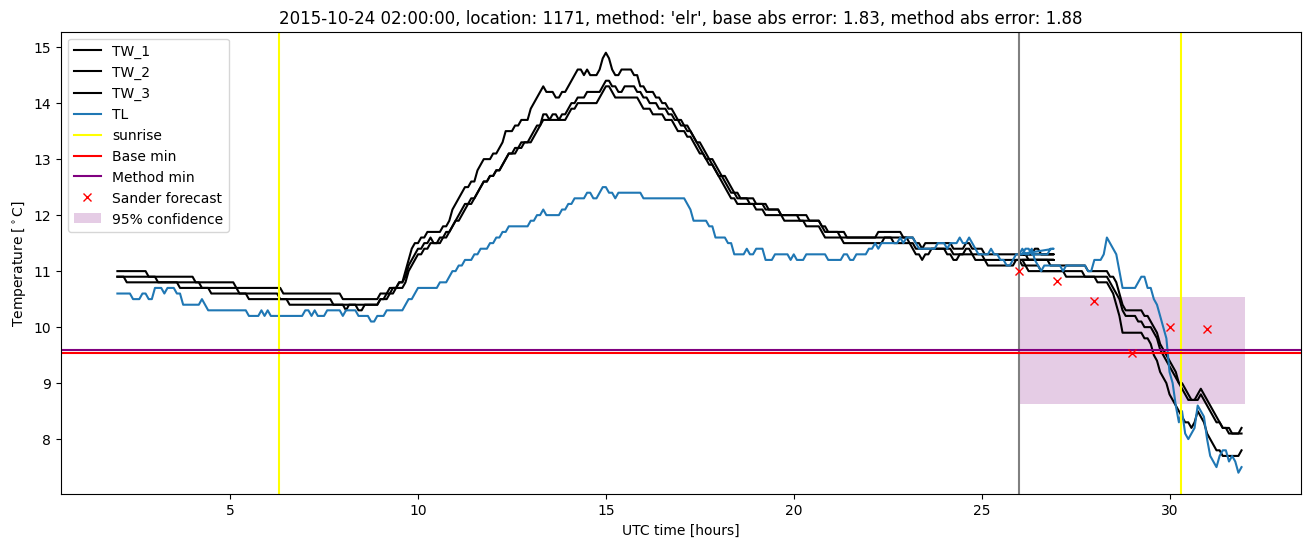
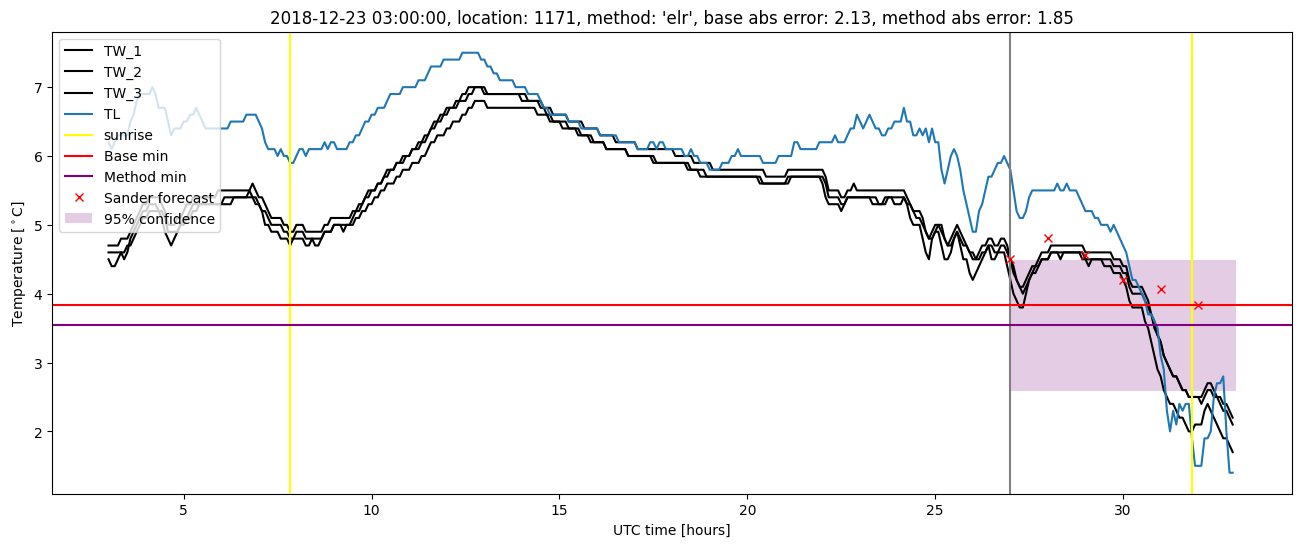
Extended logistic regression results
| names |
period |
power |
significance |
meanSquareError |
absError |
maxError |
CRPS |
IGN |
| baseline |
winter 2016 |
1.000 |
0.097 |
0.409 |
0.468 |
2.104 |
NaN |
NaN |
| elr |
winter 2016 |
0.983 |
0.032 |
0.348 |
0.469 |
1.884 |
0.660 |
4.550 |
| baseline |
winter 2017 |
0.983 |
0.057 |
0.524 |
0.535 |
2.664 |
NaN |
NaN |
| elr |
winter 2017 |
0.975 |
0.029 |
0.473 |
0.541 |
2.183 |
0.678 |
5.060 |
| baseline |
winter 2018 |
0.985 |
0.214 |
0.472 |
0.482 |
3.303 |
NaN |
NaN |
| elr |
winter 2018 |
0.985 |
0.238 |
0.420 |
0.474 |
2.944 |
0.654 |
4.521 |
| baseline |
winter 2019 |
0.986 |
0.077 |
0.441 |
0.502 |
2.130 |
NaN |
NaN |
| elr |
winter 2019 |
0.986 |
0.000e+00 |
0.343 |
0.455 |
1.847 |
0.639 |
4.367 |
| baseline |
all |
0.990 |
0.124 |
0.458 |
0.494 |
3.303 |
NaN |
NaN |
| elr |
all |
0.983 |
0.099 |
0.393 |
0.483 |
2.944 |
0.658 |
4.613 |
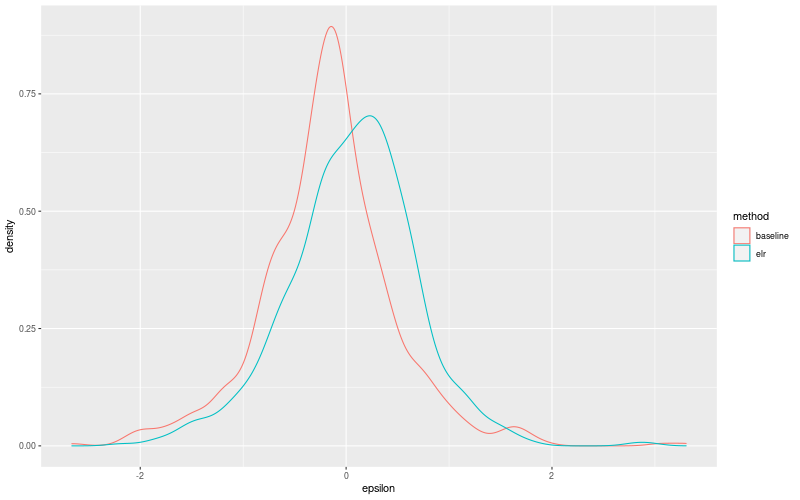
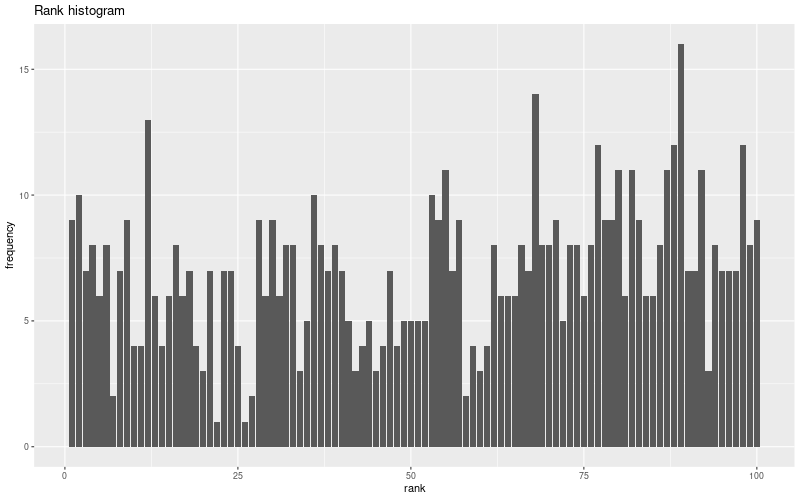
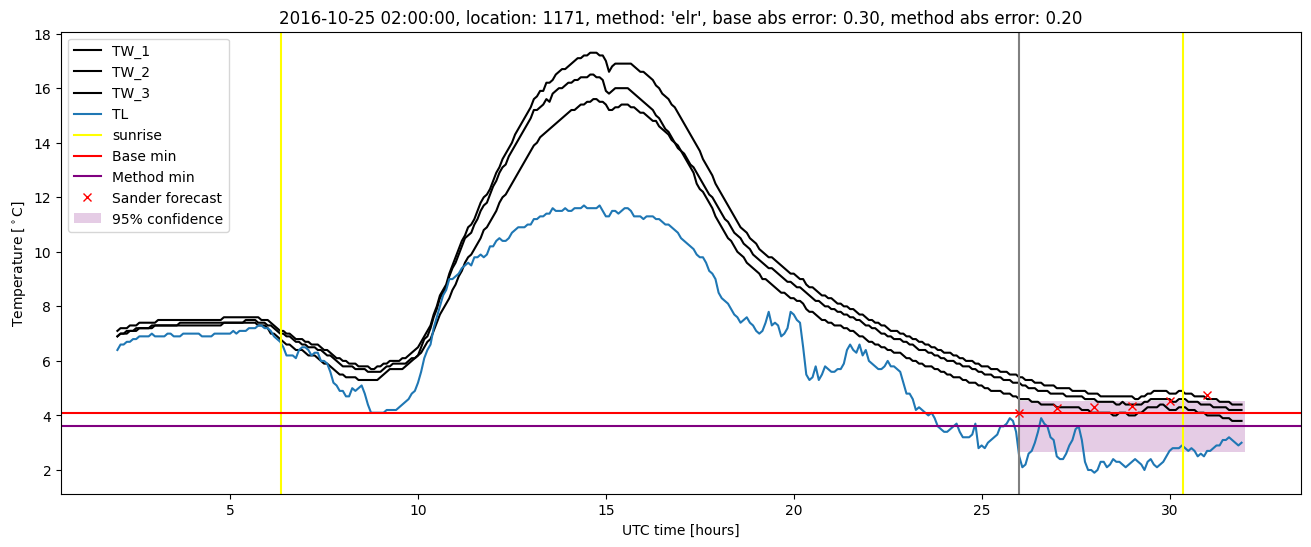
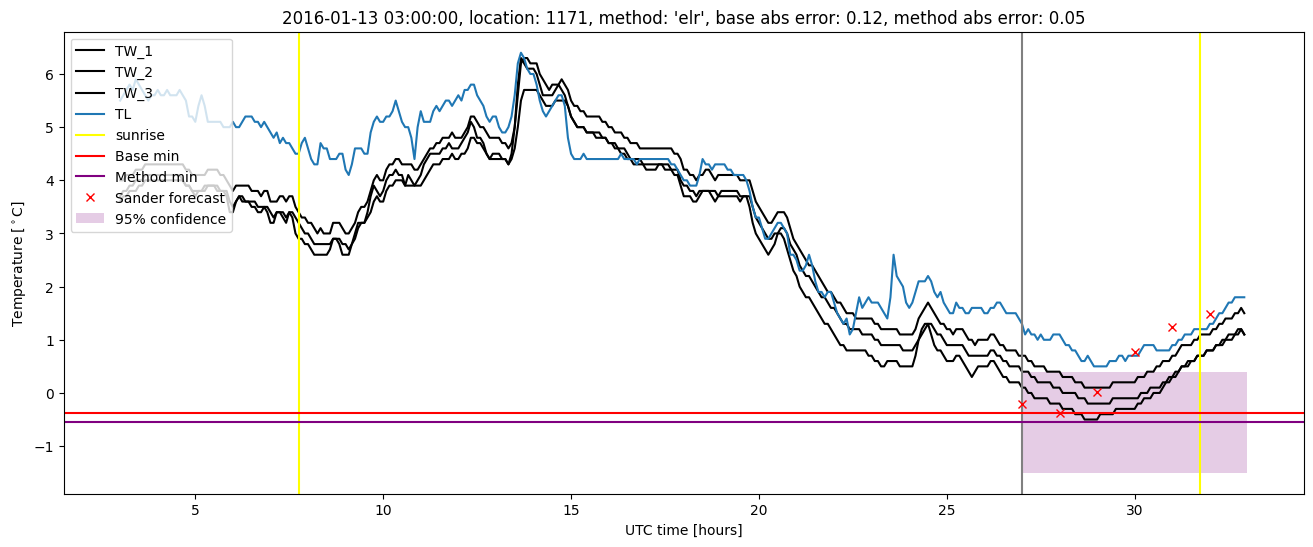
Extended logistic regression plots