GMS location: 1163
Random forest results
| names |
period |
power |
significance |
meanSquareError |
absError |
maxError |
CRPS |
IGN |
| baseline |
winter 2016 |
0.993 |
0.000e+00 |
0.378 |
0.435 |
2.439 |
NaN |
NaN |
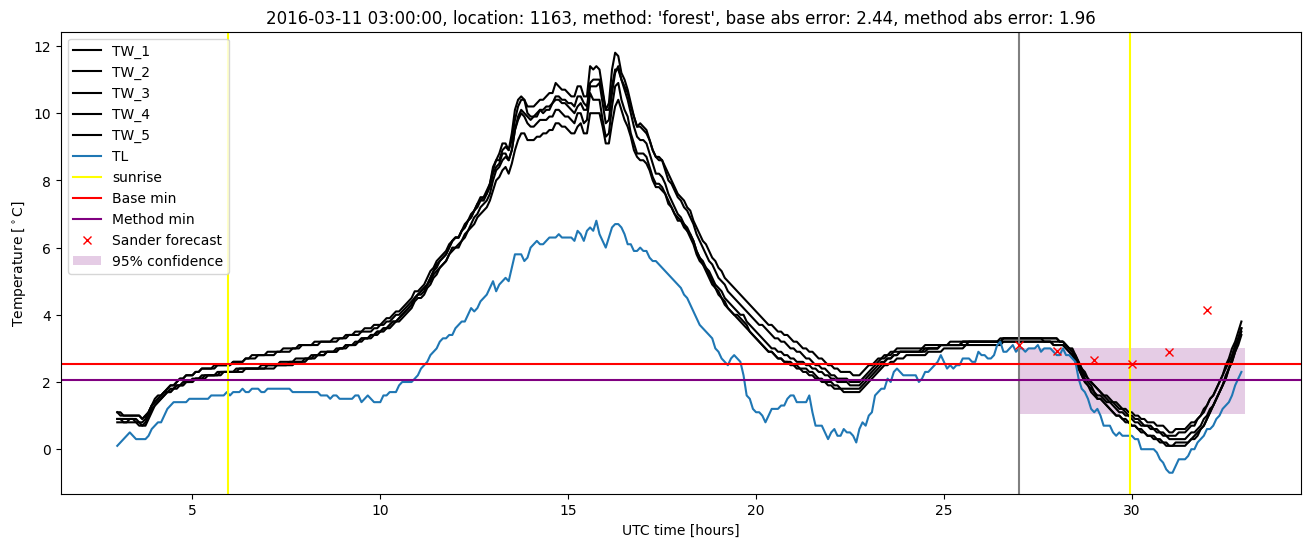
| forest |
winter 2016 |
0.967 |
0.000e+00 |
0.319 |
0.402 |
1.964 |
0.575 |
2.967 |
| baseline |
winter 2017 |
0.991 |
0.073 |
0.515 |
0.492 |
3.975 |
NaN |
NaN |
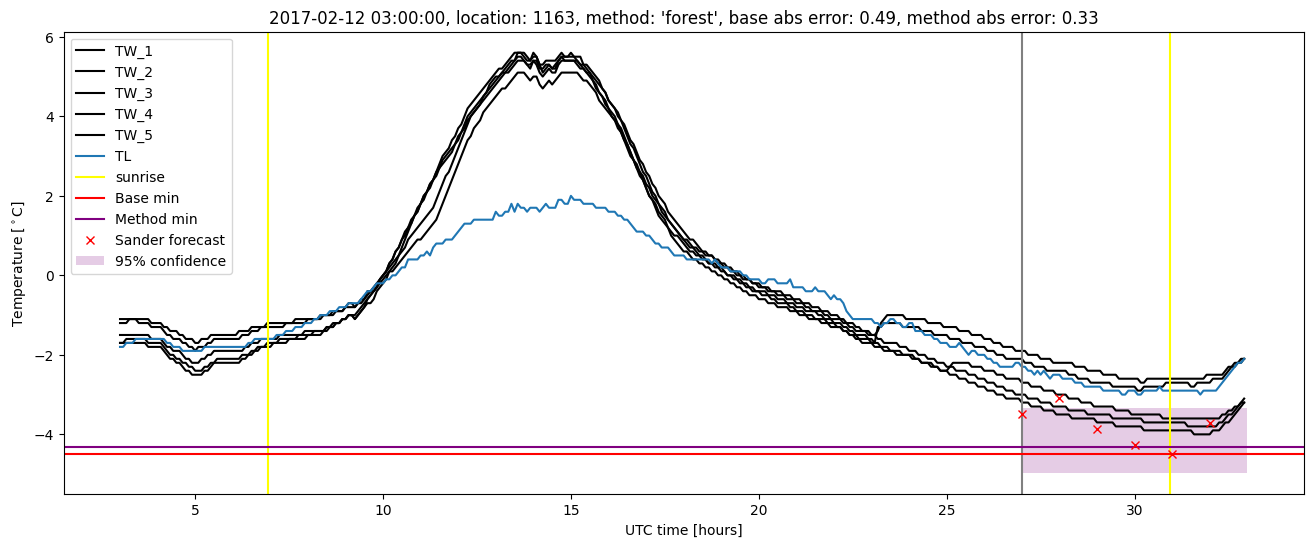
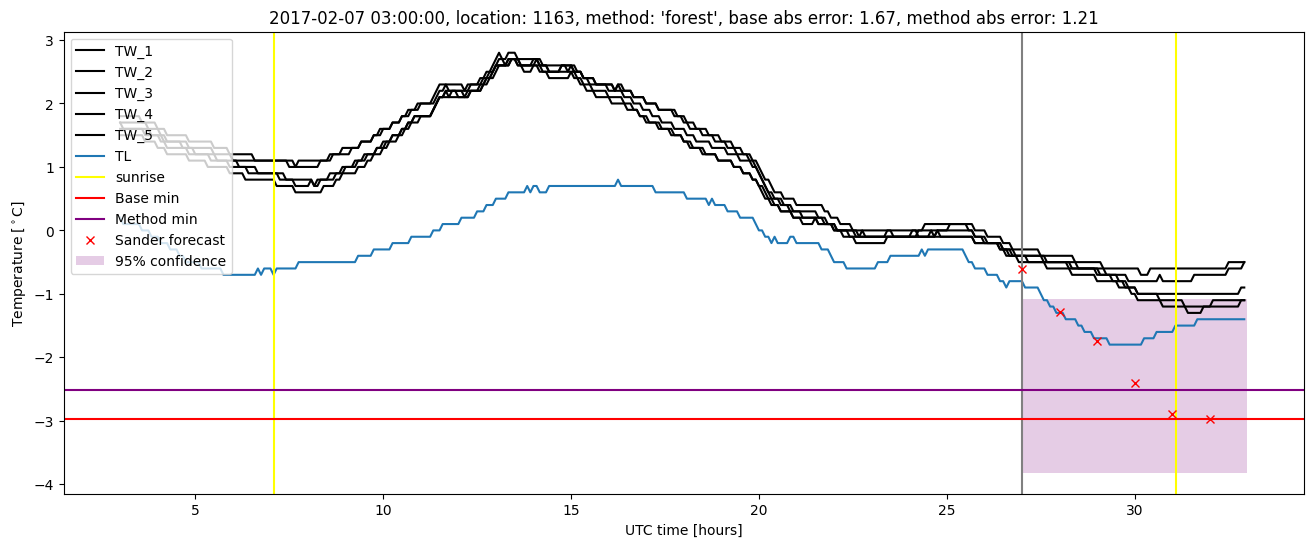
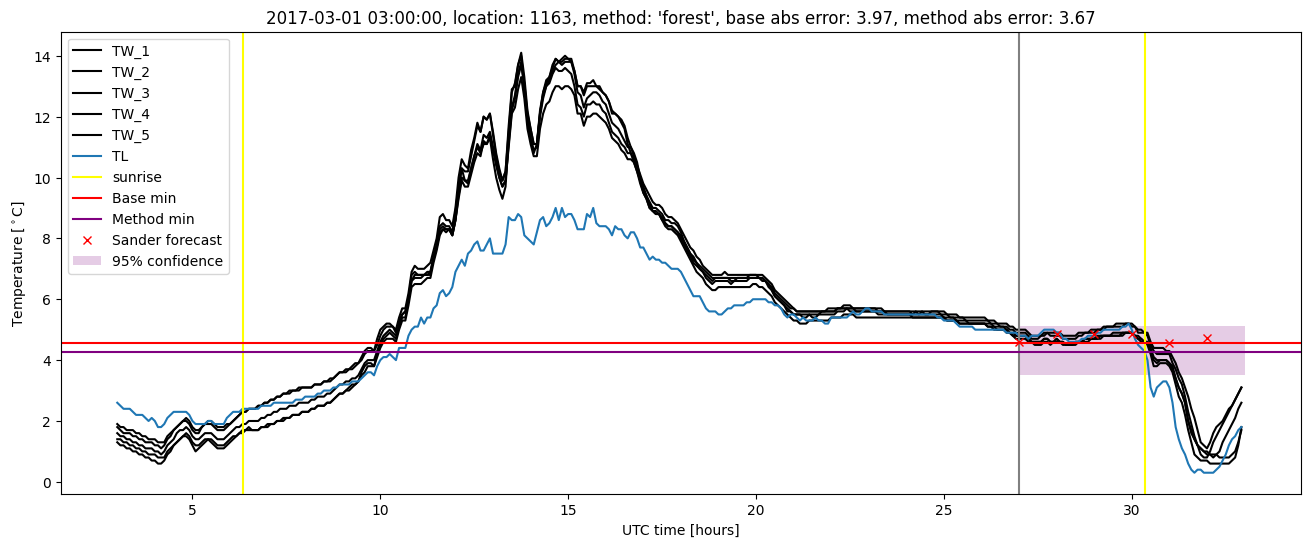
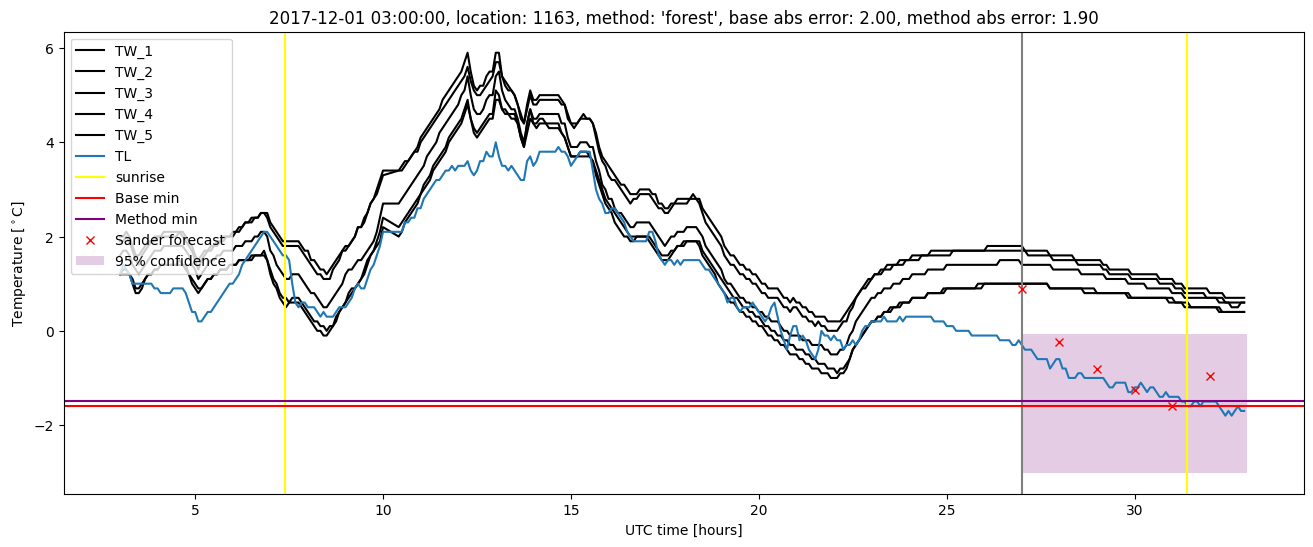
| forest |
winter 2017 |
0.973 |
0.024 |
0.434 |
0.454 |
3.669 |
0.572 |
3.324 |
| baseline |
winter 2018 |
0.972 |
0.171 |
0.418 |
0.451 |
2.001 |
NaN |
NaN |
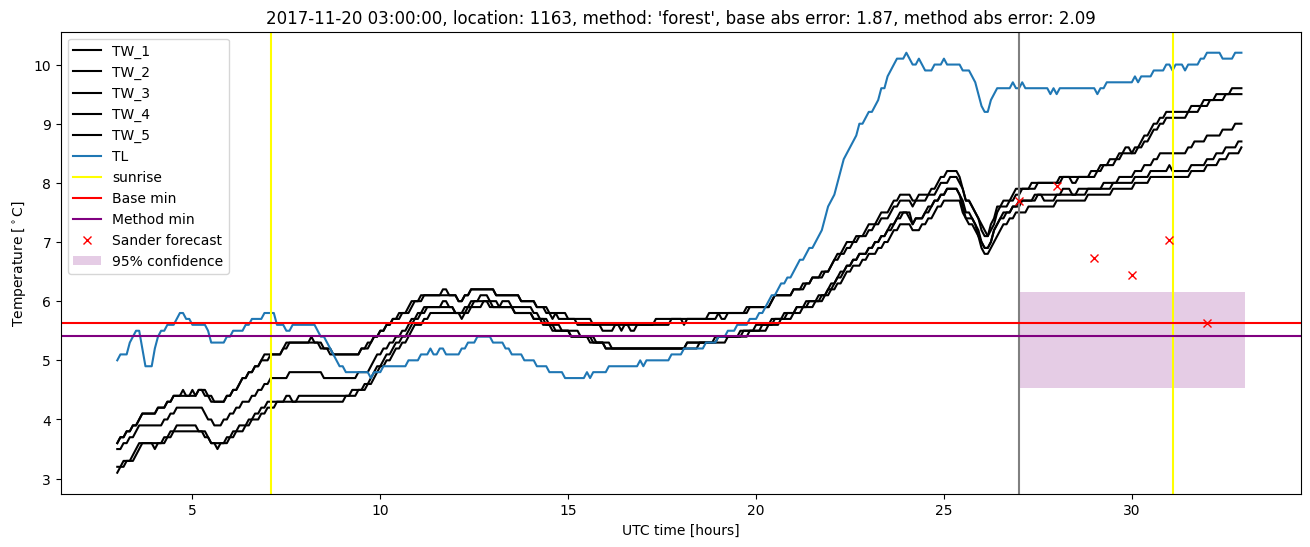
| forest |
winter 2018 |
0.972 |
0.146 |
0.394 |
0.468 |
2.090 |
0.587 |
2.965 |
| baseline |
winter 2019 |
0.992 |
0.150 |
0.389 |
0.442 |
2.857 |
NaN |
NaN |
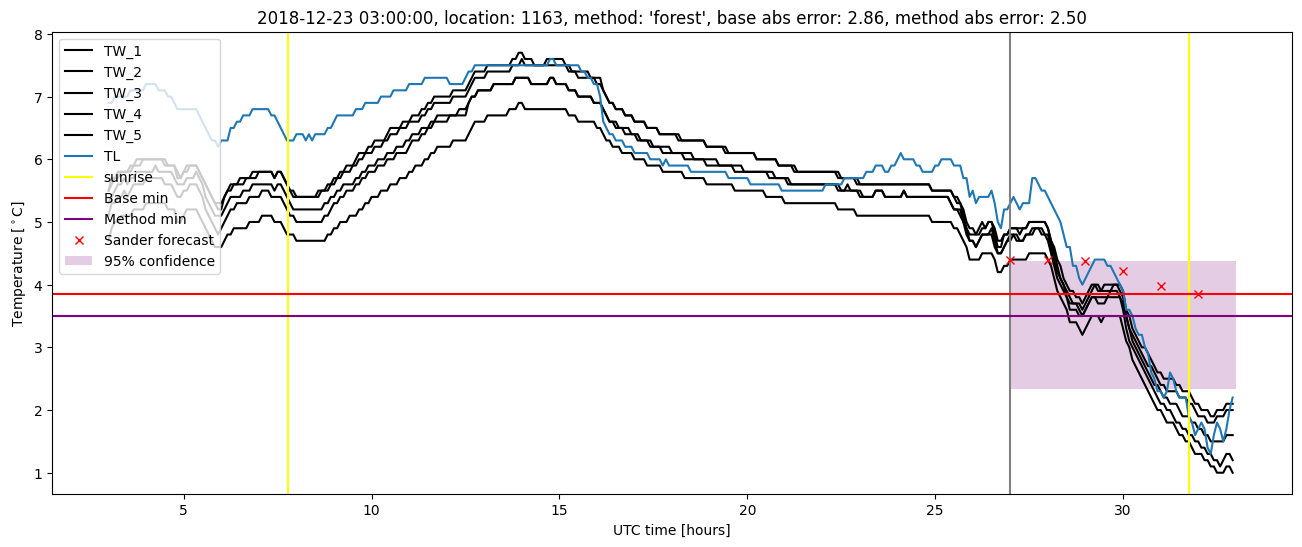
| forest |
winter 2019 |
0.985 |
0.100 |
0.286 |
0.379 |
2.502 |
0.571 |
2.950 |
| baseline |
all |
0.987 |
0.096 |
0.423 |
0.454 |
3.975 |
NaN |
NaN |
| forest |
all |
0.974 |
0.067 |
0.358 |
0.426 |
3.669 |
0.577 |
3.044 |
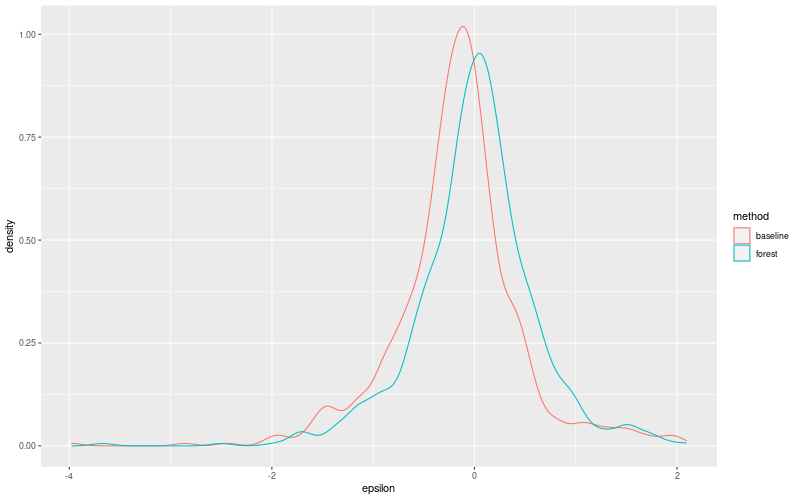
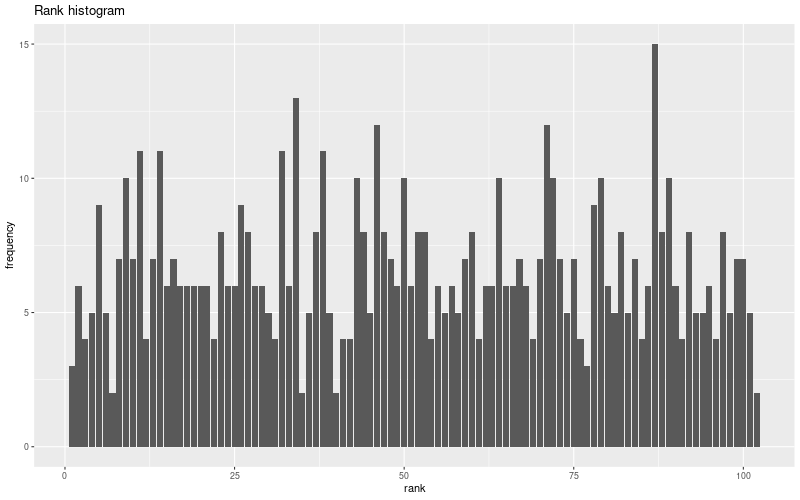
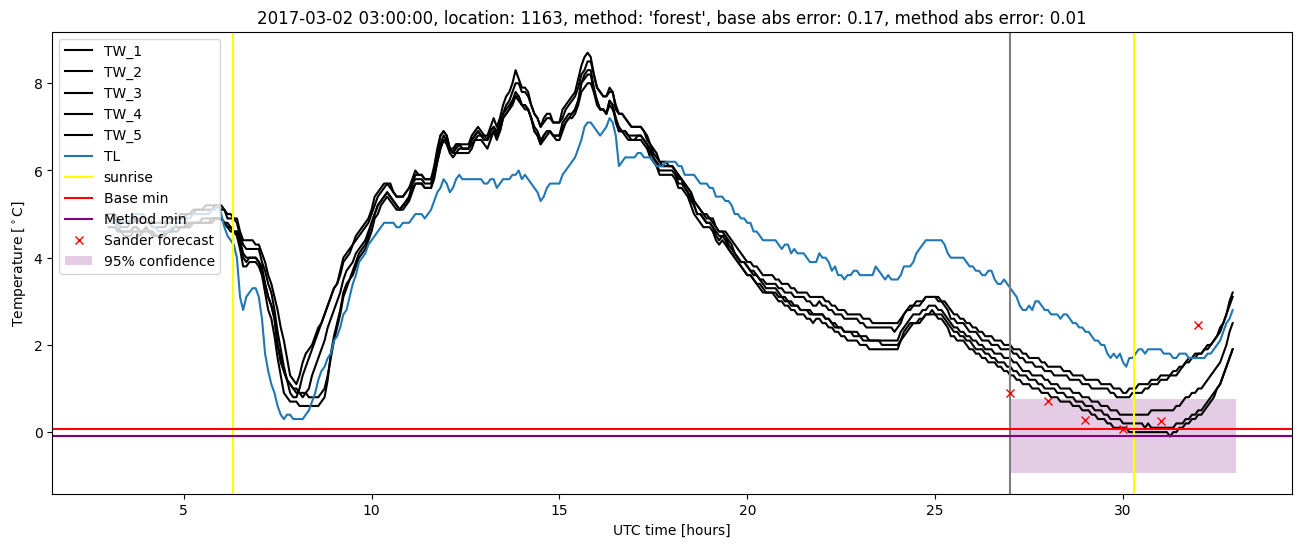
Random forest plots
Extended logistic regression results
| names |
period |
power |
significance |
meanSquareError |
absError |
maxError |
CRPS |
IGN |
| baseline |
winter 2016 |
0.993 |
0.000e+00 |
0.378 |
0.435 |
2.439 |
NaN |
NaN |
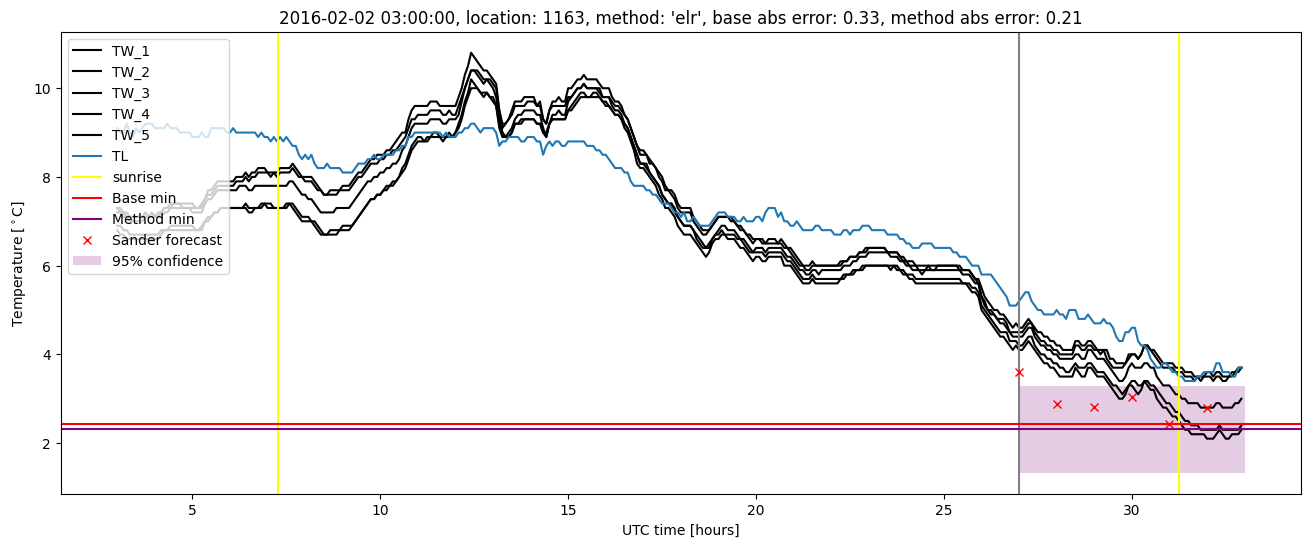
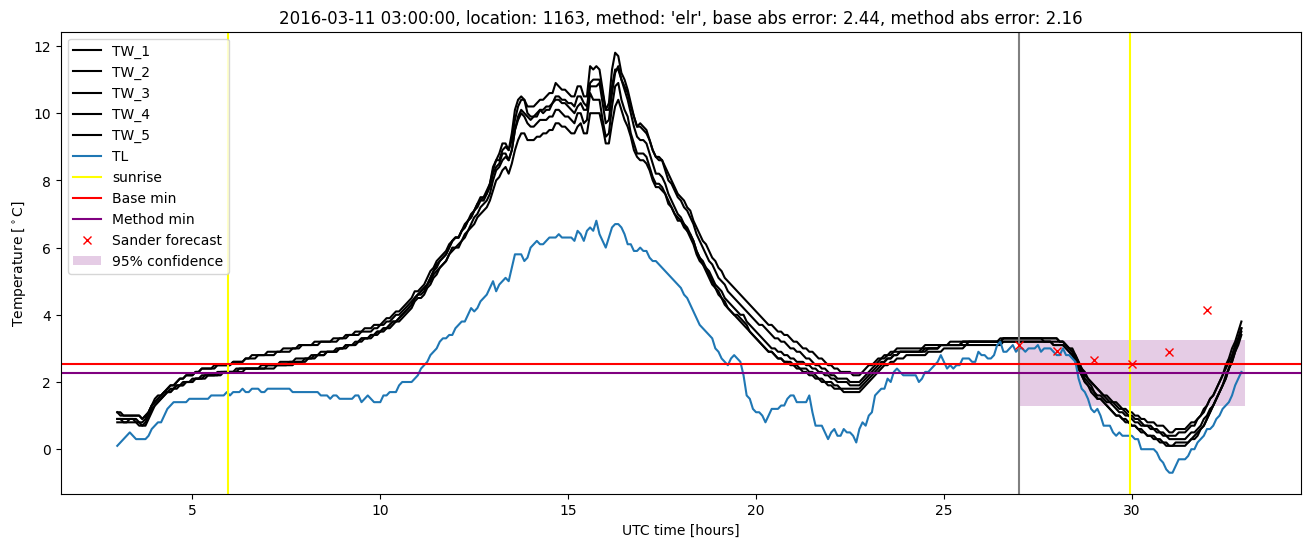
| elr |
winter 2016 |
0.987 |
0.000e+00 |
0.321 |
0.443 |
2.165 |
0.636 |
3.918 |
| baseline |
winter 2017 |
0.991 |
0.073 |
0.515 |
0.492 |
3.975 |
NaN |
NaN |
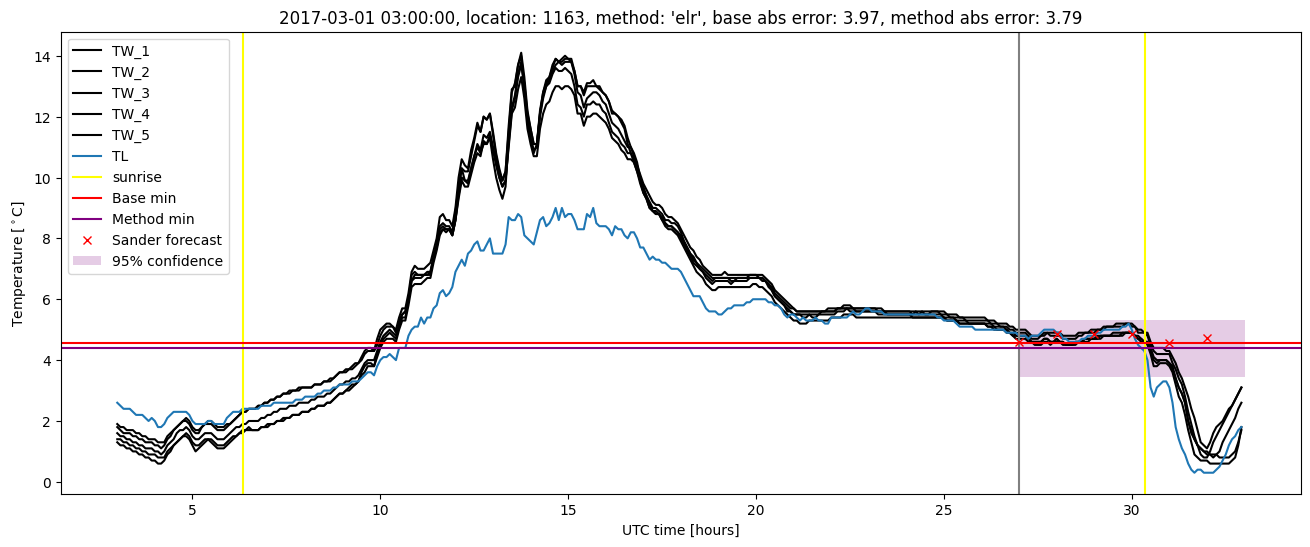
| elr |
winter 2017 |
0.973 |
0.000e+00 |
0.491 |
0.494 |
3.789 |
0.610 |
4.297 |
| baseline |
winter 2018 |
0.972 |
0.171 |
0.418 |
0.451 |
2.001 |
NaN |
NaN |
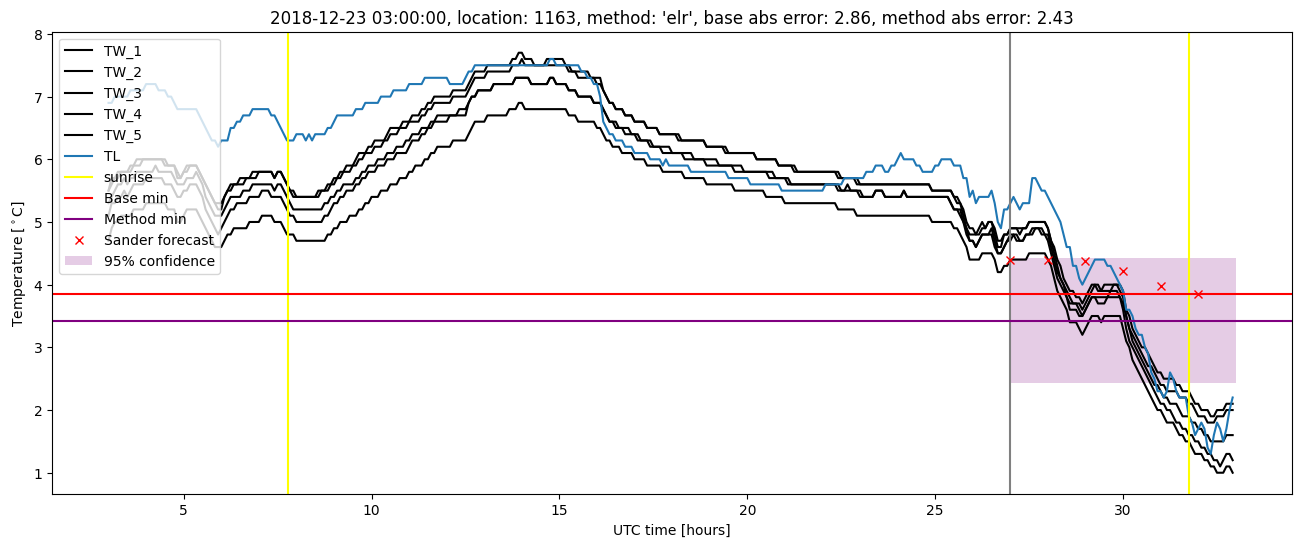
| elr |
winter 2018 |
0.957 |
0.073 |
0.417 |
0.491 |
2.291 |
0.635 |
4.086 |
| baseline |
winter 2019 |
0.992 |
0.150 |
0.389 |
0.442 |
2.857 |
NaN |
NaN |
| elr |
winter 2019 |
0.992 |
0.100 |
0.302 |
0.390 |
2.428 |
0.585 |
3.258 |
| baseline |
all |
0.987 |
0.096 |
0.423 |
0.454 |
3.975 |
NaN |
NaN |
| elr |
all |
0.978 |
0.037 |
0.381 |
0.456 |
3.789 |
0.618 |
3.900 |
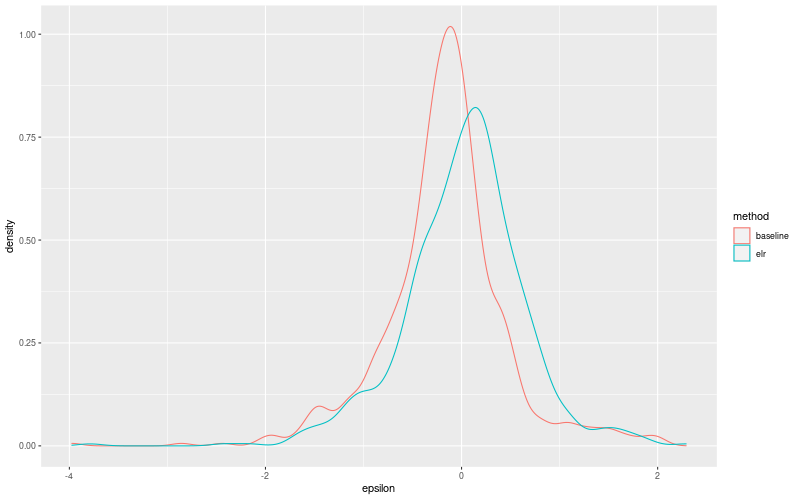
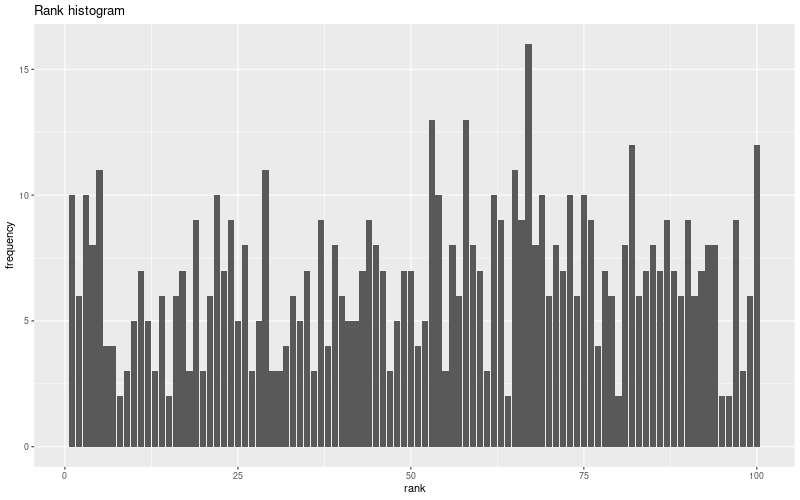
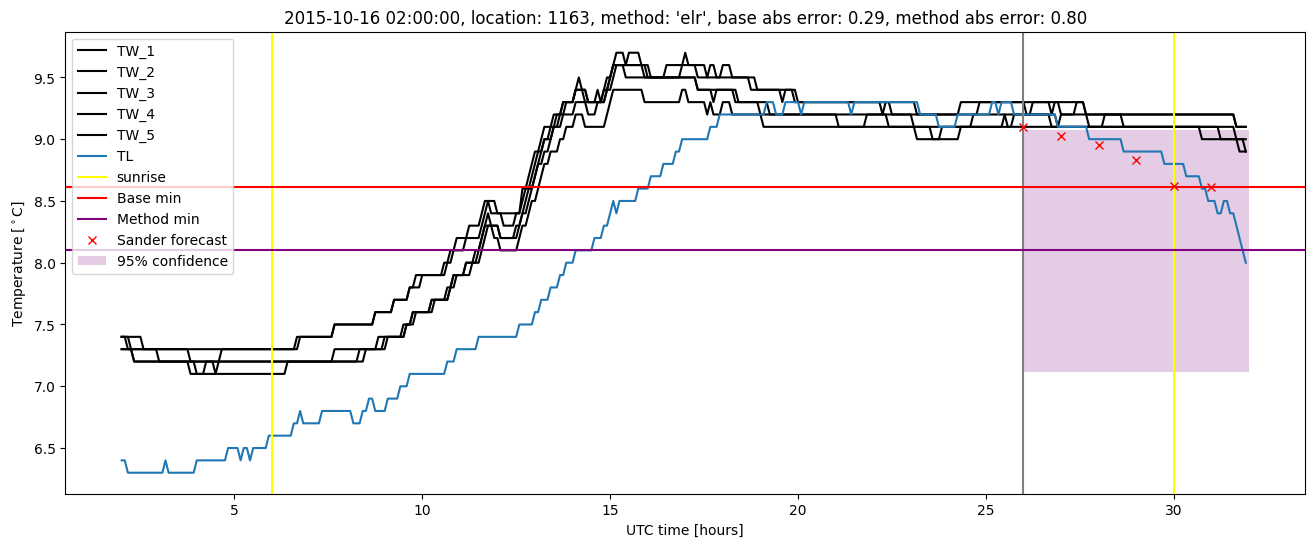
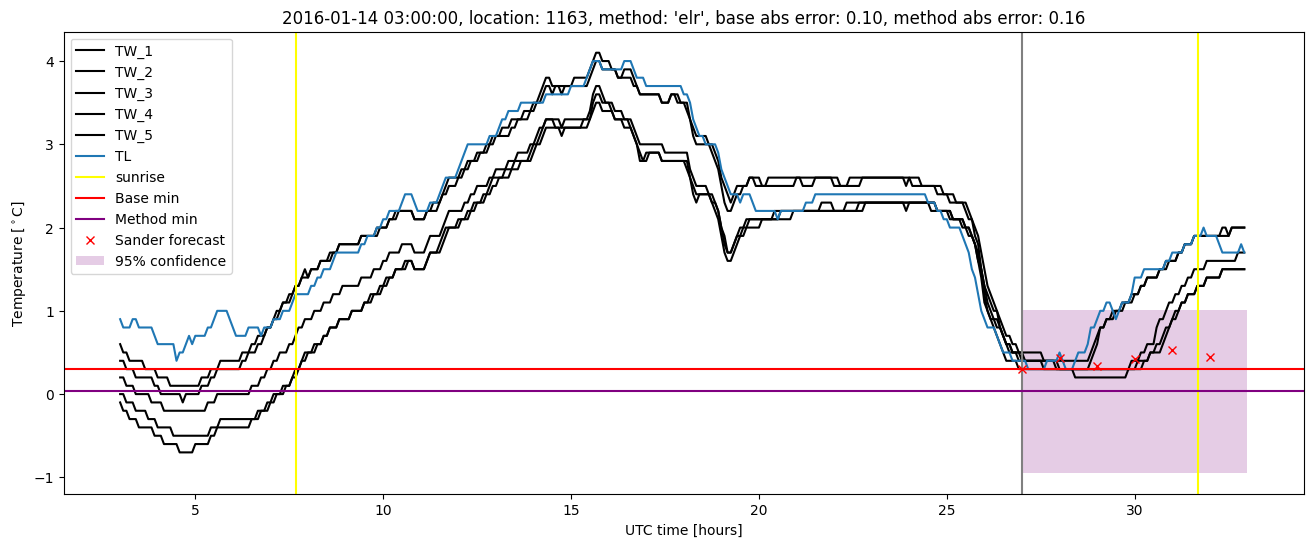
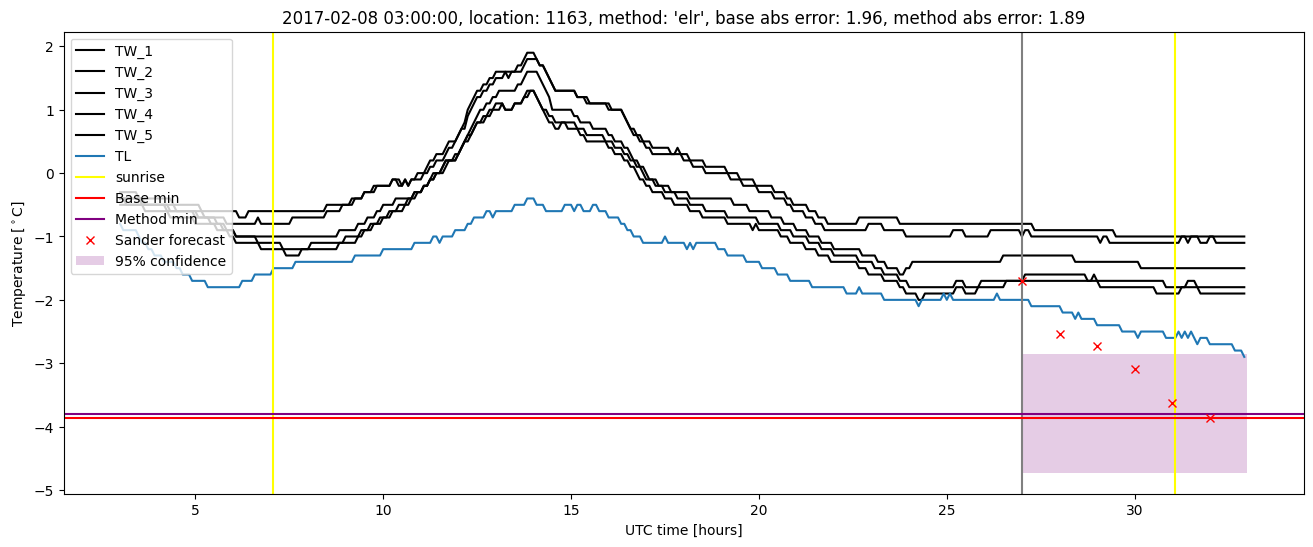
Extended logistic regression plots