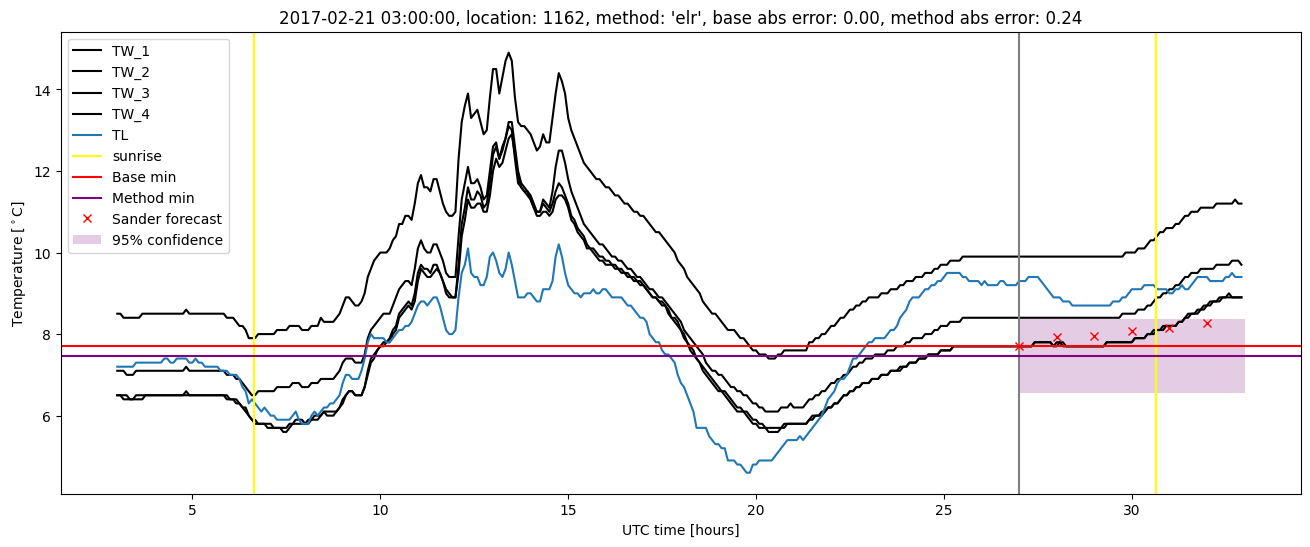
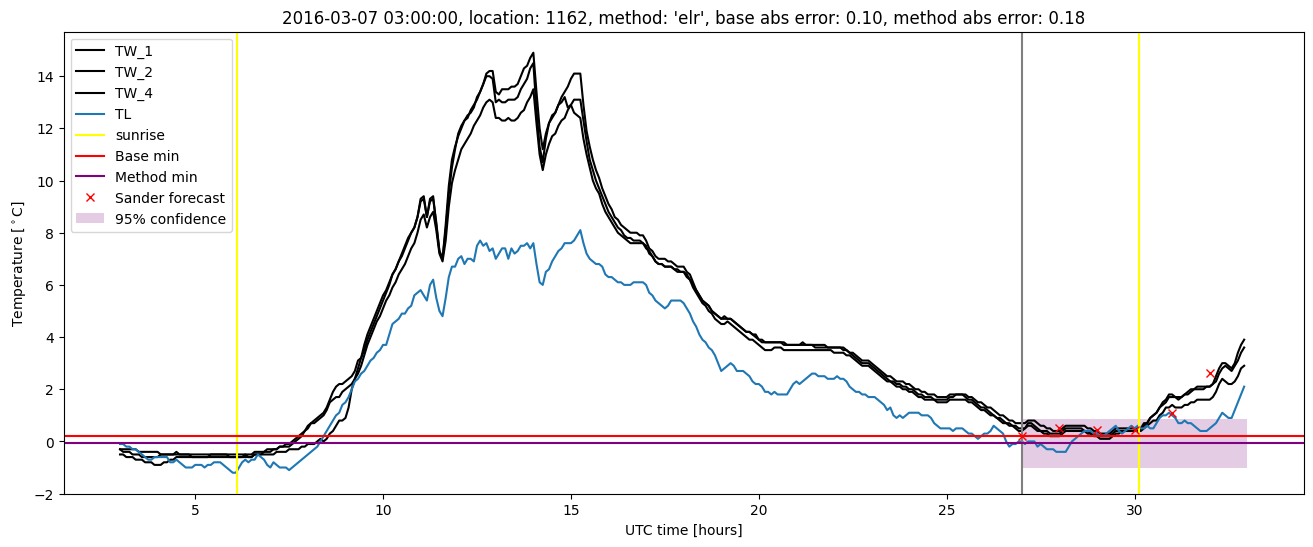
GMS location: 1162
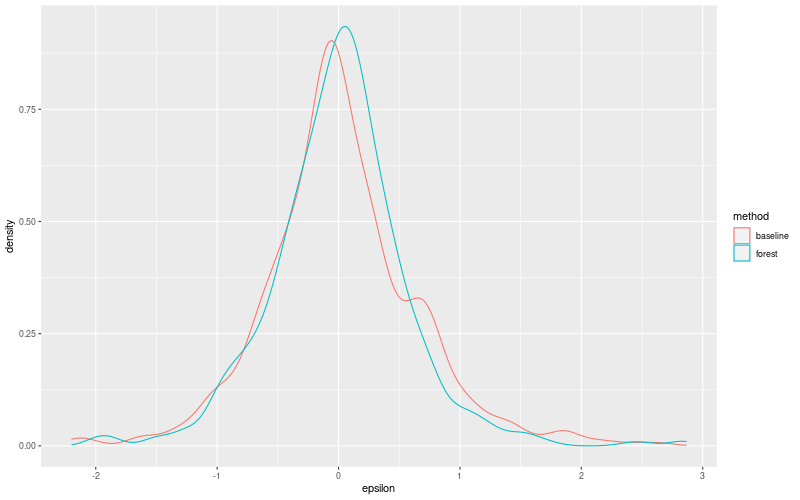
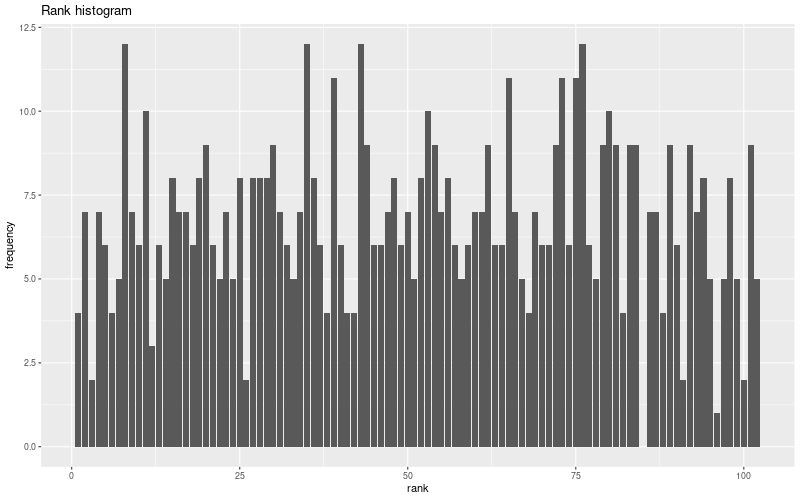
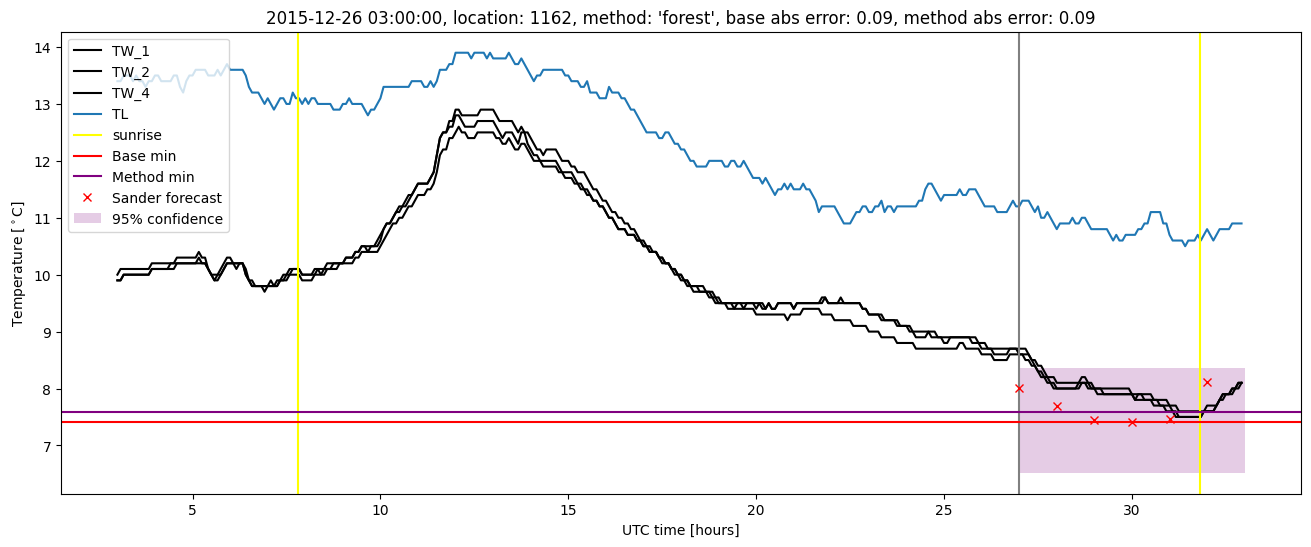
Random forest results
| names |
period |
power |
significance |
meanSquareError |
absError |
maxError |
CRPS |
IGN |
| baseline |
winter 2016 |
0.989 |
0.097 |
0.370 |
0.439 |
2.197 |
NaN |
NaN |
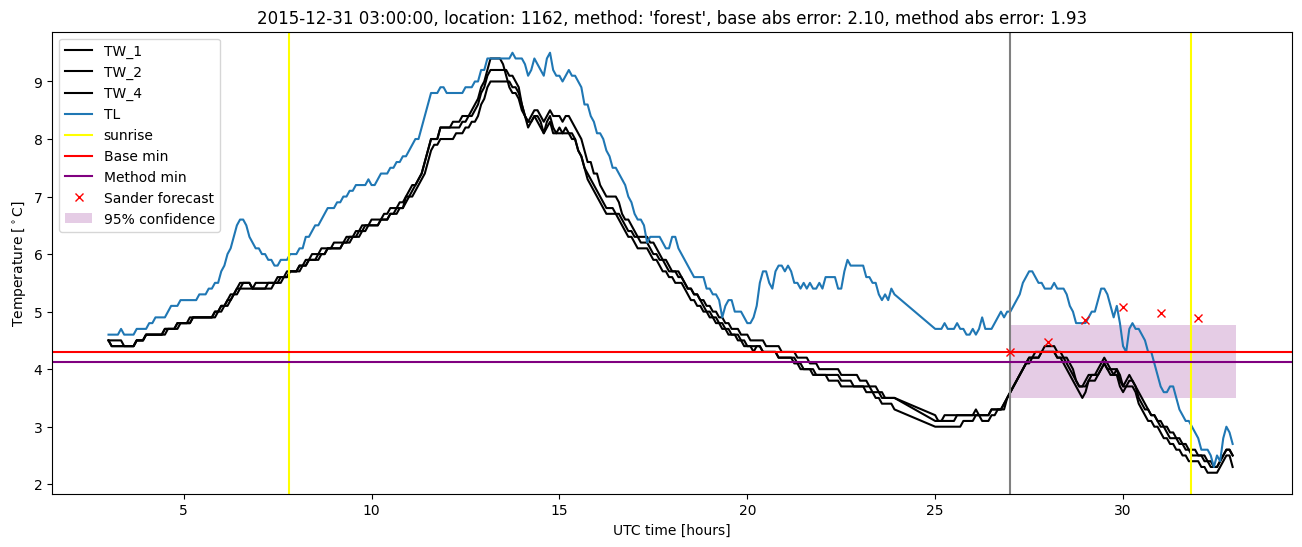
| forest |
winter 2016 |
0.994 |
0.065 |
0.287 |
0.381 |
1.931 |
0.488 |
2.744 |
| baseline |
winter 2017 |
0.992 |
0.028 |
0.460 |
0.490 |
2.130 |
NaN |
NaN |
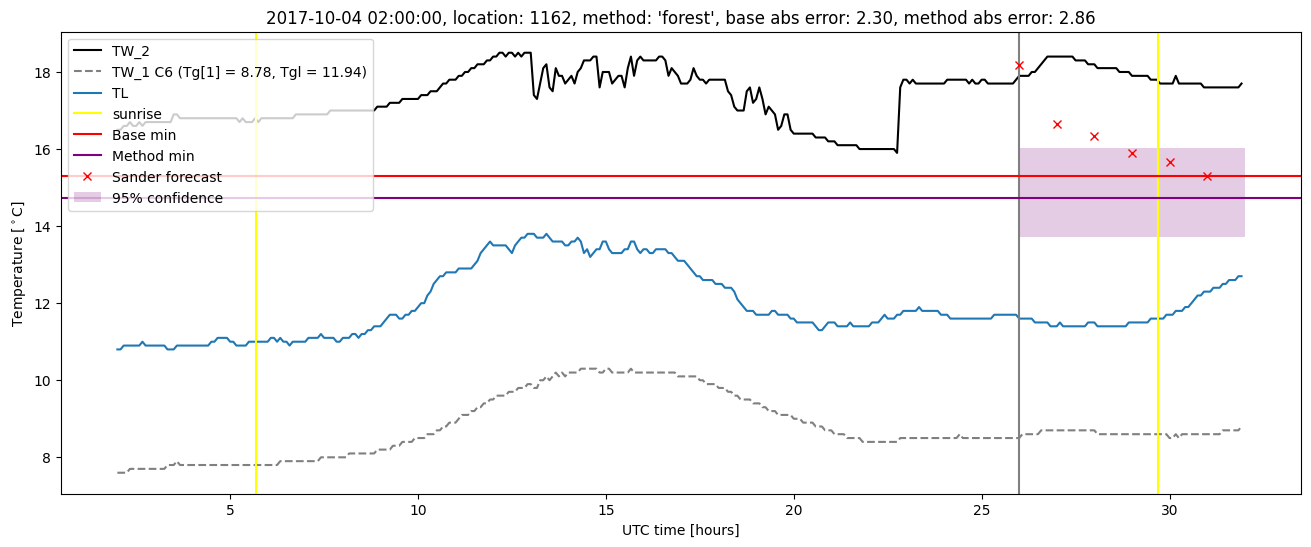
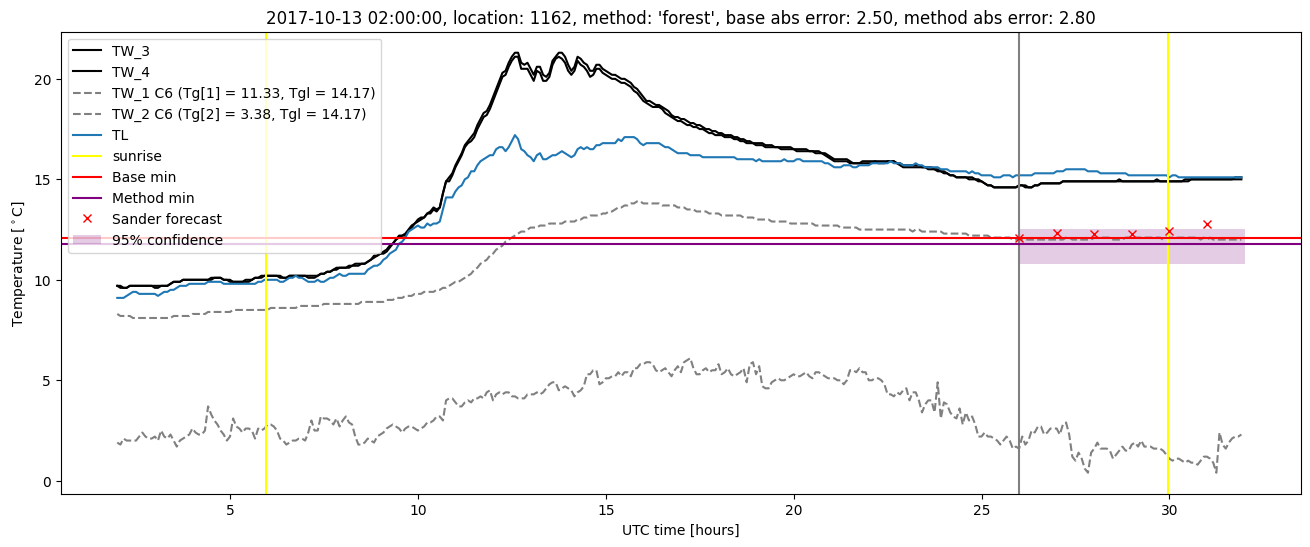
| forest |
winter 2017 |
1.000 |
0.028 |
0.289 |
0.399 |
1.593 |
0.482 |
2.978 |
| baseline |
winter 2018 |
0.972 |
0.151 |
0.449 |
0.477 |
2.669 |
NaN |
NaN |
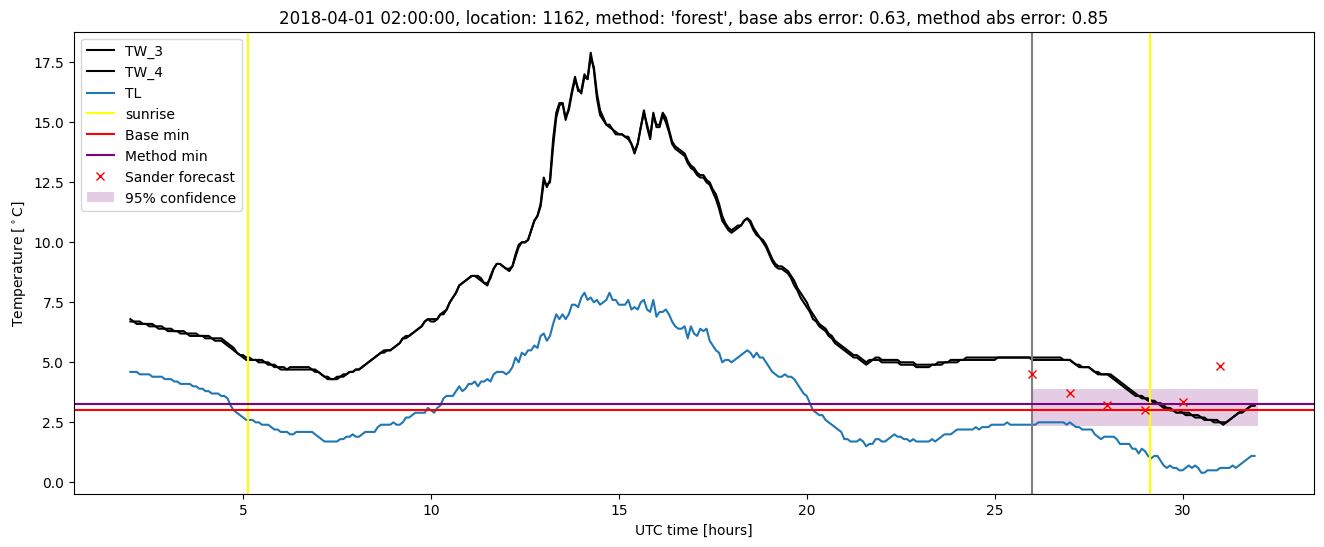
| forest |
winter 2018 |
0.986 |
0.151 |
0.454 |
0.468 |
2.863 |
0.489 |
3.274 |
| baseline |
winter 2019 |
0.993 |
0.000e+00 |
0.323 |
0.436 |
1.576 |
NaN |
NaN |
| forest |
winter 2019 |
1.000 |
0.000e+00 |
0.234 |
0.376 |
2.021 |
0.470 |
2.905 |
| baseline |
all |
0.986 |
0.082 |
0.400 |
0.459 |
2.669 |
NaN |
NaN |
| forest |
all |
0.995 |
0.073 |
0.318 |
0.406 |
2.863 |
0.483 |
2.967 |
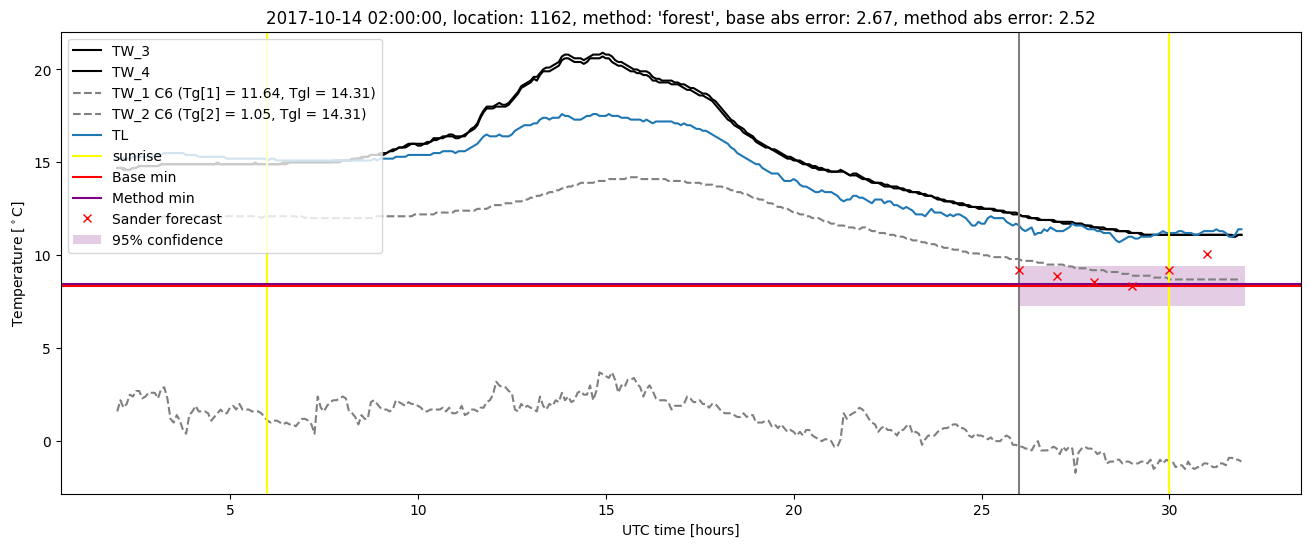
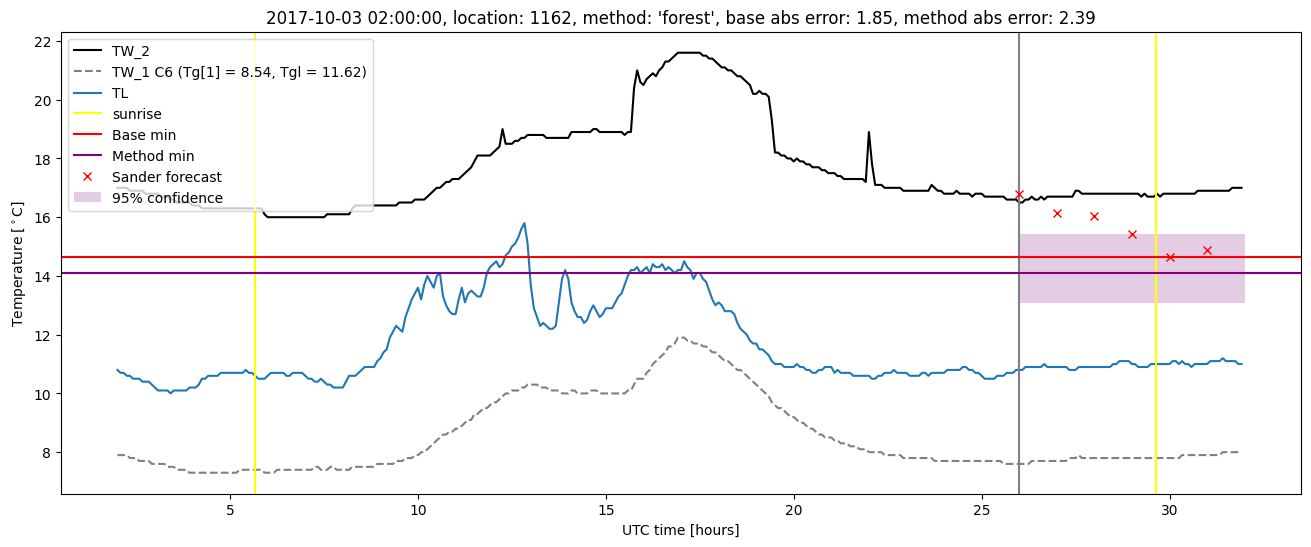
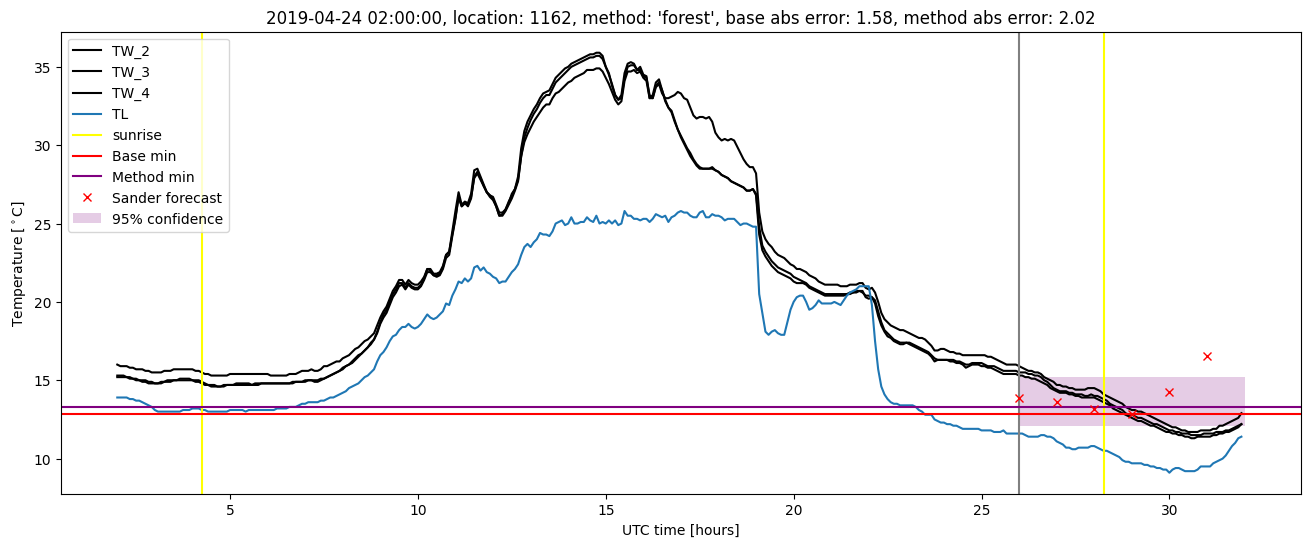
Random forest plots
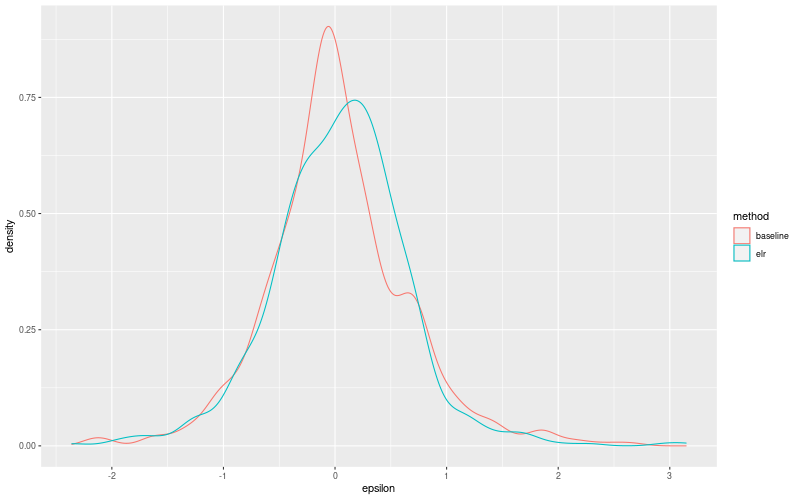
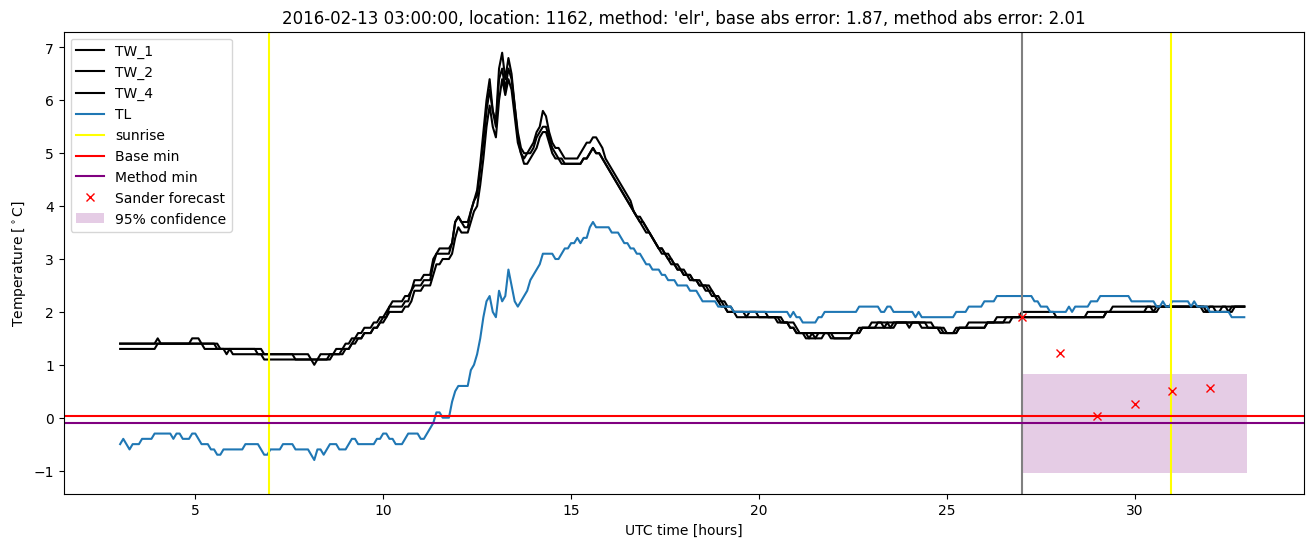
Extended logistic regression results
| names |
period |
power |
significance |
meanSquareError |
absError |
maxError |
CRPS |
IGN |
| baseline |
winter 2016 |
0.989 |
0.097 |
0.370 |
0.439 |
2.197 |
NaN |
NaN |
| elr |
winter 2016 |
0.977 |
0.065 |
0.316 |
0.426 |
2.007 |
0.554 |
3.677 |
| baseline |
winter 2017 |
0.992 |
0.028 |
0.460 |
0.490 |
2.130 |
NaN |
NaN |
| elr |
winter 2017 |
0.992 |
0.028 |
0.345 |
0.438 |
1.781 |
0.520 |
3.481 |
| baseline |
winter 2018 |
0.972 |
0.151 |
0.449 |
0.477 |
2.669 |
NaN |
NaN |
| elr |
winter 2018 |
0.986 |
0.151 |
0.475 |
0.501 |
3.146 |
0.569 |
4.881 |
| baseline |
winter 2019 |
0.993 |
0.000e+00 |
0.323 |
0.436 |
1.576 |
NaN |
NaN |
| elr |
winter 2019 |
1.000 |
0.000e+00 |
0.331 |
0.452 |
2.358 |
0.518 |
3.157 |
| baseline |
all |
0.986 |
0.082 |
0.400 |
0.459 |
2.669 |
NaN |
NaN |
| elr |
all |
0.988 |
0.073 |
0.366 |
0.454 |
3.146 |
0.542 |
3.824 |
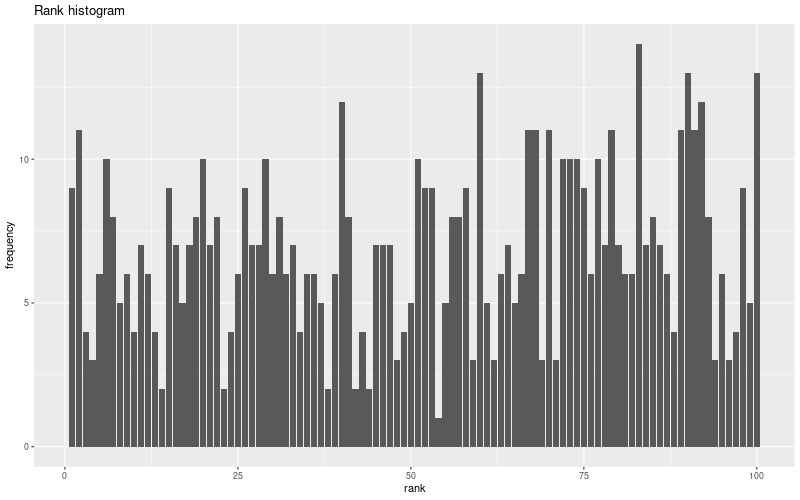
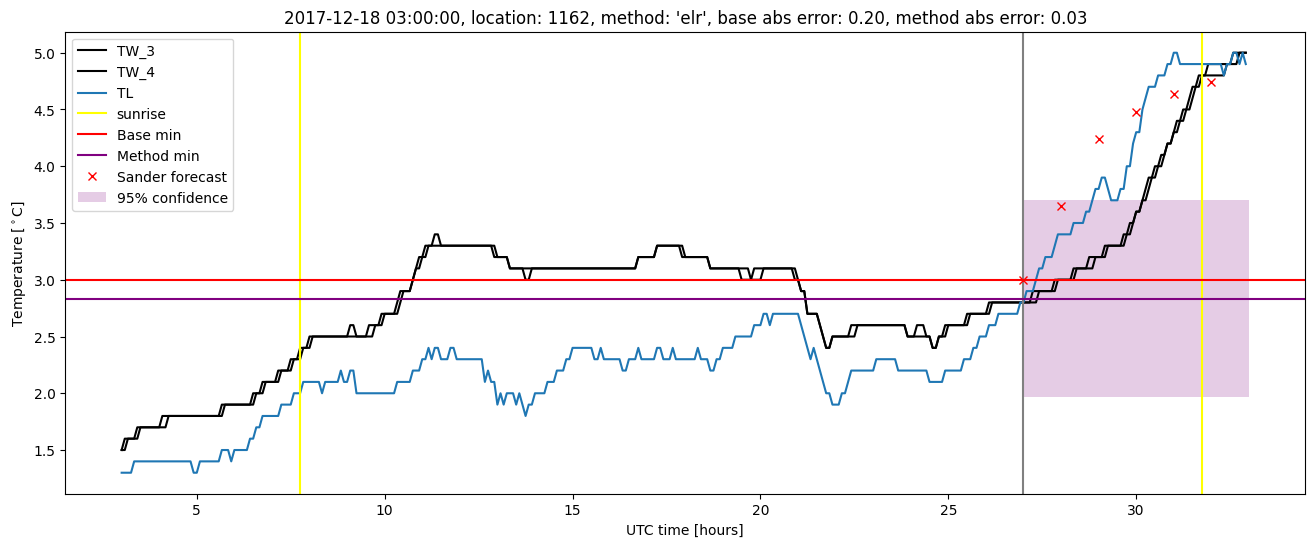
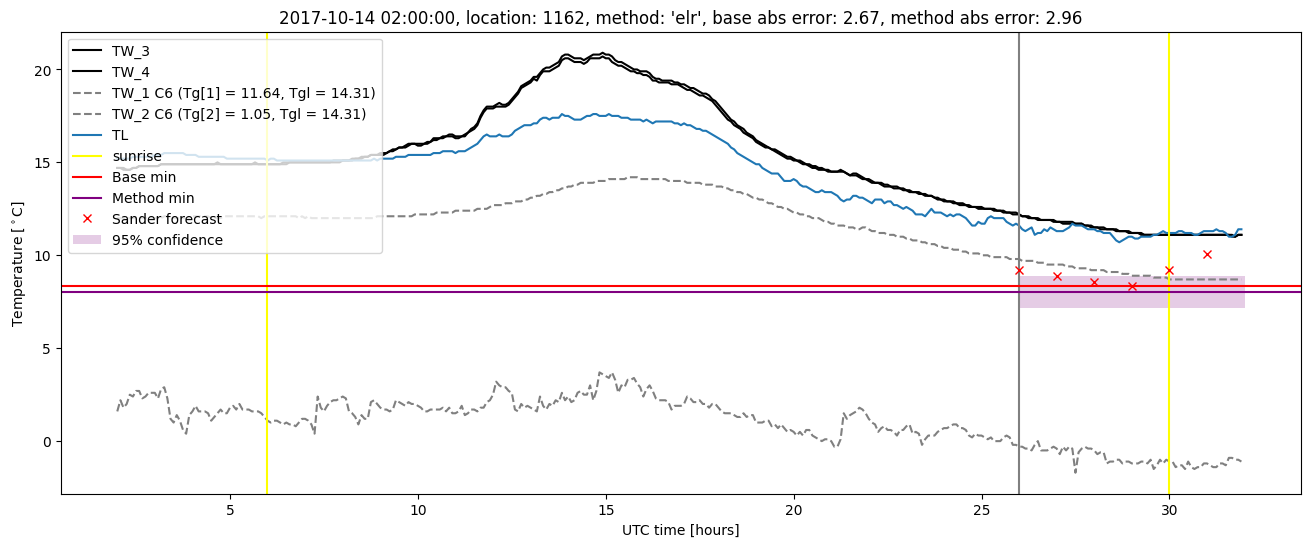
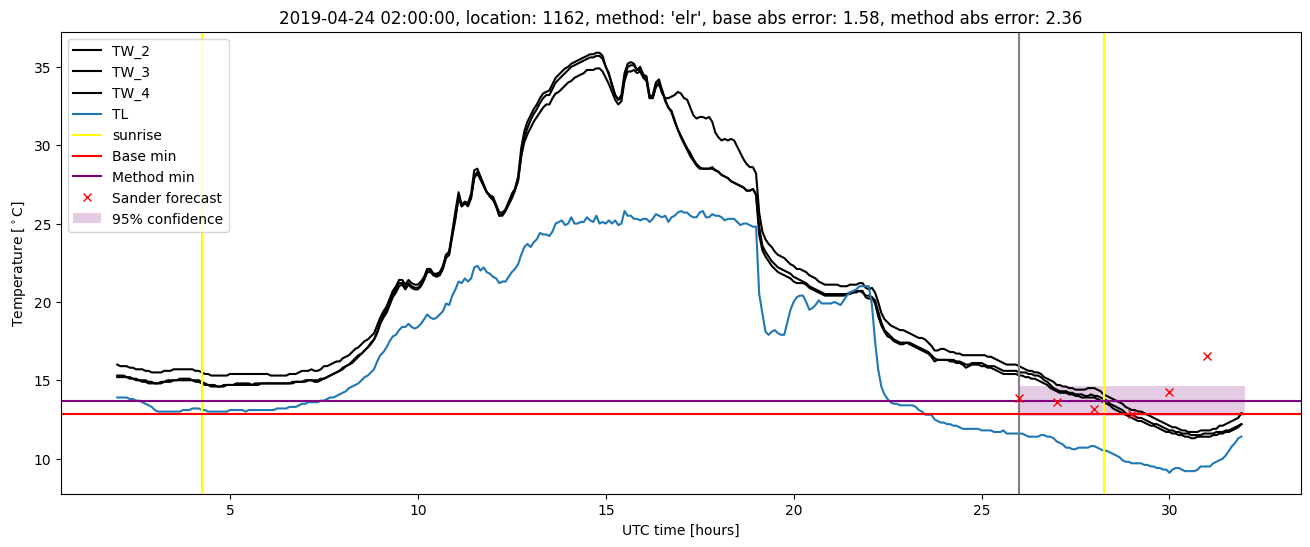
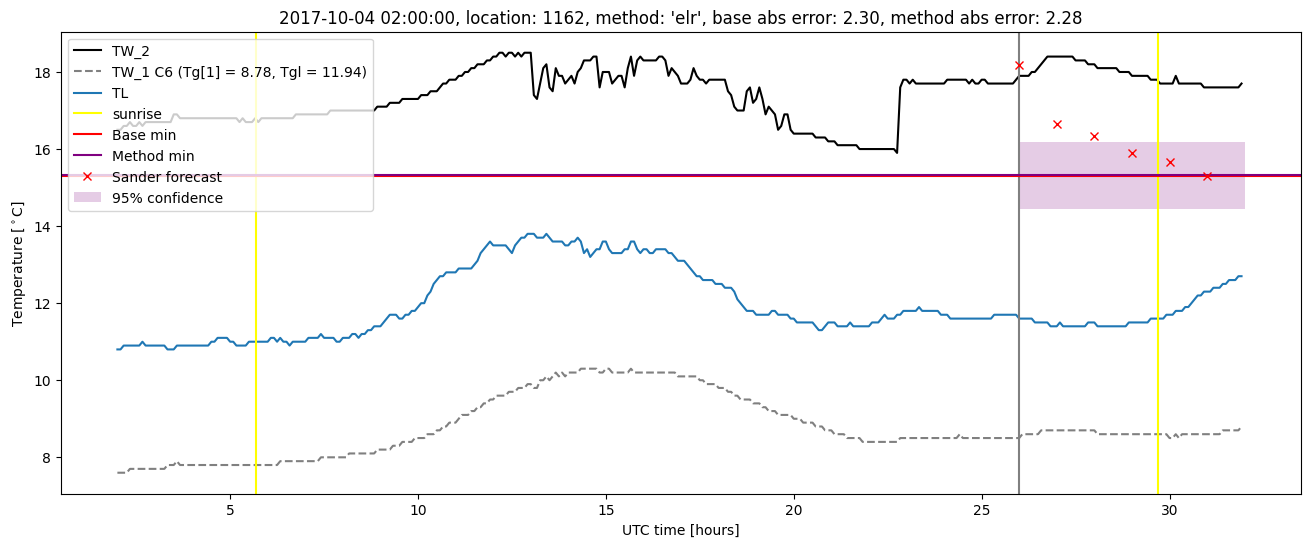
Extended logistic regression plots