GMS location: 1161
Random forest results
| names |
period |
power |
significance |
meanSquareError |
absError |
maxError |
CRPS |
IGN |
| baseline |
winter 2016 |
0.994 |
0.028 |
0.315 |
0.406 |
2.082 |
NaN |
NaN |
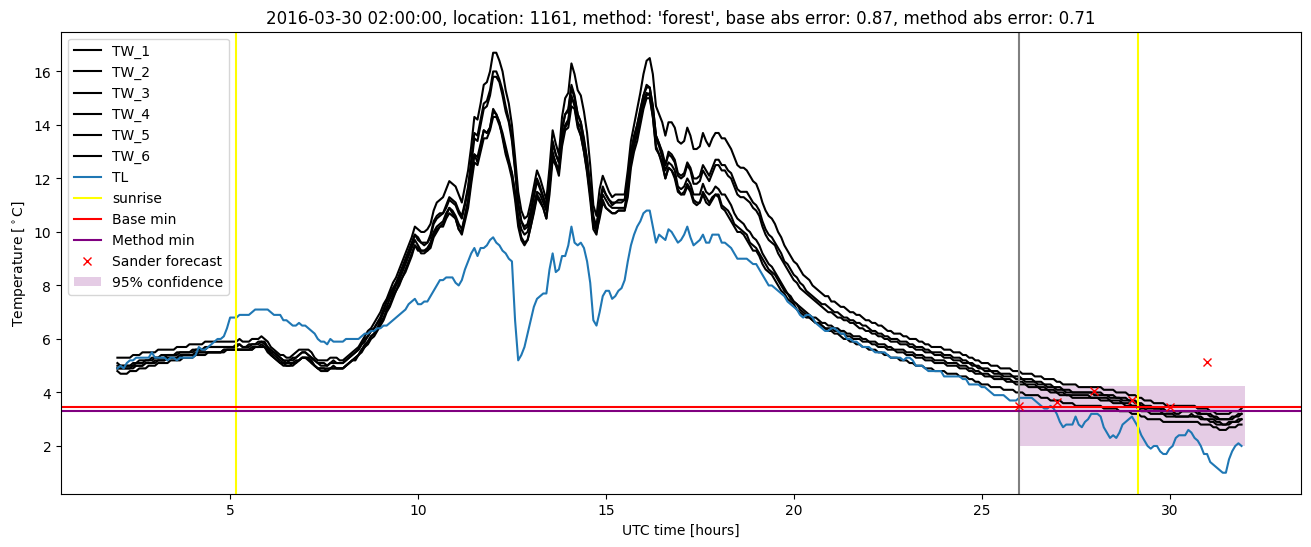
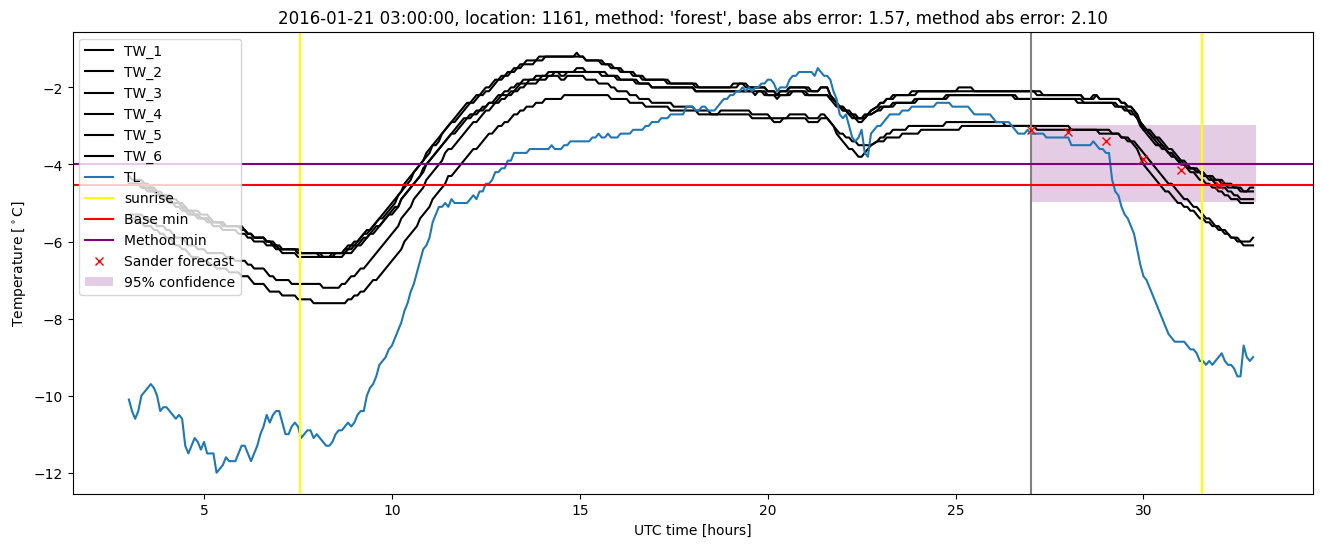
| forest |
winter 2016 |
0.977 |
0.028 |
0.330 |
0.429 |
2.104 |
0.564 |
3.810 |
| baseline |
winter 2017 |
0.979 |
0.048 |
0.399 |
0.467 |
1.841 |
NaN |
NaN |
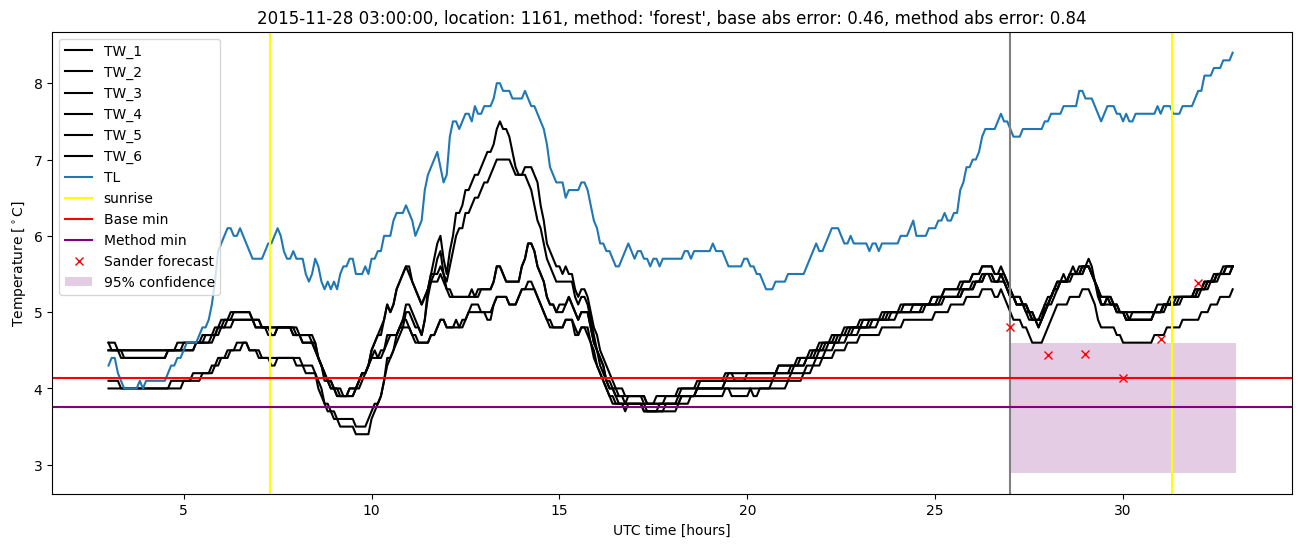
| forest |
winter 2017 |
0.979 |
0.048 |
0.340 |
0.439 |
1.563 |
0.535 |
3.672 |
| baseline |
winter 2018 |
0.976 |
0.109 |
0.430 |
0.476 |
2.587 |
NaN |
NaN |
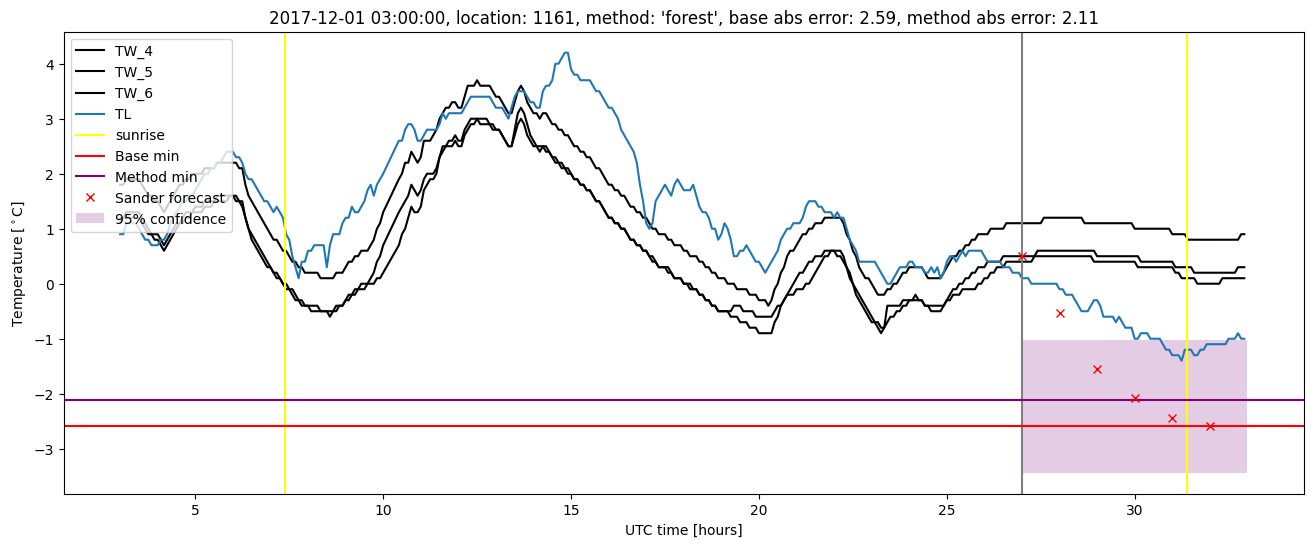
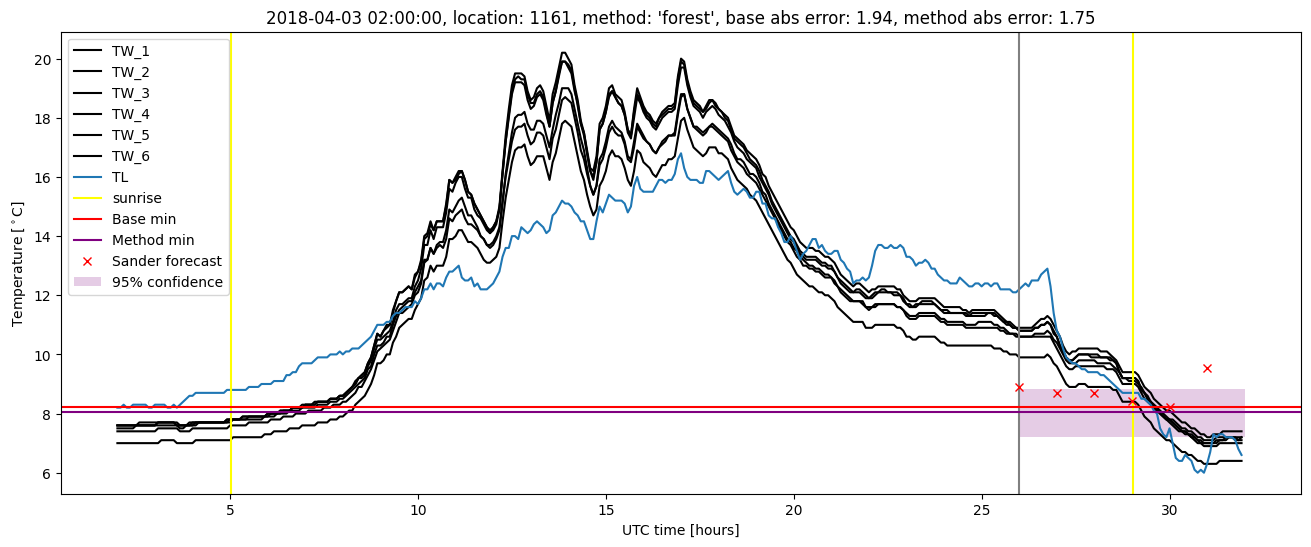
| forest |
winter 2018 |
0.976 |
0.152 |
0.375 |
0.465 |
2.111 |
0.560 |
4.220 |
| baseline |
winter 2019 |
0.992 |
0.000e+00 |
0.343 |
0.415 |
1.927 |
NaN |
NaN |
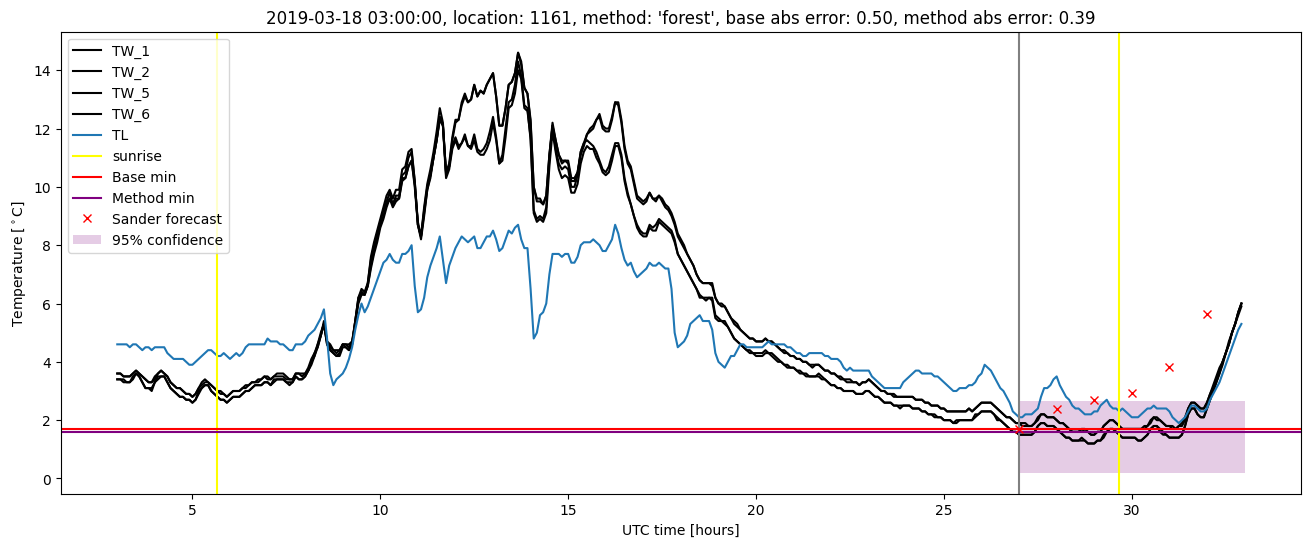
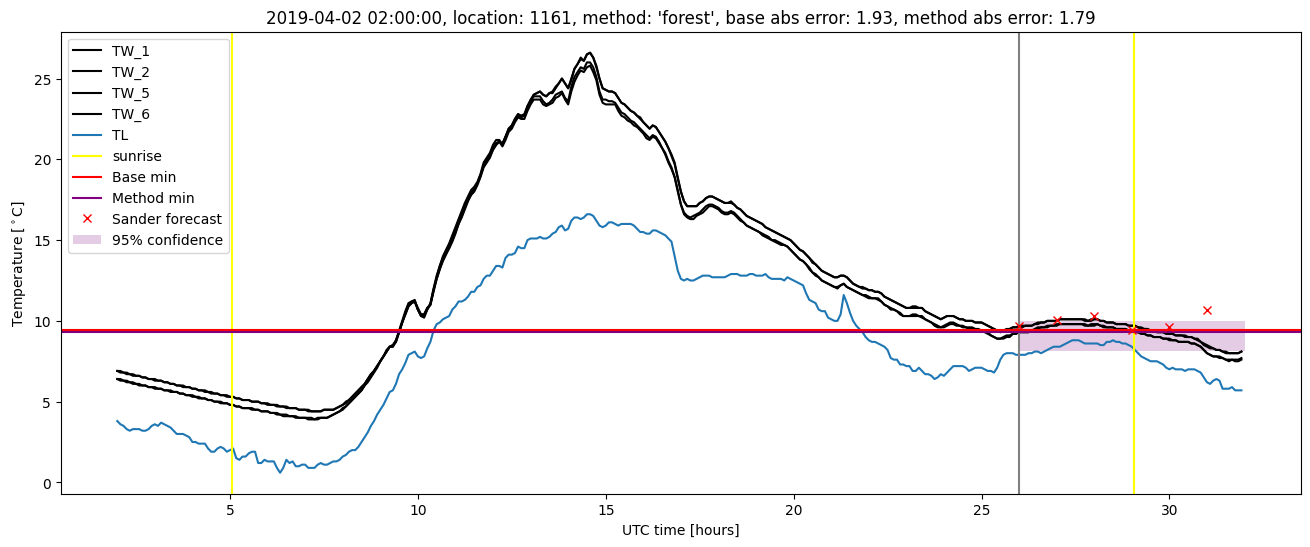
| forest |
winter 2019 |
0.992 |
0.053 |
0.263 |
0.374 |
1.793 |
0.545 |
3.800 |
| baseline |
all |
0.987 |
0.056 |
0.368 |
0.439 |
2.587 |
NaN |
NaN |
| forest |
all |
0.981 |
0.077 |
0.329 |
0.428 |
2.111 |
0.553 |
3.886 |
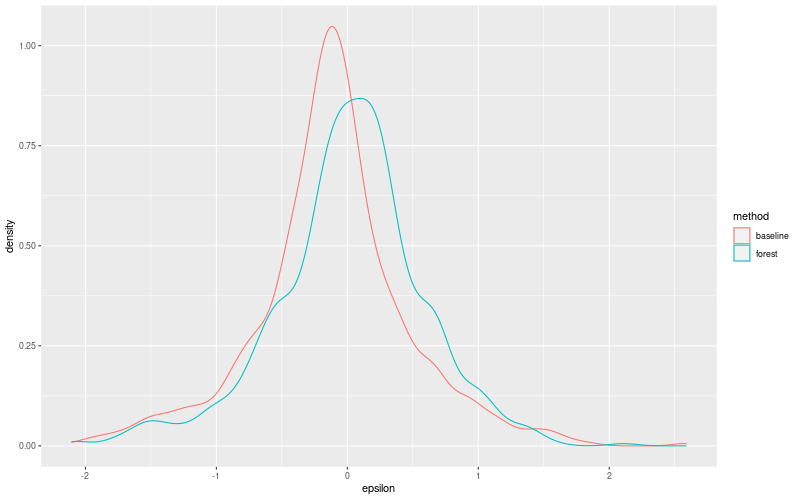
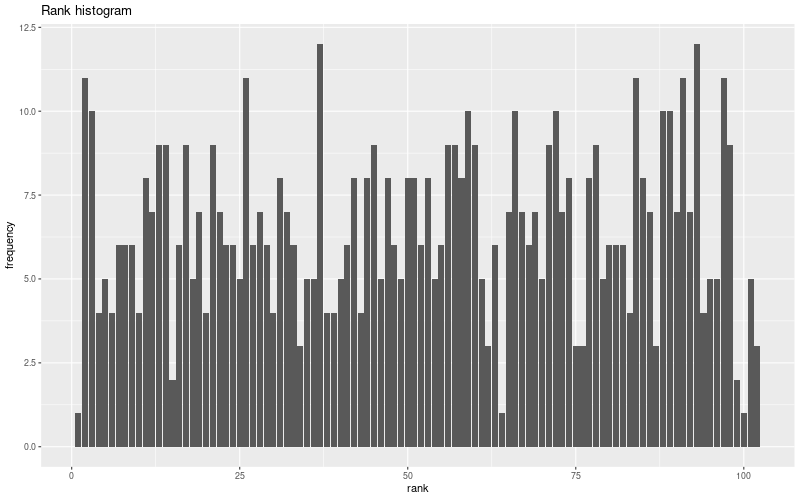
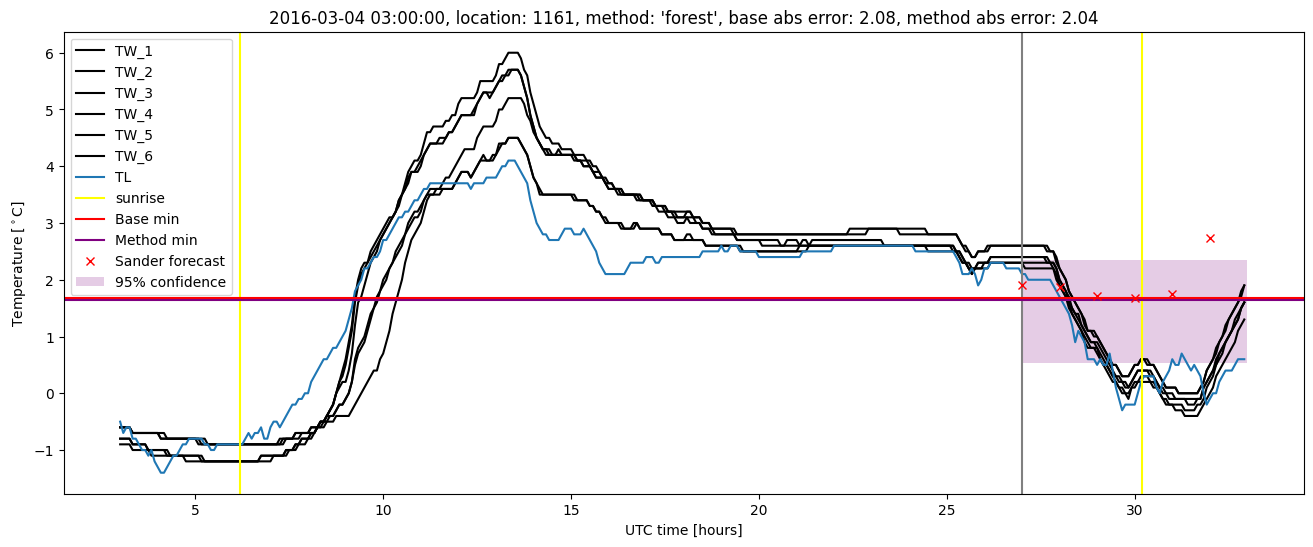
Random forest plots
Extended logistic regression results
| names |
period |
power |
significance |
meanSquareError |
absError |
maxError |
CRPS |
IGN |
| baseline |
winter 2016 |
0.994 |
0.028 |
0.315 |
0.406 |
2.082 |
NaN |
NaN |
| elr |
winter 2016 |
0.982 |
0.028 |
0.351 |
0.461 |
1.935 |
0.638 |
5.513 |
| baseline |
winter 2017 |
0.979 |
0.048 |
0.399 |
0.467 |
1.841 |
NaN |
NaN |
| elr |
winter 2017 |
0.979 |
0.024 |
0.379 |
0.465 |
1.728 |
0.594 |
4.952 |
| baseline |
winter 2018 |
0.976 |
0.109 |
0.430 |
0.476 |
2.587 |
NaN |
NaN |
| elr |
winter 2018 |
0.953 |
0.109 |
0.373 |
0.463 |
2.227 |
0.606 |
5.010 |
| baseline |
winter 2019 |
0.992 |
0.000e+00 |
0.343 |
0.415 |
1.927 |
NaN |
NaN |
| elr |
winter 2019 |
0.992 |
0.053 |
0.293 |
0.402 |
1.709 |
0.587 |
4.628 |
| baseline |
all |
0.987 |
0.056 |
0.368 |
0.439 |
2.587 |
NaN |
NaN |
| elr |
all |
0.977 |
0.056 |
0.349 |
0.449 |
2.227 |
0.609 |
5.067 |
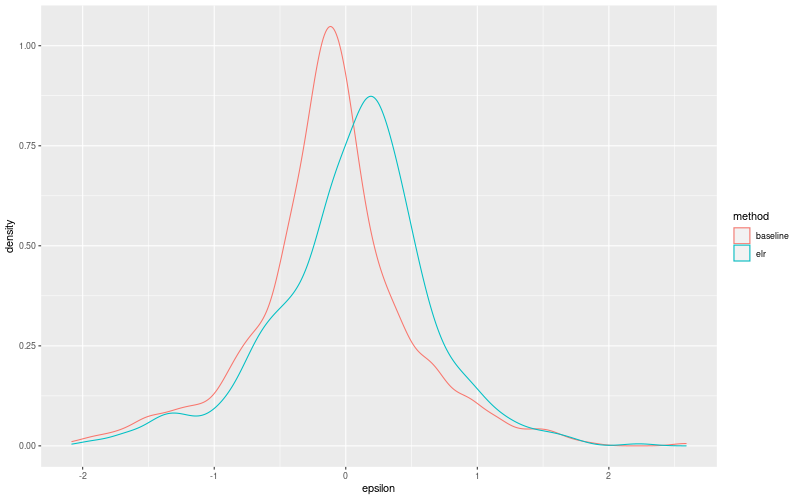
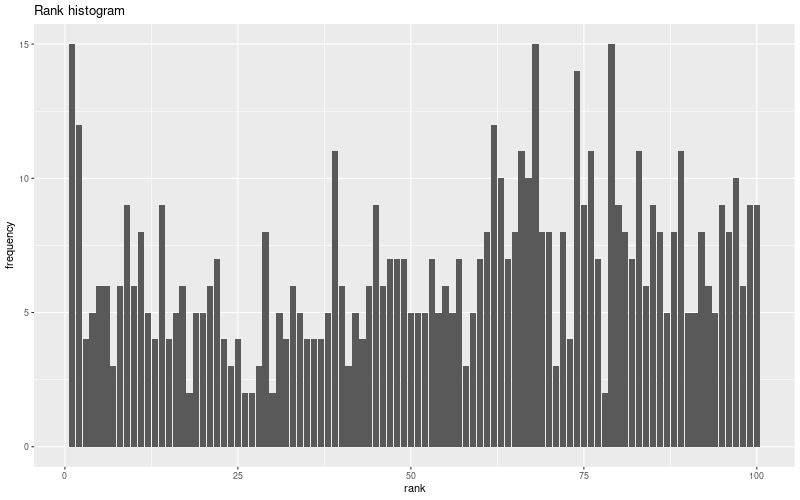
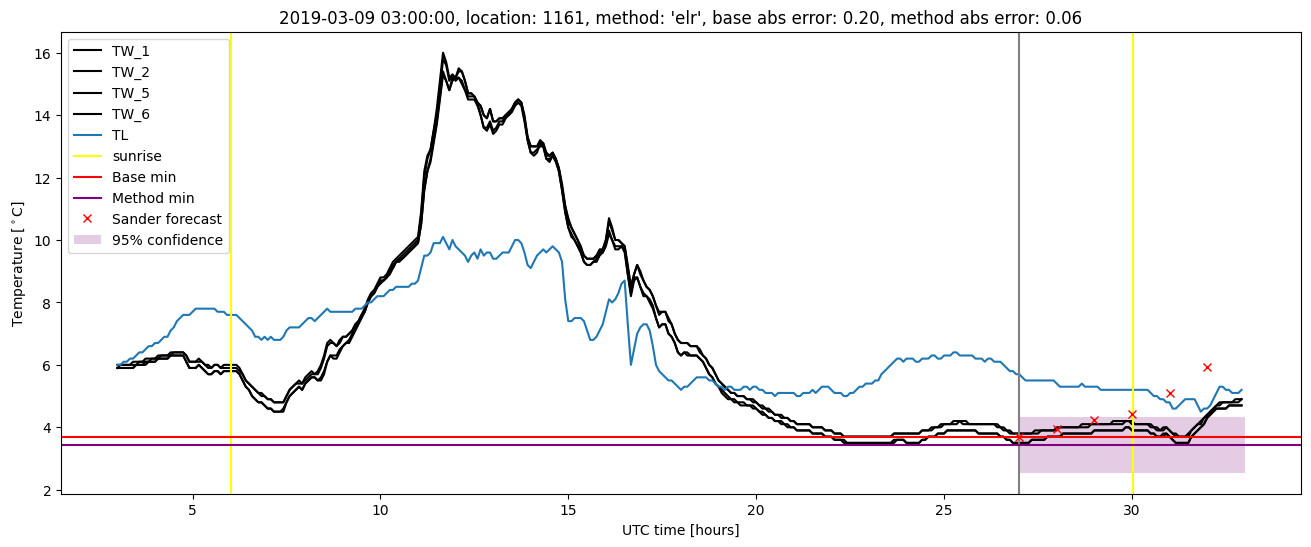
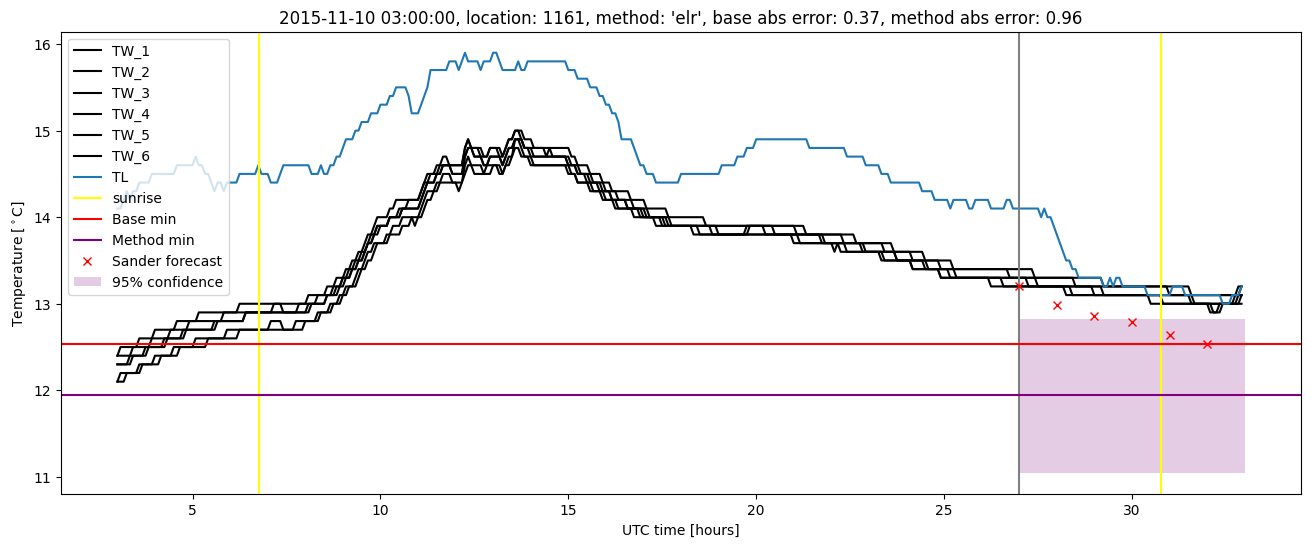
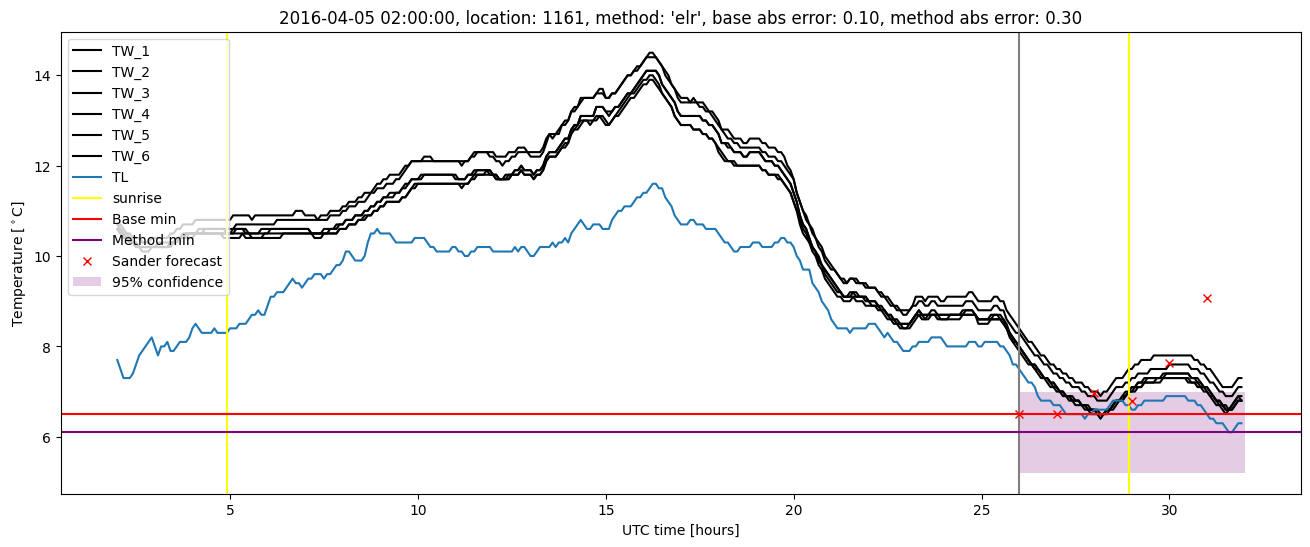
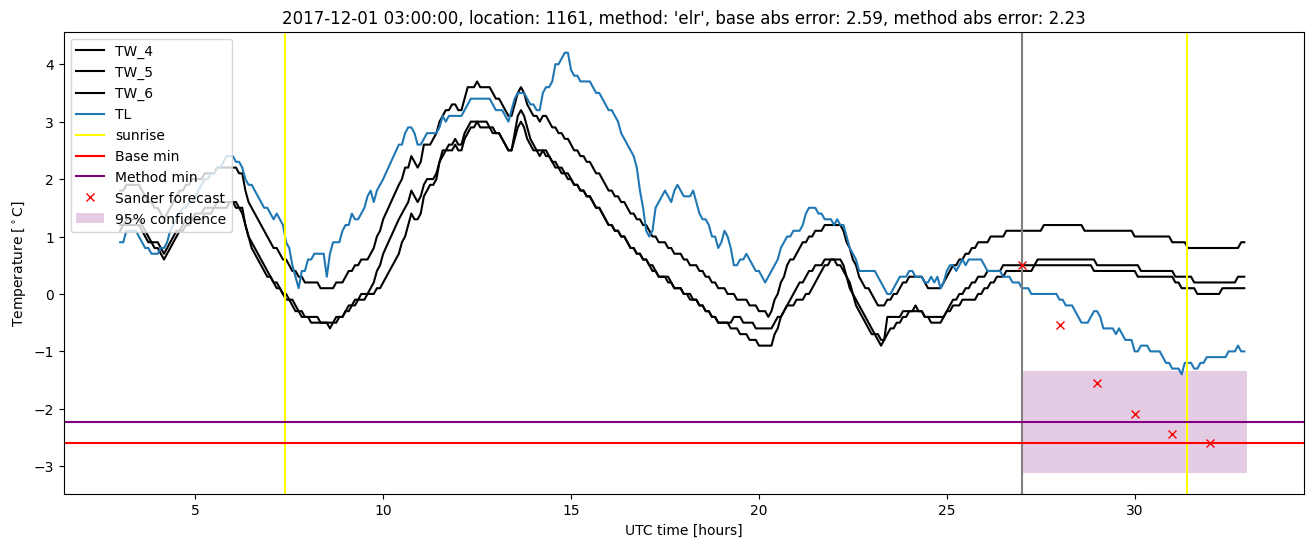
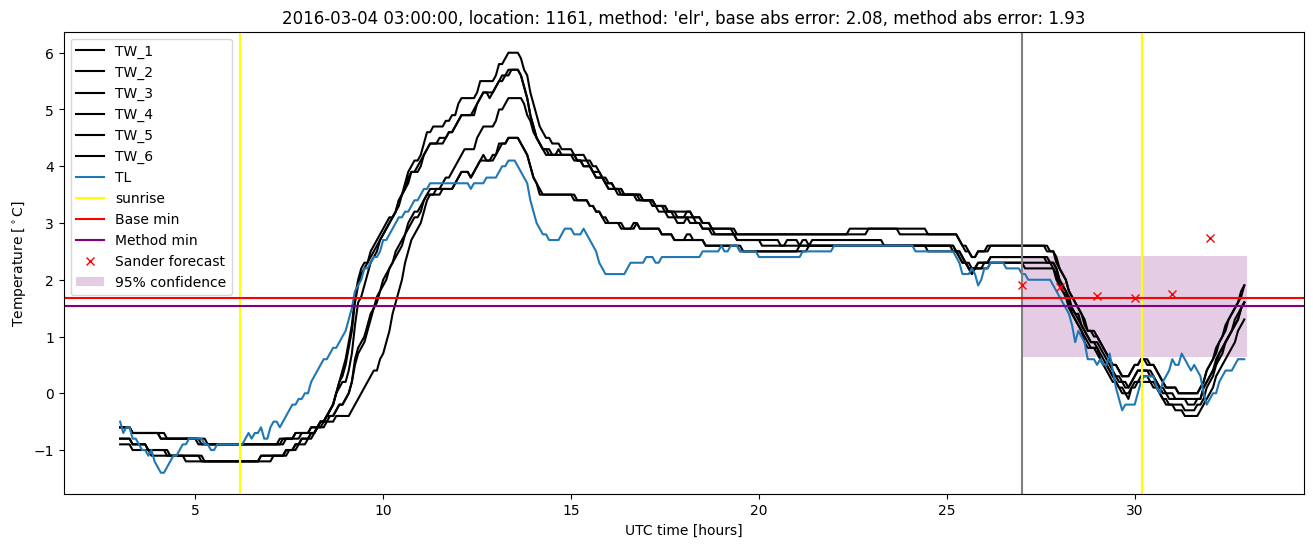
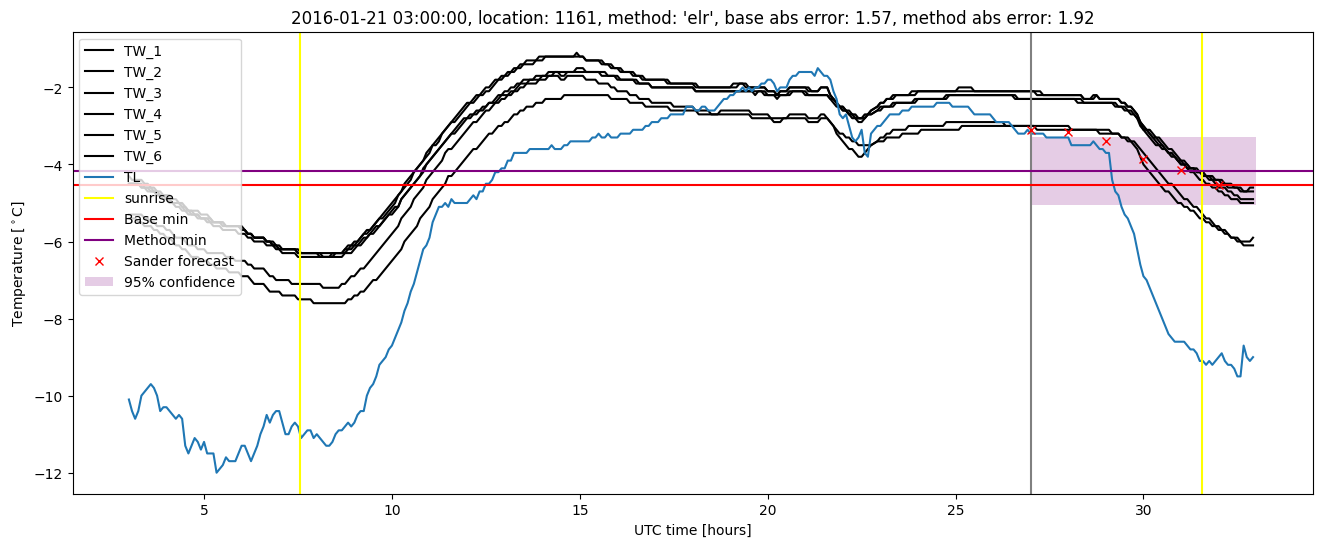
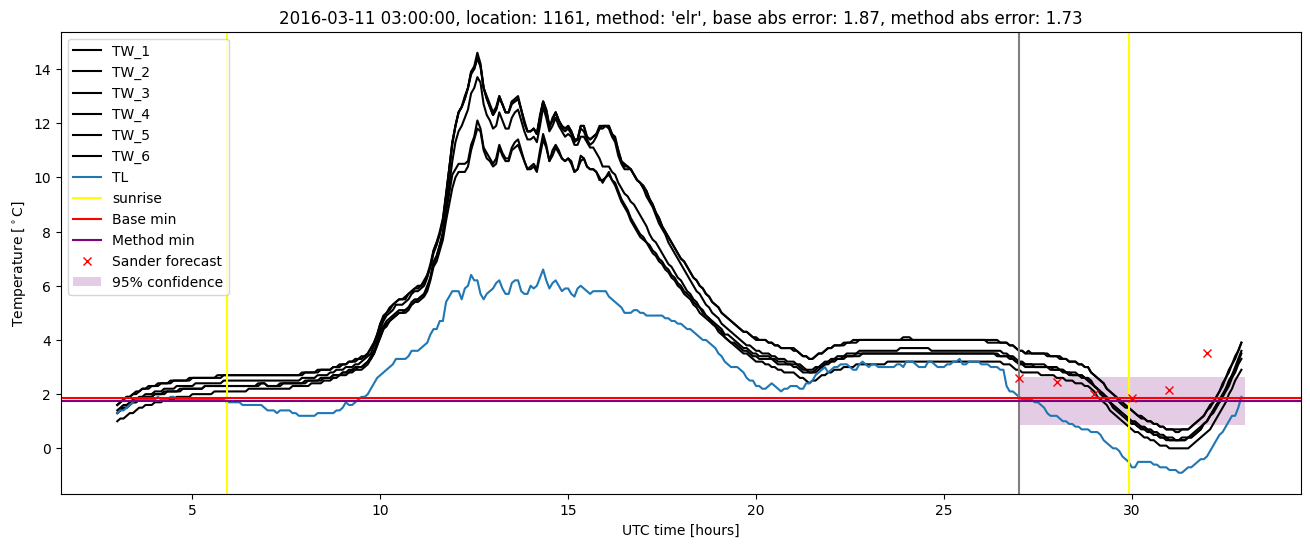
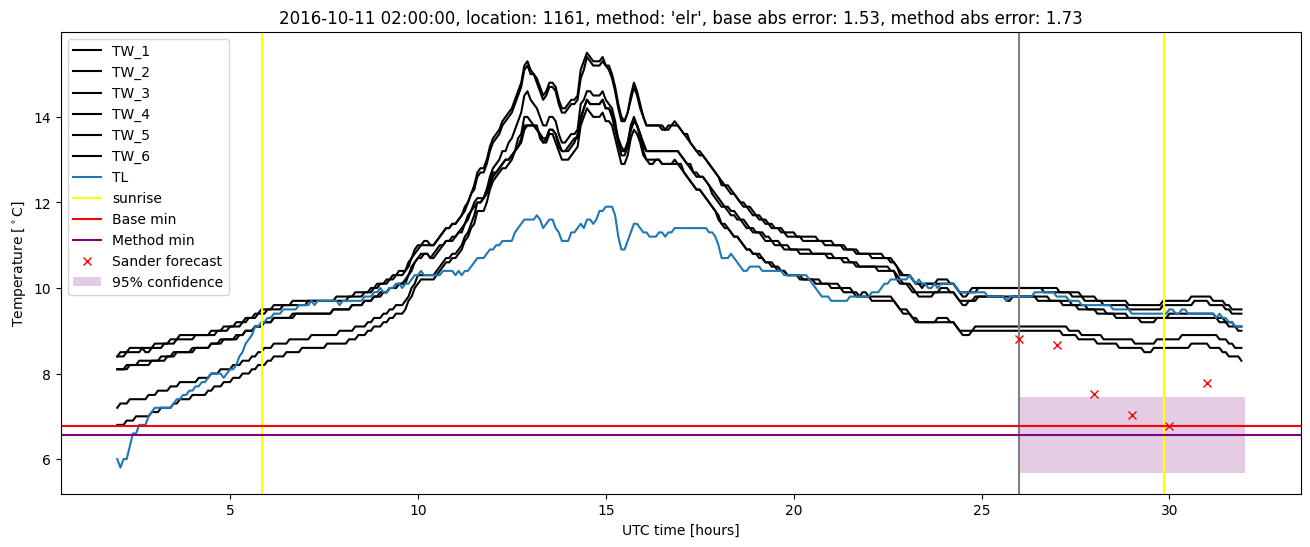
Extended logistic regression plots