GMS location: 1160
Random forest results
| names |
period |
power |
significance |
meanSquareError |
absError |
maxError |
CRPS |
IGN |
| baseline |
winter 2016 |
1.000 |
0.088 |
0.343 |
0.414 |
2.309 |
NaN |
NaN |
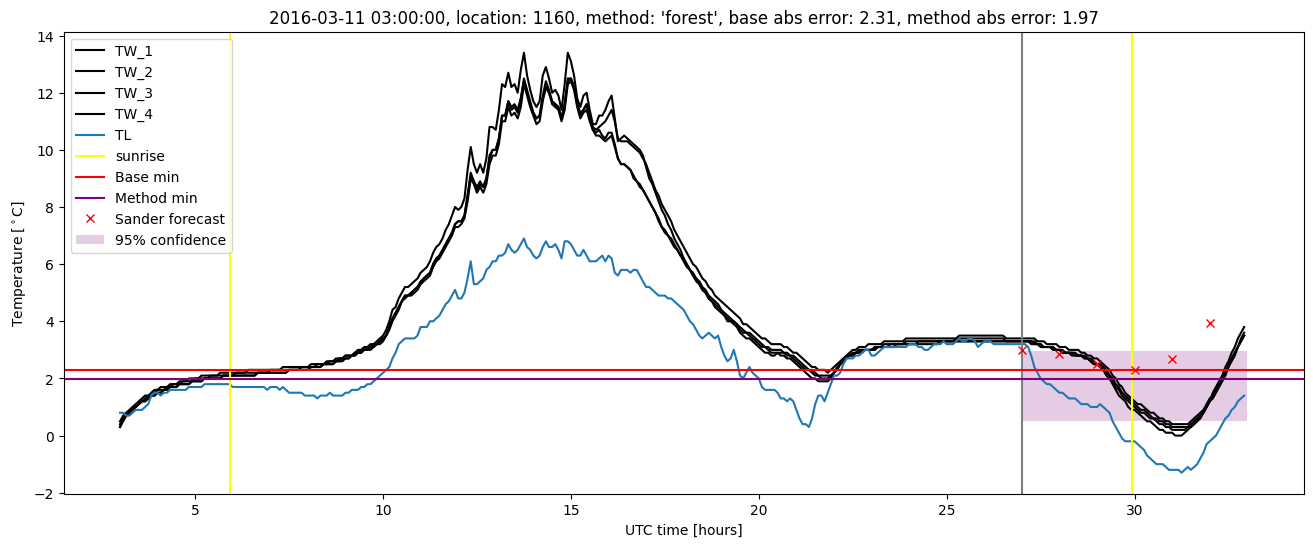
| forest |
winter 2016 |
1.000 |
0.088 |
0.314 |
0.417 |
1.966 |
0.560 |
3.075 |
| baseline |
winter 2017 |
0.981 |
0.048 |
0.510 |
0.518 |
2.301 |
NaN |
NaN |
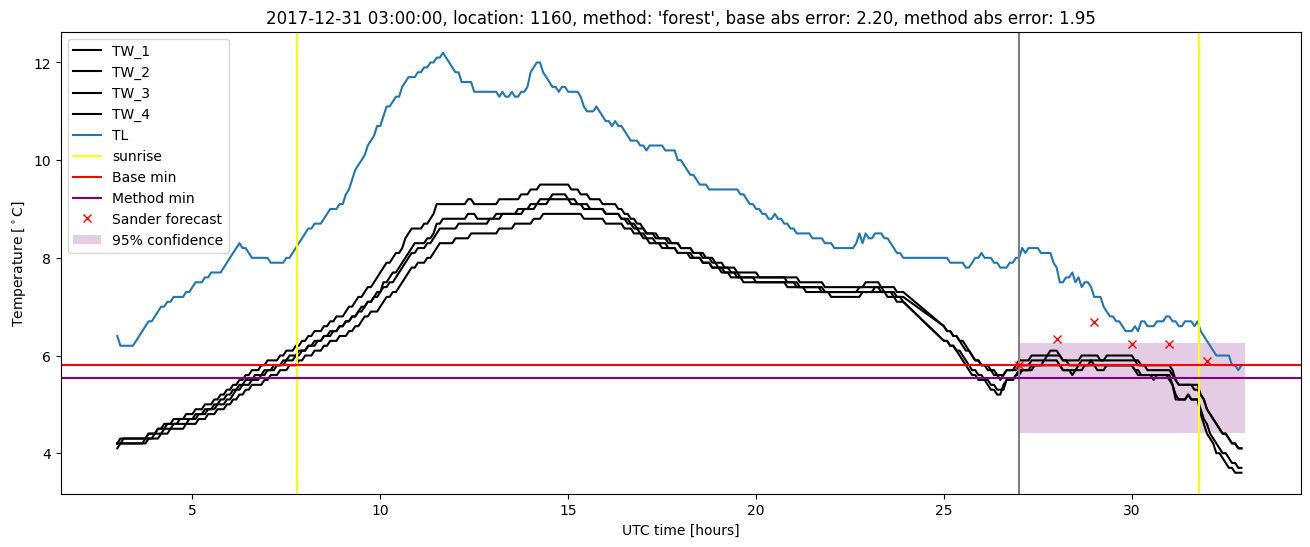
| forest |
winter 2017 |
0.971 |
0.024 |
0.413 |
0.467 |
2.079 |
0.541 |
3.554 |
| baseline |
winter 2018 |
0.985 |
0.109 |
0.468 |
0.477 |
2.318 |
NaN |
NaN |
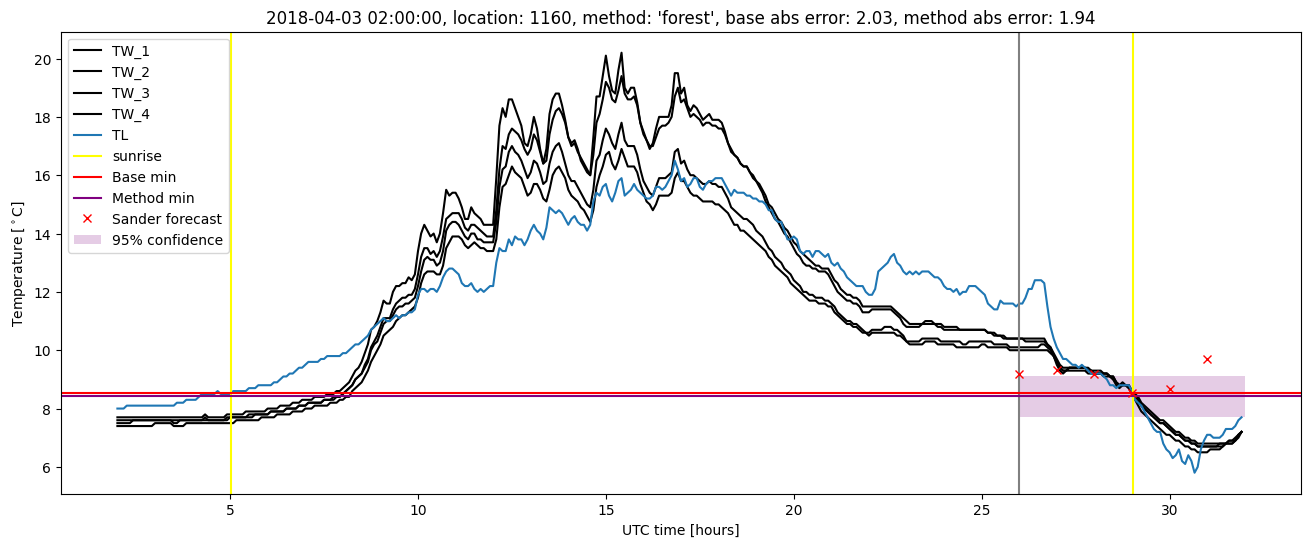
| forest |
winter 2018 |
0.978 |
0.109 |
0.392 |
0.468 |
1.950 |
0.555 |
3.163 |
| baseline |
winter 2019 |
0.986 |
0.000e+00 |
0.394 |
0.411 |
2.099 |
NaN |
NaN |
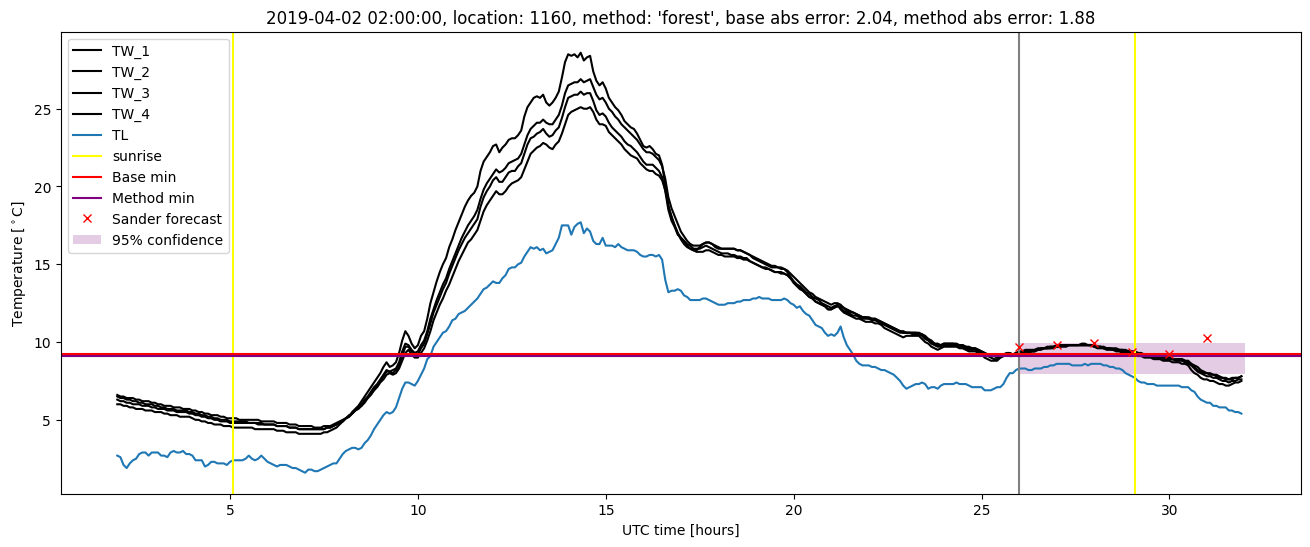
| forest |
winter 2019 |
0.993 |
0.000e+00 |
0.304 |
0.394 |
1.879 |
0.557 |
3.491 |
| baseline |
all |
0.989 |
0.072 |
0.424 |
0.453 |
2.318 |
NaN |
NaN |
| forest |
all |
0.987 |
0.065 |
0.354 |
0.436 |
2.079 |
0.554 |
3.299 |
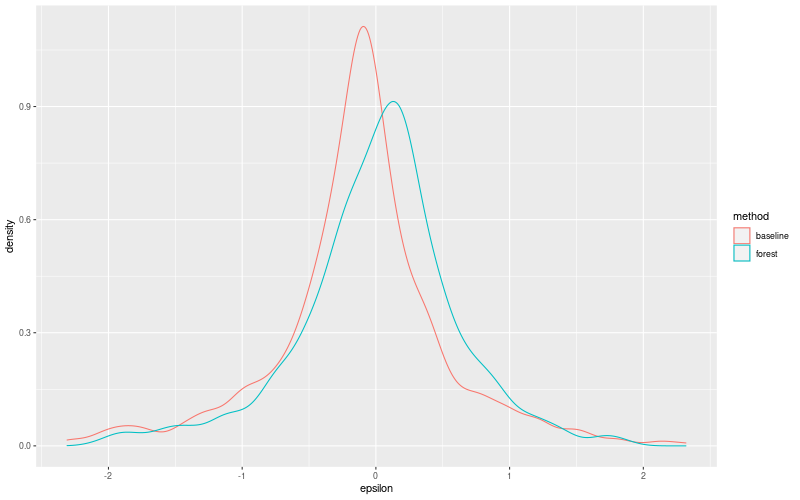
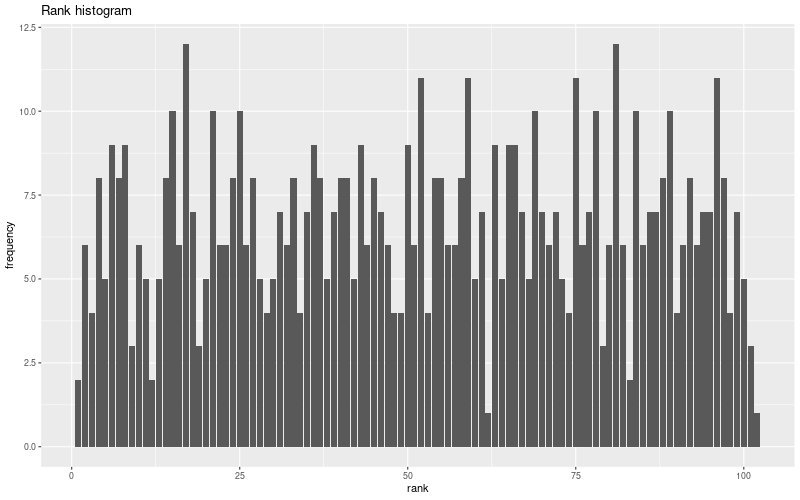
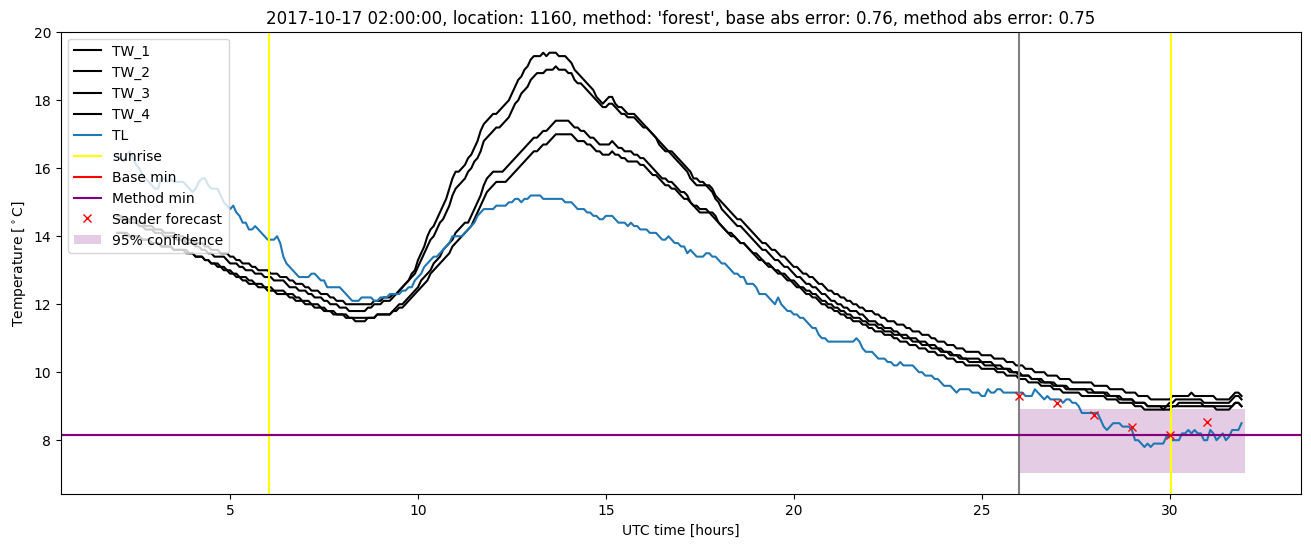
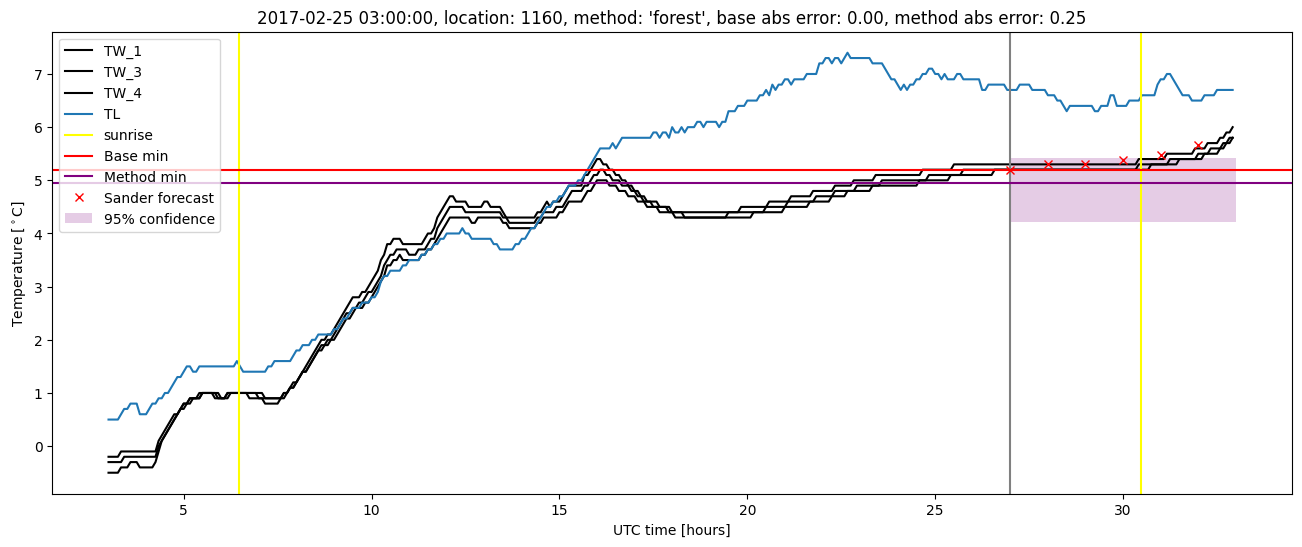
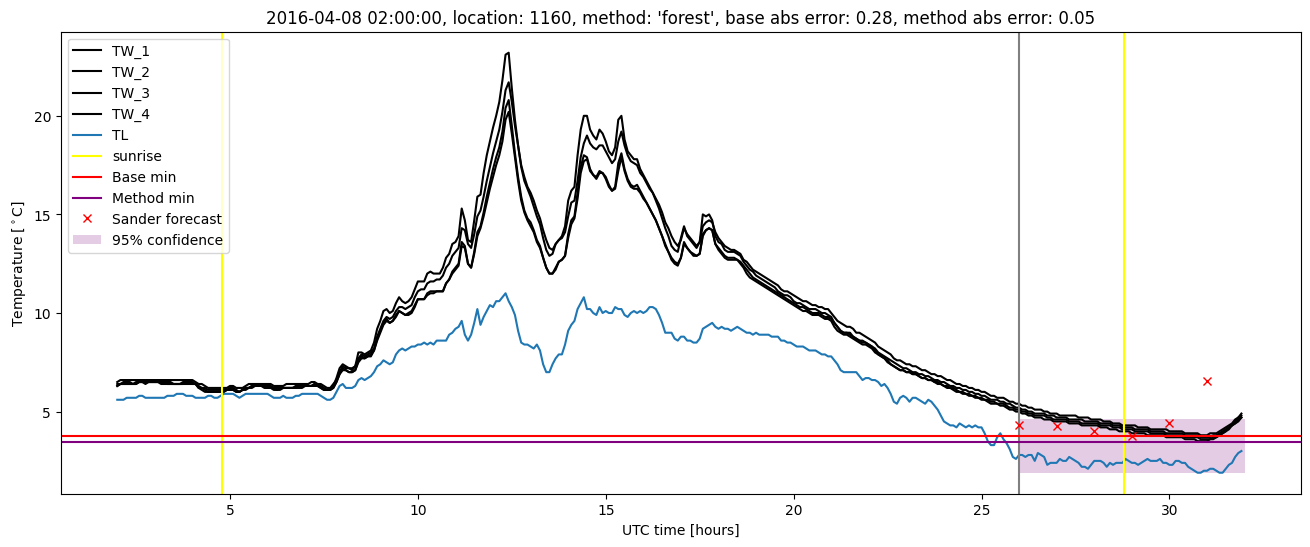
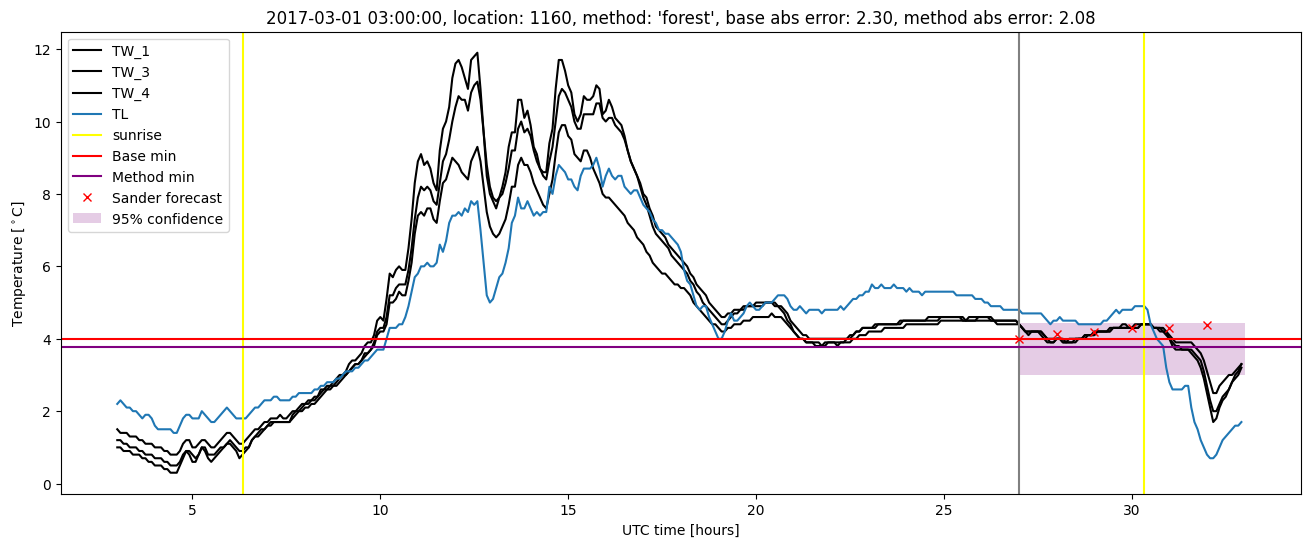
Random forest plots
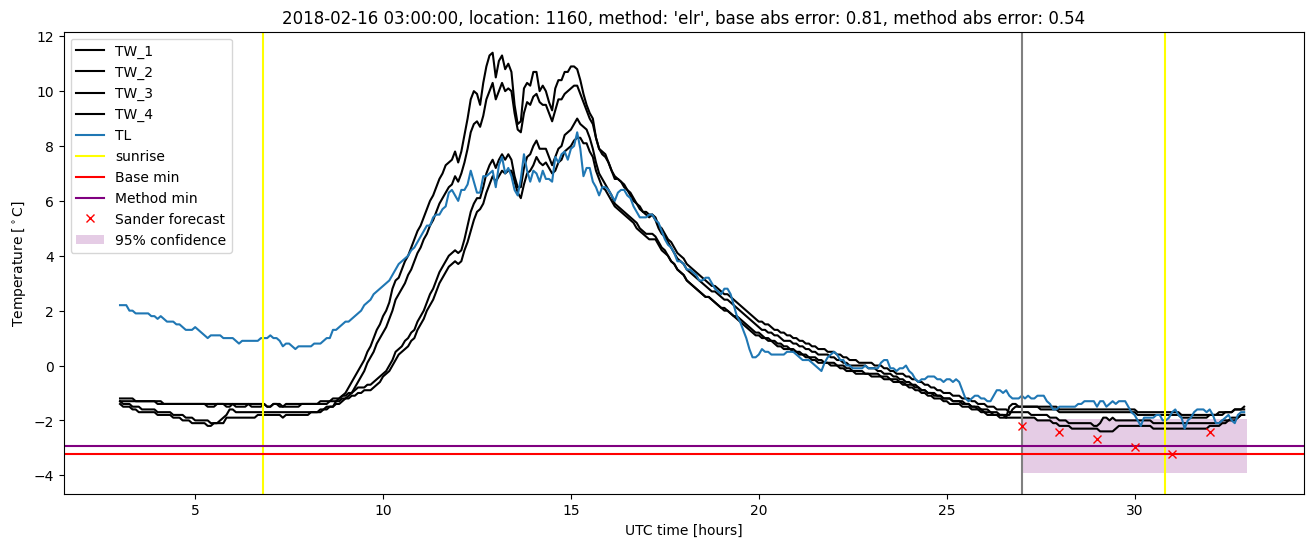
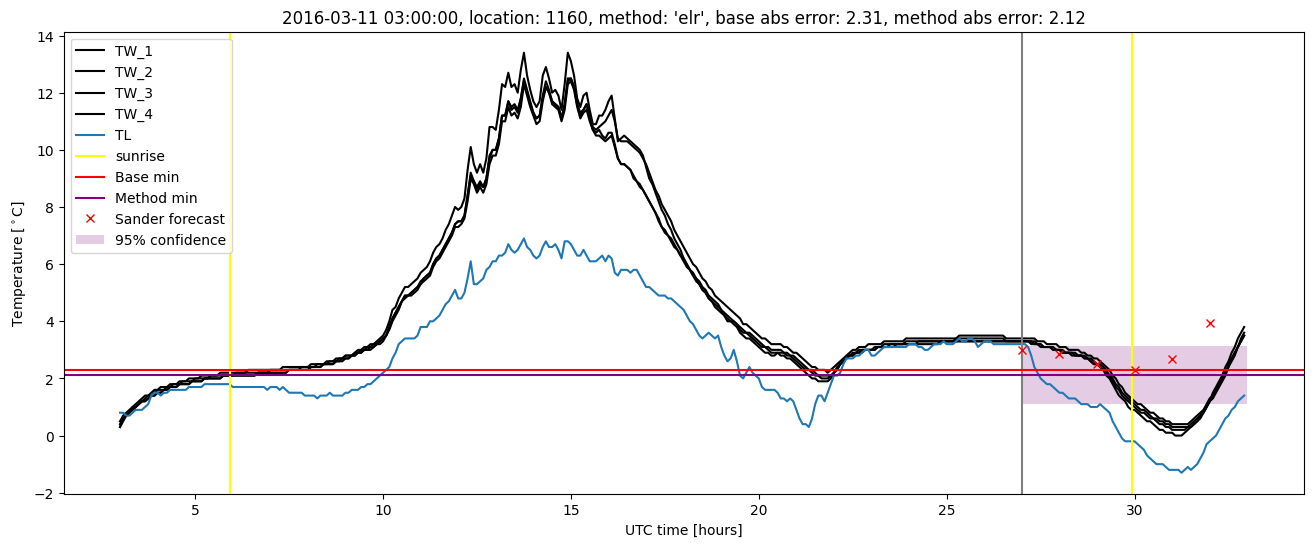
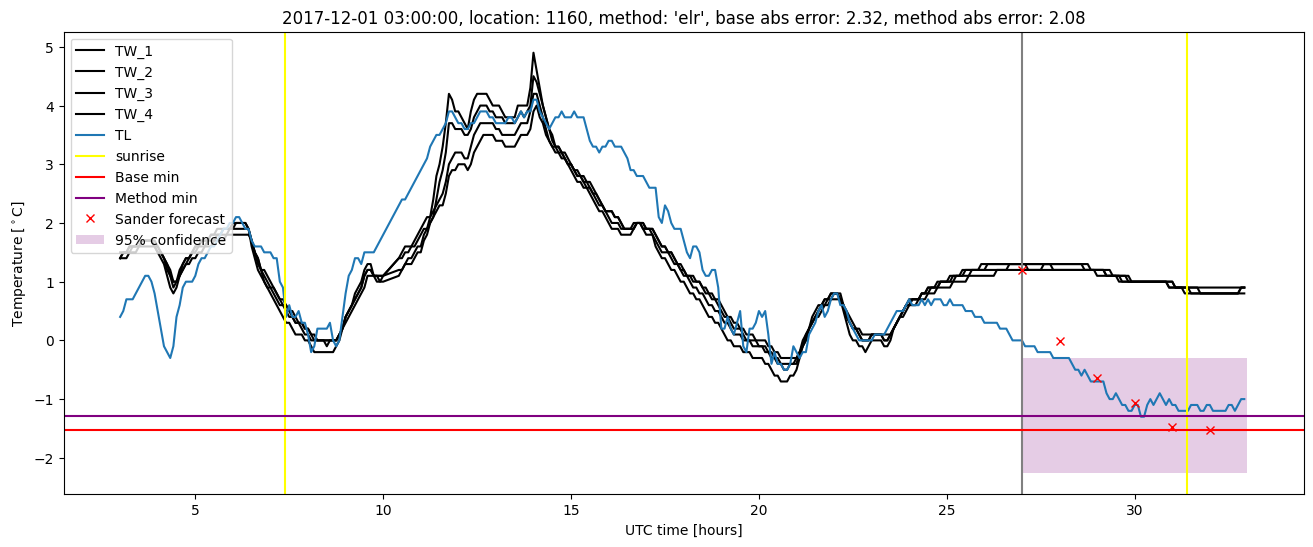
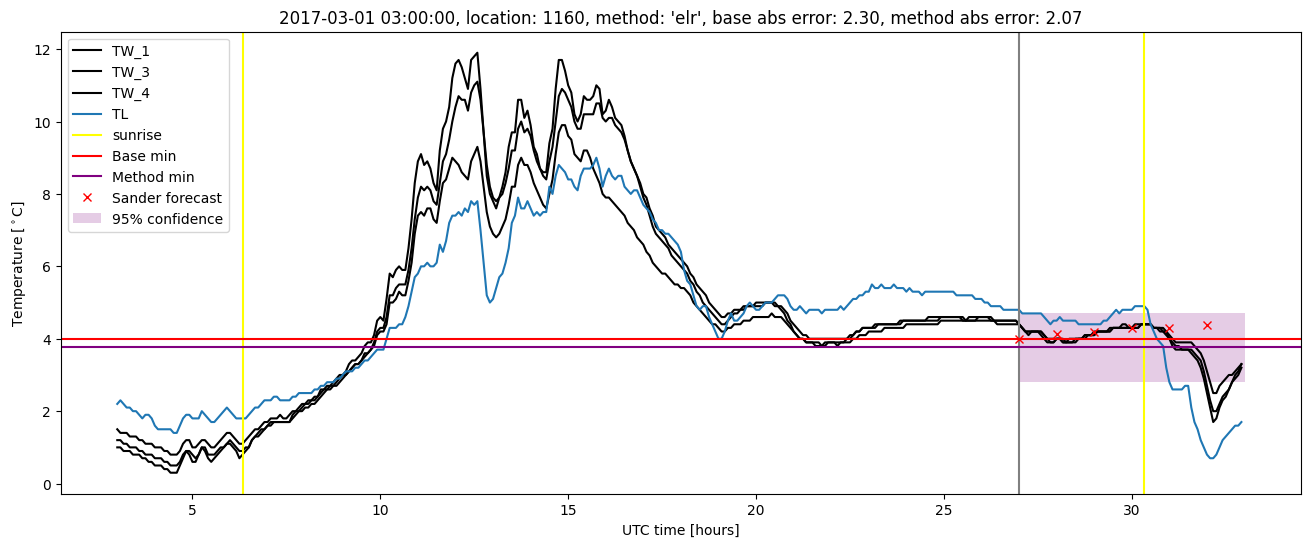
Extended logistic regression results
| names |
period |
power |
significance |
meanSquareError |
absError |
maxError |
CRPS |
IGN |
| baseline |
winter 2016 |
1.000 |
0.088 |
0.343 |
0.414 |
2.309 |
NaN |
NaN |
| elr |
winter 2016 |
0.994 |
0.088 |
0.322 |
0.433 |
2.118 |
0.630 |
3.542 |
| baseline |
winter 2017 |
0.981 |
0.048 |
0.510 |
0.518 |
2.301 |
NaN |
NaN |
| elr |
winter 2017 |
0.962 |
0.024 |
0.445 |
0.494 |
2.068 |
0.582 |
3.659 |
| baseline |
winter 2018 |
0.985 |
0.109 |
0.468 |
0.477 |
2.318 |
NaN |
NaN |
| elr |
winter 2018 |
0.978 |
0.130 |
0.436 |
0.492 |
2.082 |
0.609 |
3.734 |
| baseline |
winter 2019 |
0.986 |
0.000e+00 |
0.394 |
0.411 |
2.099 |
NaN |
NaN |
| elr |
winter 2019 |
0.986 |
0.000e+00 |
0.375 |
0.457 |
2.008 |
0.599 |
3.347 |
| baseline |
all |
0.989 |
0.072 |
0.424 |
0.453 |
2.318 |
NaN |
NaN |
| elr |
all |
0.981 |
0.072 |
0.392 |
0.468 |
2.118 |
0.607 |
3.574 |
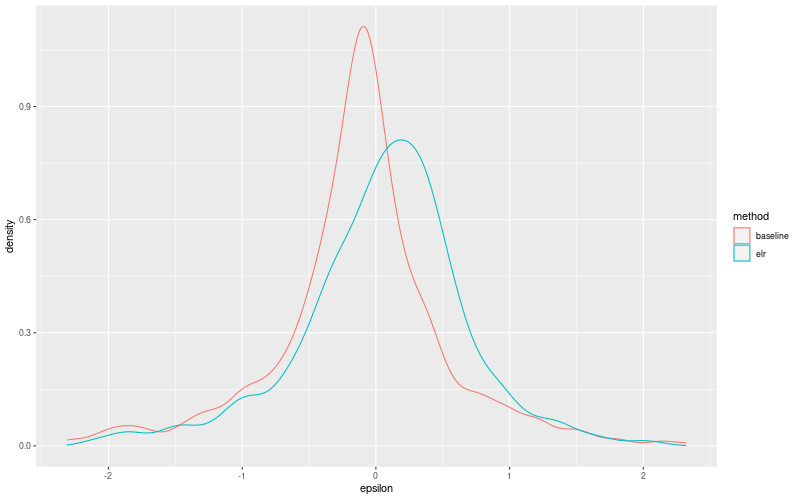
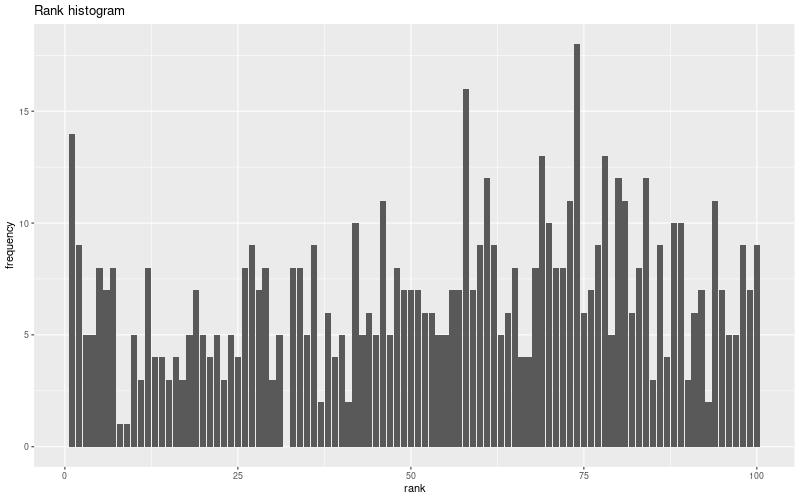
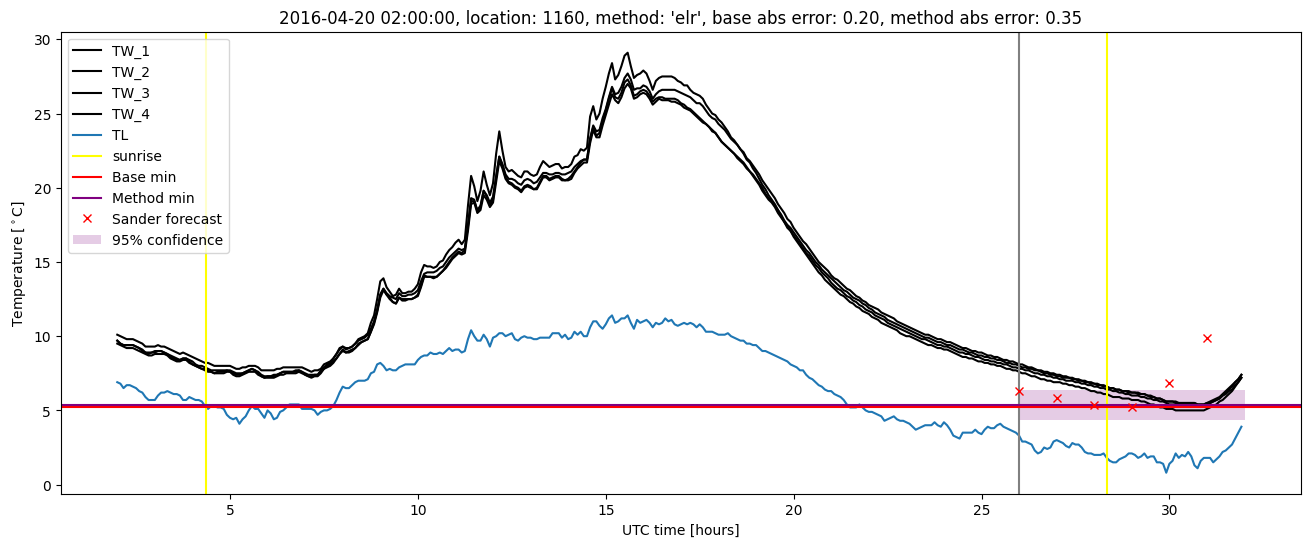
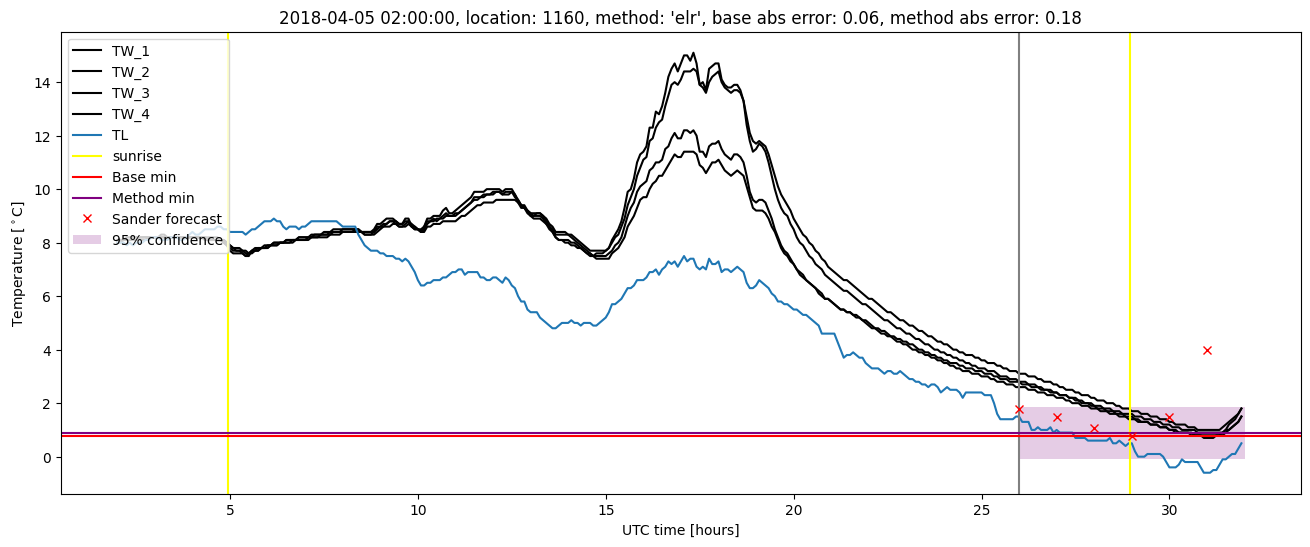
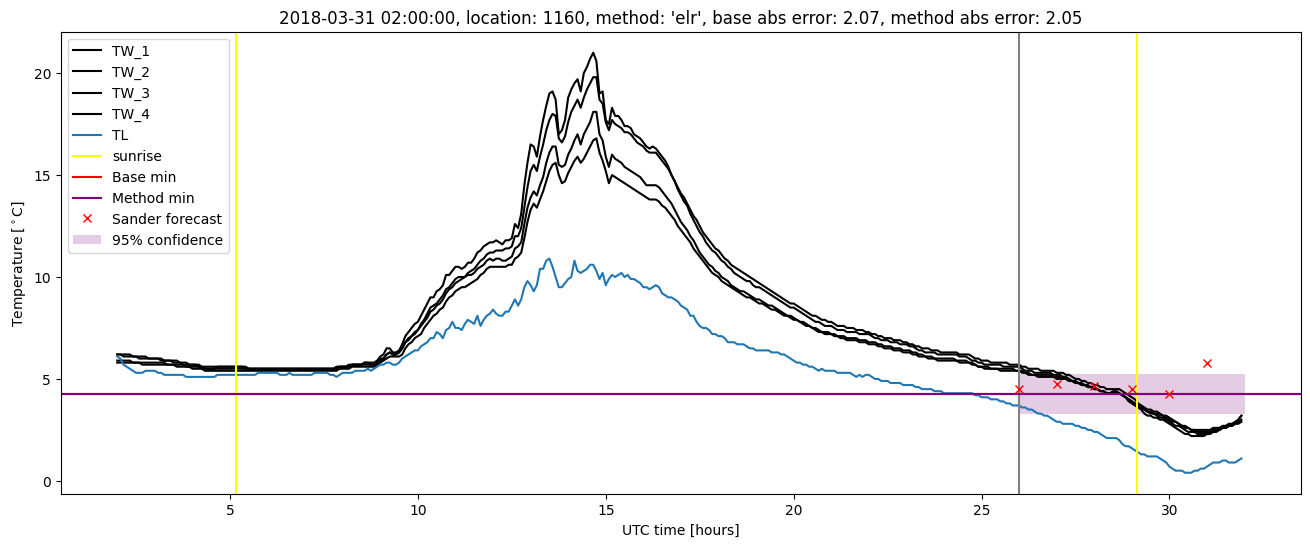
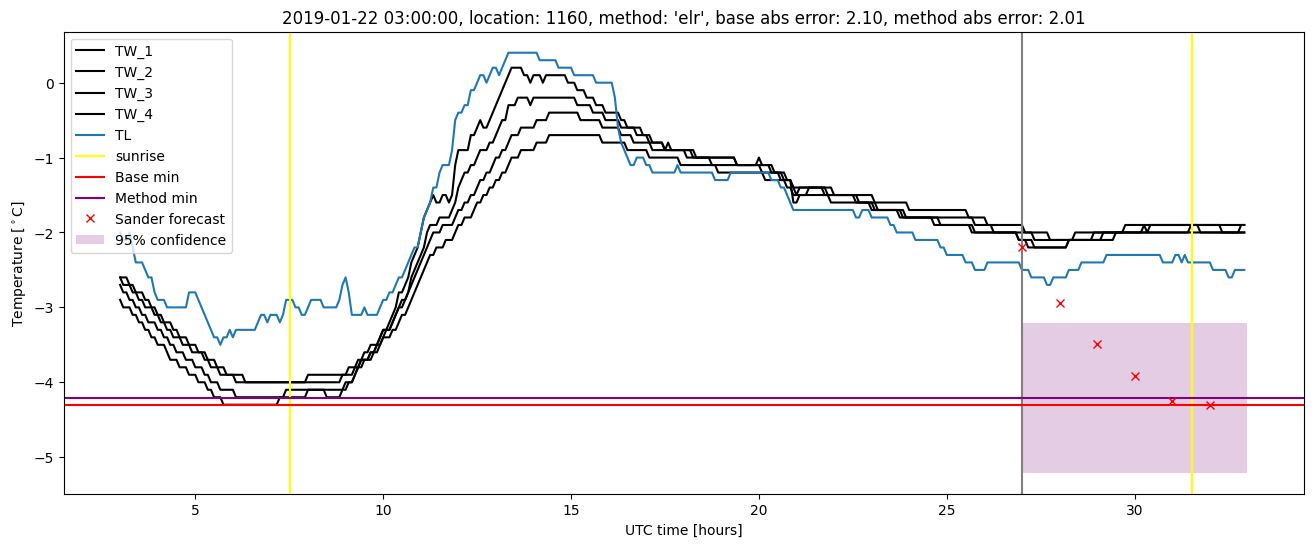
Extended logistic regression plots