GMS location: 1159
Random forest results
| names |
period |
power |
significance |
meanSquareError |
absError |
maxError |
CRPS |
IGN |
| baseline |
winter 2016 |
1.000 |
0.030 |
0.329 |
0.415 |
2.633 |
NaN |
NaN |
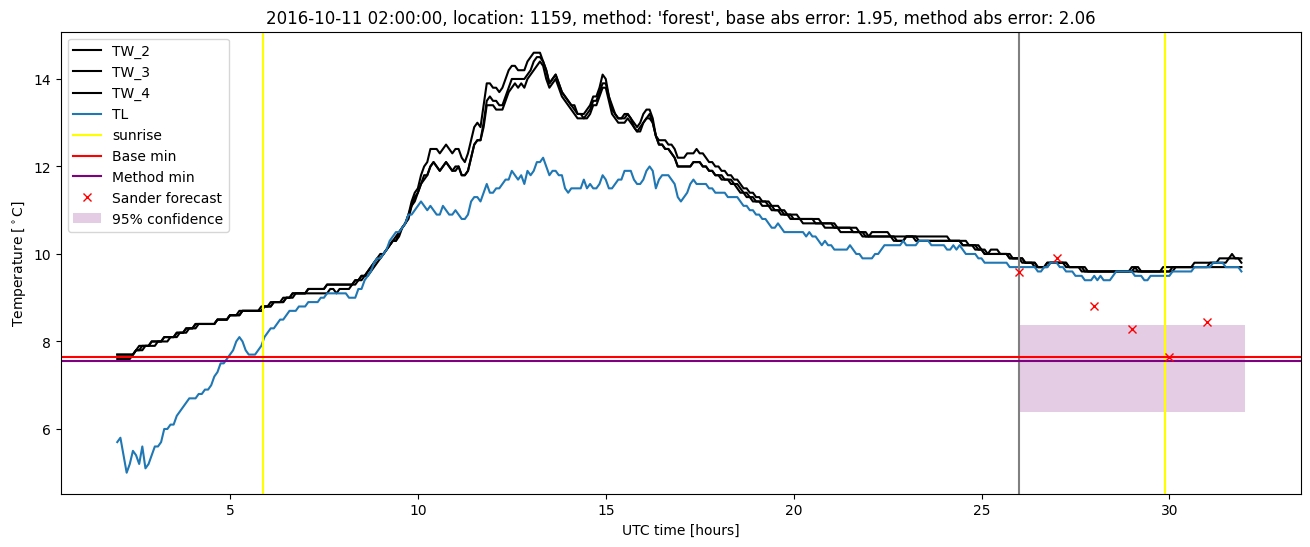
| forest |
winter 2016 |
0.994 |
0.030 |
0.279 |
0.385 |
2.273 |
0.535 |
4.244 |
| baseline |
winter 2017 |
0.975 |
0.000e+00 |
0.423 |
0.458 |
2.114 |
NaN |
NaN |
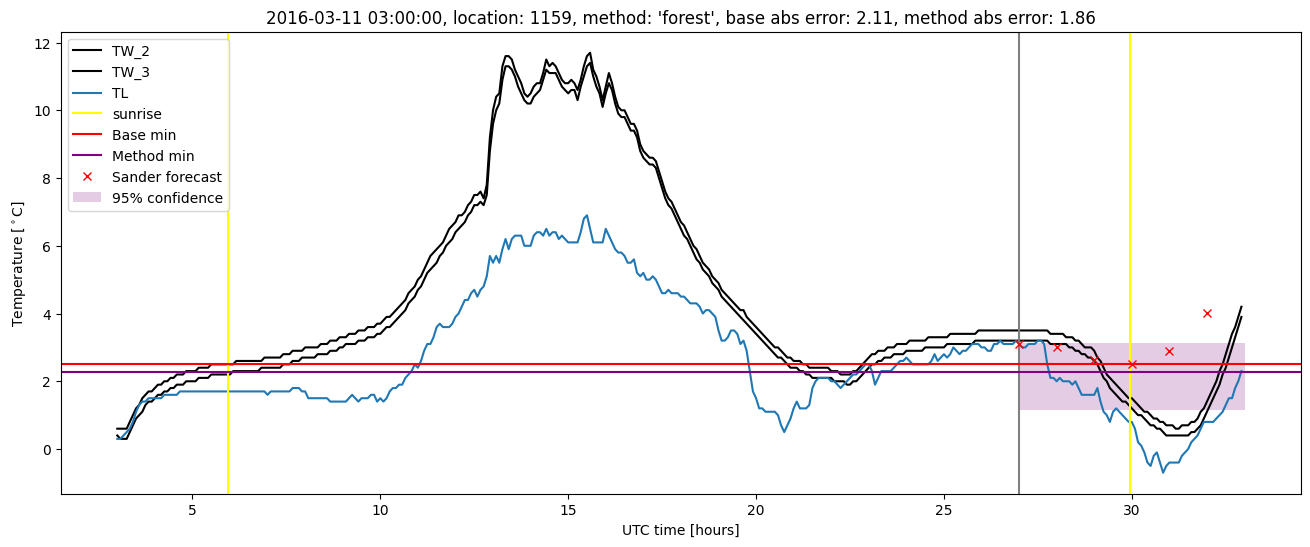
| forest |
winter 2017 |
0.966 |
0.029 |
0.333 |
0.415 |
2.056 |
0.526 |
4.429 |
| baseline |
winter 2018 |
0.985 |
0.135 |
0.322 |
0.411 |
1.849 |
NaN |
NaN |
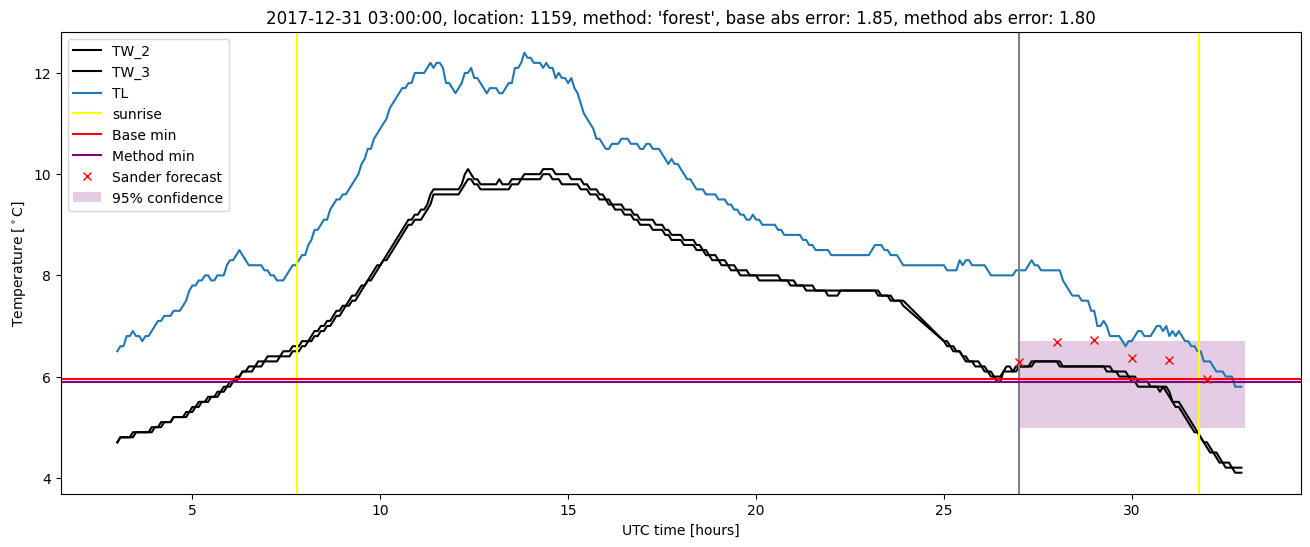
| forest |
winter 2018 |
0.985 |
0.162 |
0.268 |
0.397 |
1.802 |
0.519 |
3.635 |
| baseline |
winter 2019 |
0.993 |
0.000e+00 |
0.369 |
0.418 |
2.403 |
NaN |
NaN |
| forest |
winter 2019 |
0.993 |
0.000e+00 |
0.271 |
0.371 |
2.330 |
0.534 |
4.648 |
| baseline |
all |
0.990 |
0.051 |
0.357 |
0.424 |
2.633 |
NaN |
NaN |
| forest |
all |
0.986 |
0.068 |
0.286 |
0.392 |
2.330 |
0.529 |
4.225 |
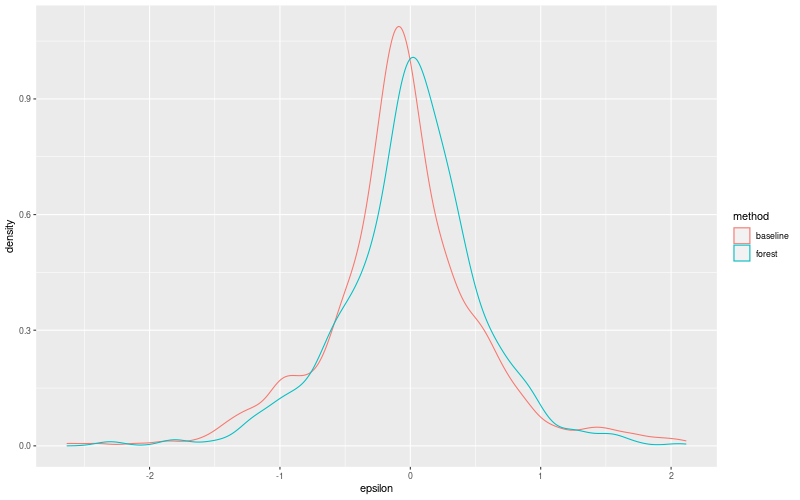
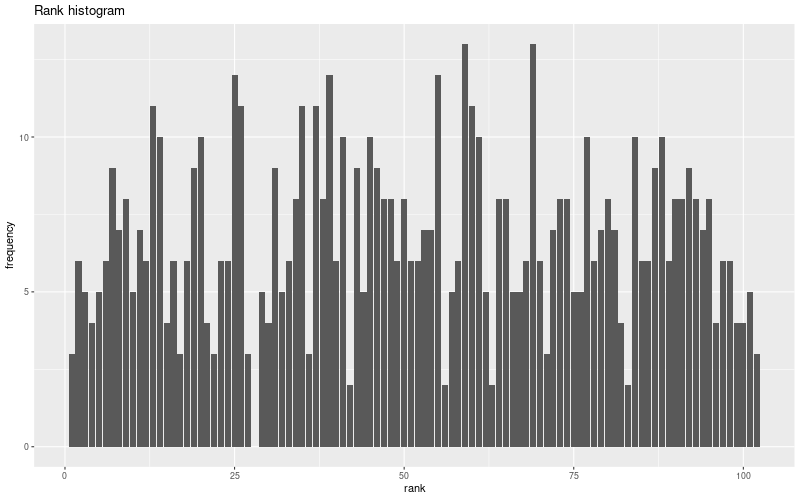
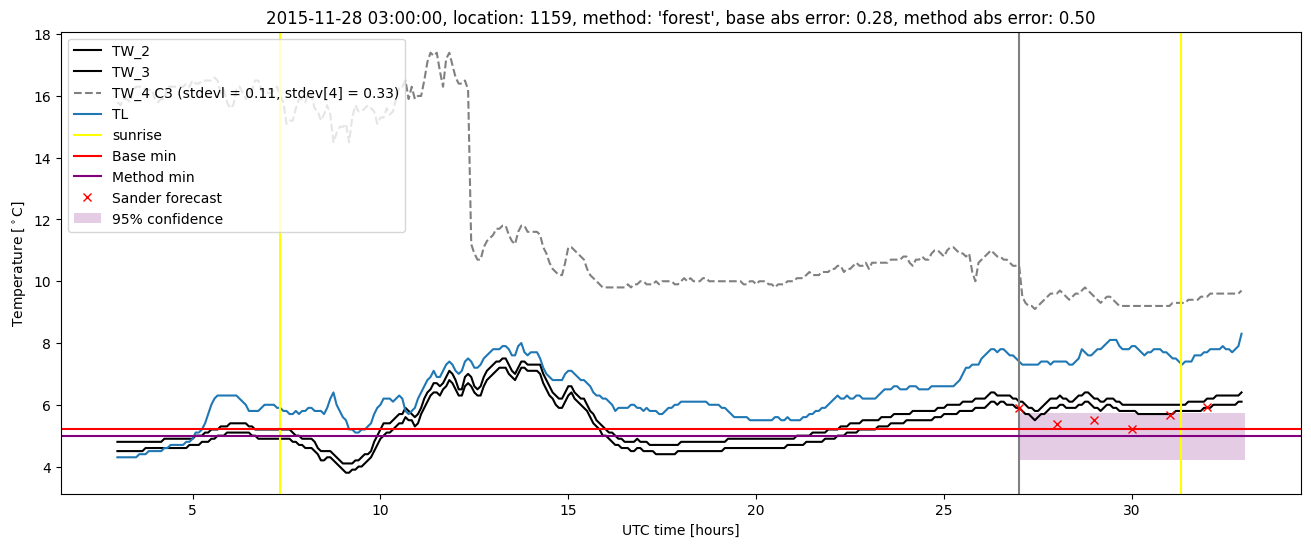
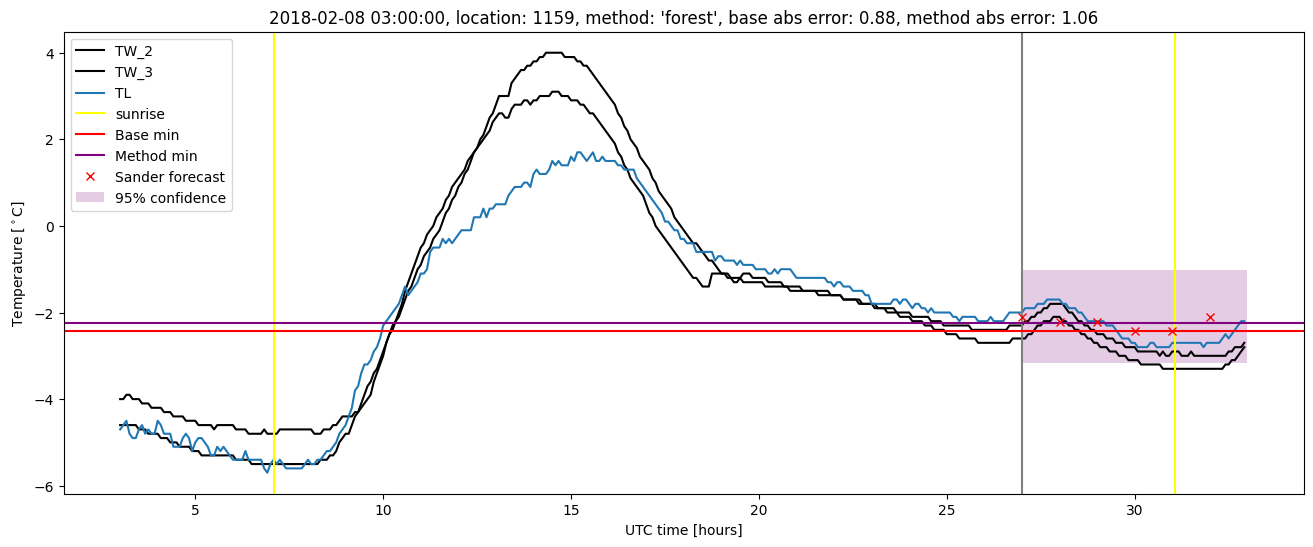
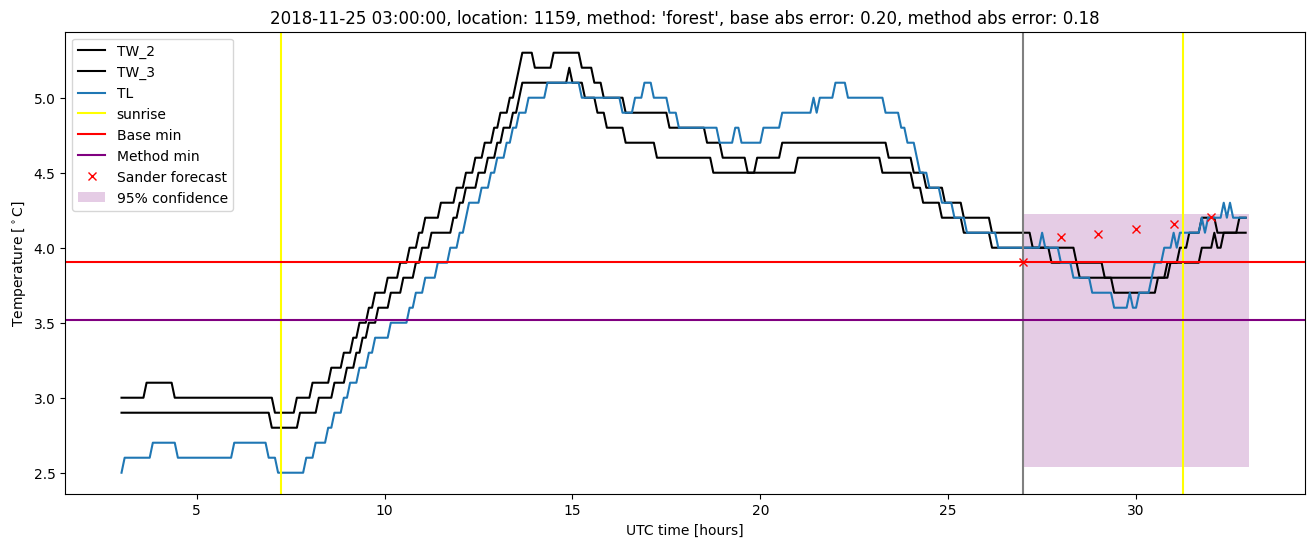
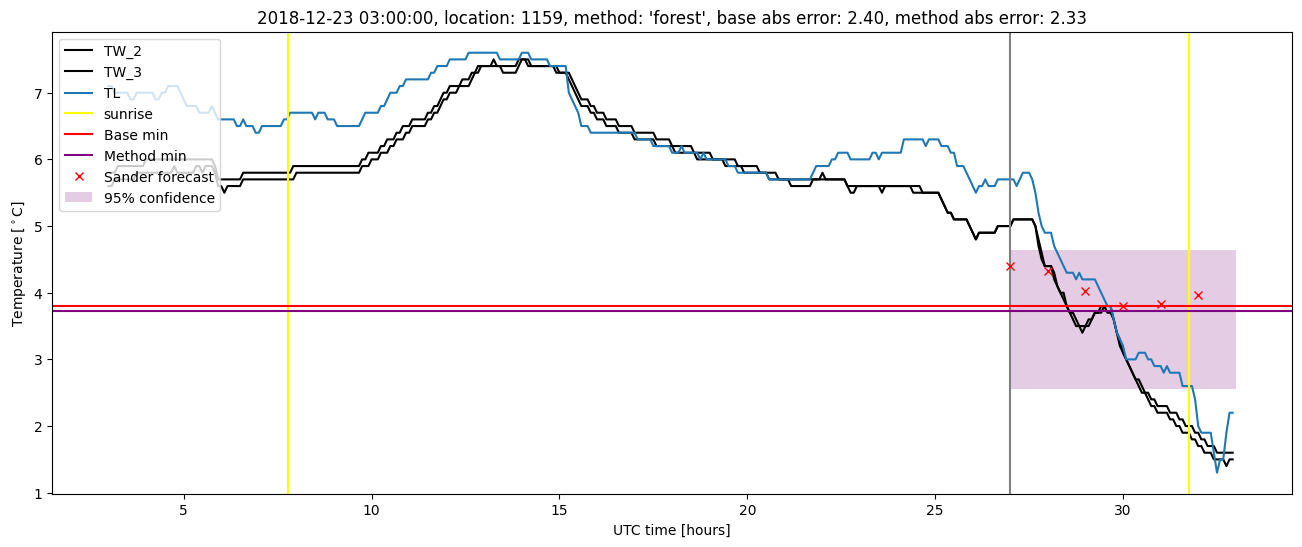
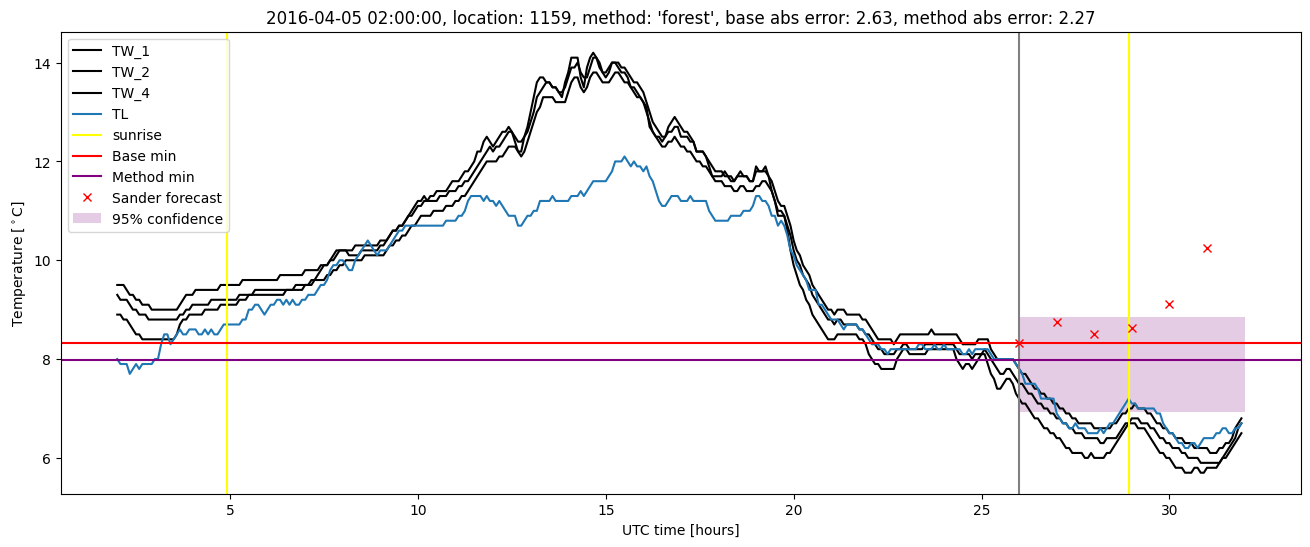
Random forest plots
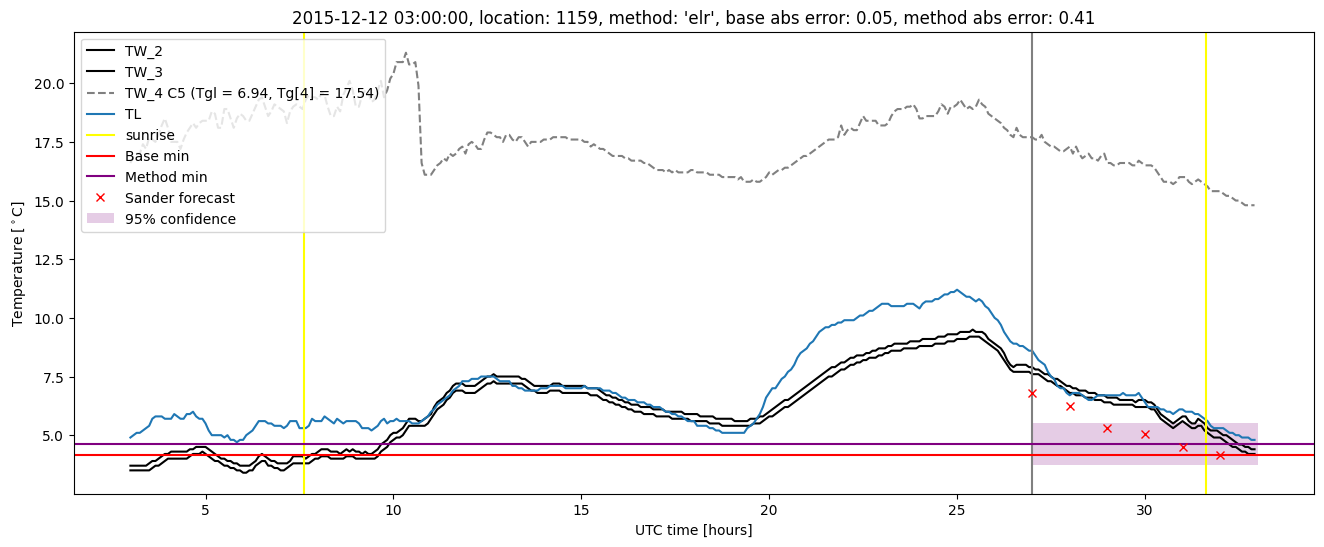
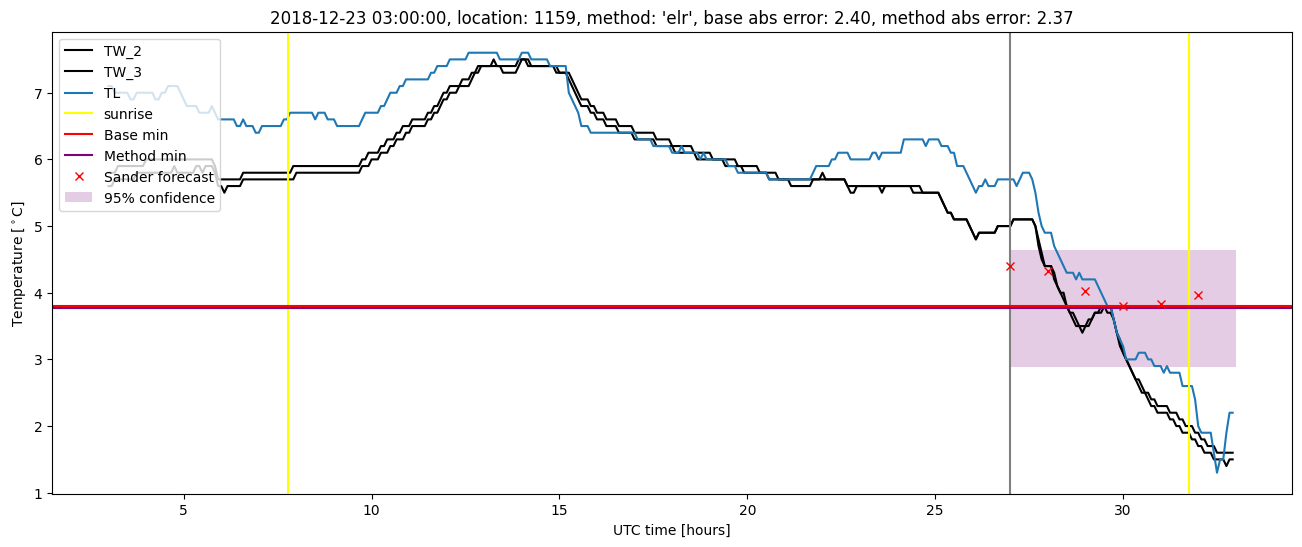
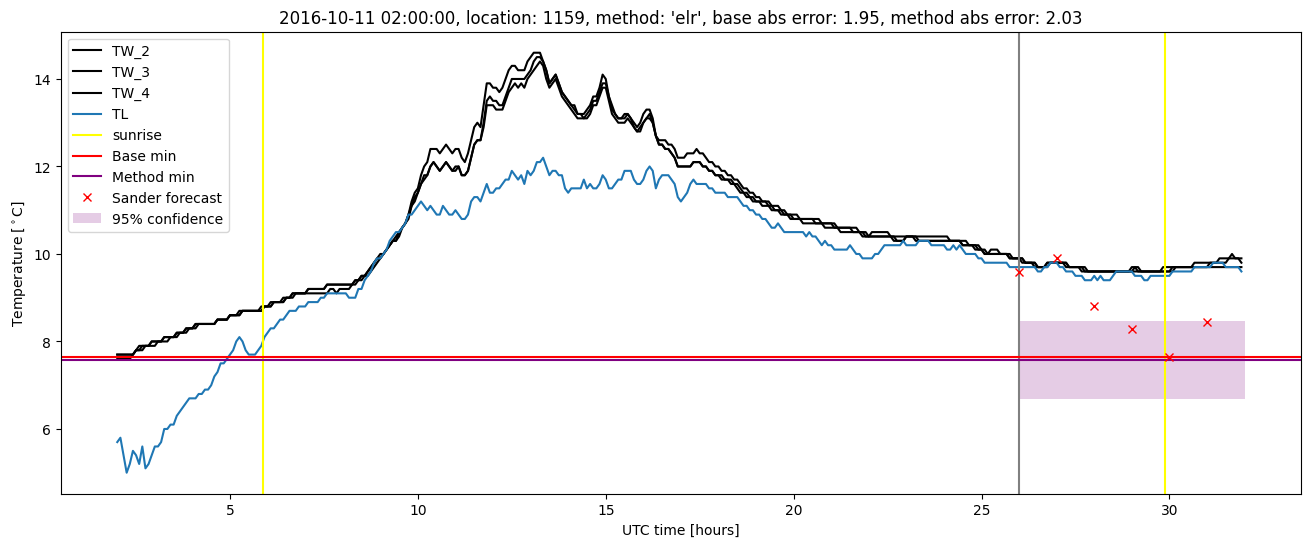
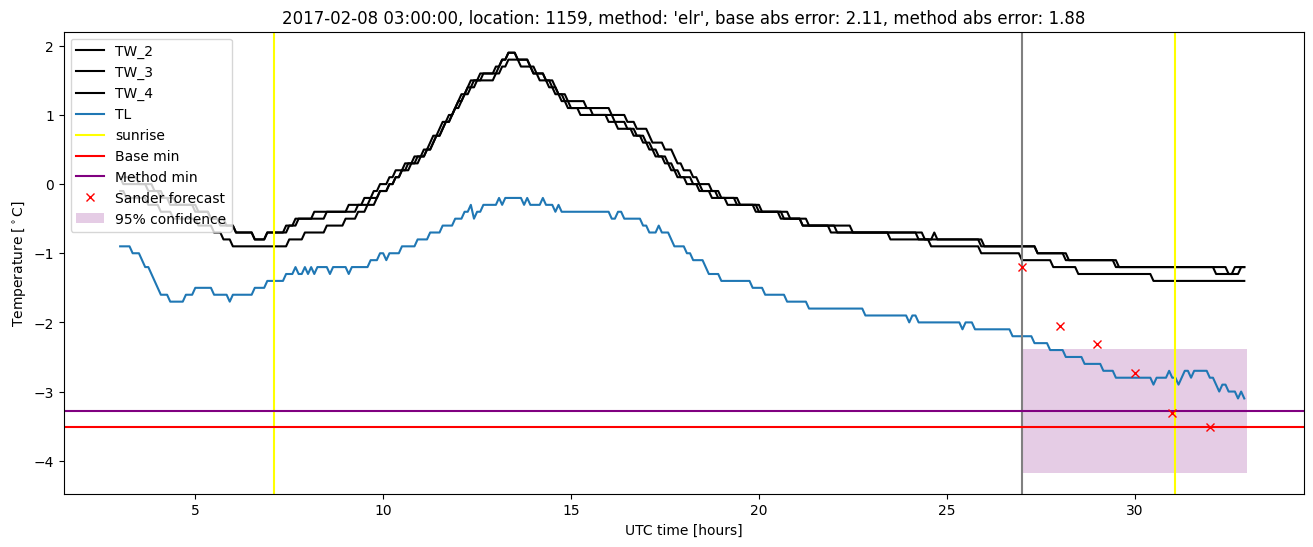
Extended logistic regression results
| names |
period |
power |
significance |
meanSquareError |
absError |
maxError |
CRPS |
IGN |
| baseline |
winter 2016 |
1.000 |
0.030 |
0.329 |
0.415 |
2.633 |
NaN |
NaN |
| elr |
winter 2016 |
0.994 |
0.030 |
0.297 |
0.426 |
2.310 |
0.626 |
5.267 |
| baseline |
winter 2017 |
0.975 |
0.000e+00 |
0.423 |
0.458 |
2.114 |
NaN |
NaN |
| elr |
winter 2017 |
0.941 |
0.029 |
0.361 |
0.442 |
2.032 |
0.581 |
4.634 |
| baseline |
winter 2018 |
0.985 |
0.135 |
0.322 |
0.411 |
1.849 |
NaN |
NaN |
| elr |
winter 2018 |
0.978 |
0.108 |
0.290 |
0.428 |
1.598 |
0.589 |
4.287 |
| baseline |
winter 2019 |
0.993 |
0.000e+00 |
0.369 |
0.418 |
2.403 |
NaN |
NaN |
| elr |
winter 2019 |
0.993 |
0.000e+00 |
0.280 |
0.391 |
2.367 |
0.559 |
4.504 |
| baseline |
all |
0.990 |
0.051 |
0.357 |
0.424 |
2.633 |
NaN |
NaN |
| elr |
all |
0.979 |
0.051 |
0.306 |
0.422 |
2.367 |
0.591 |
4.707 |
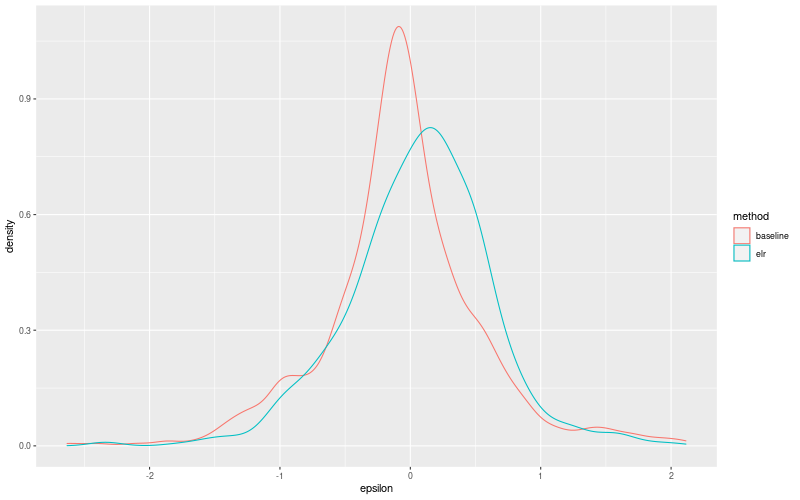
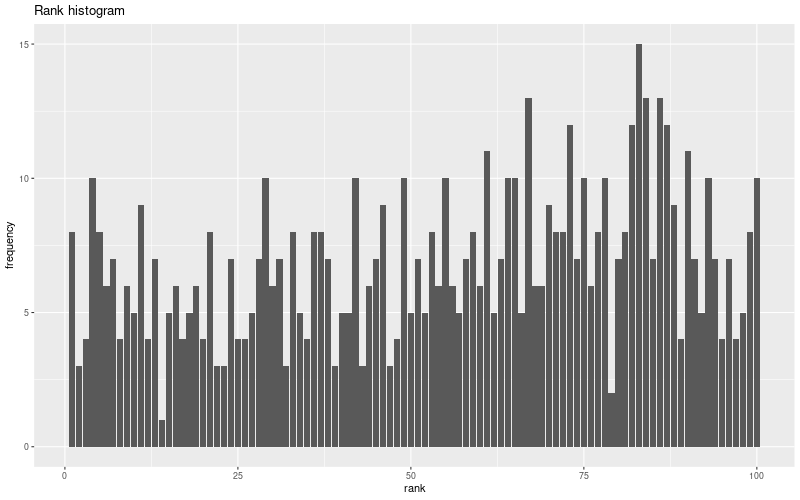
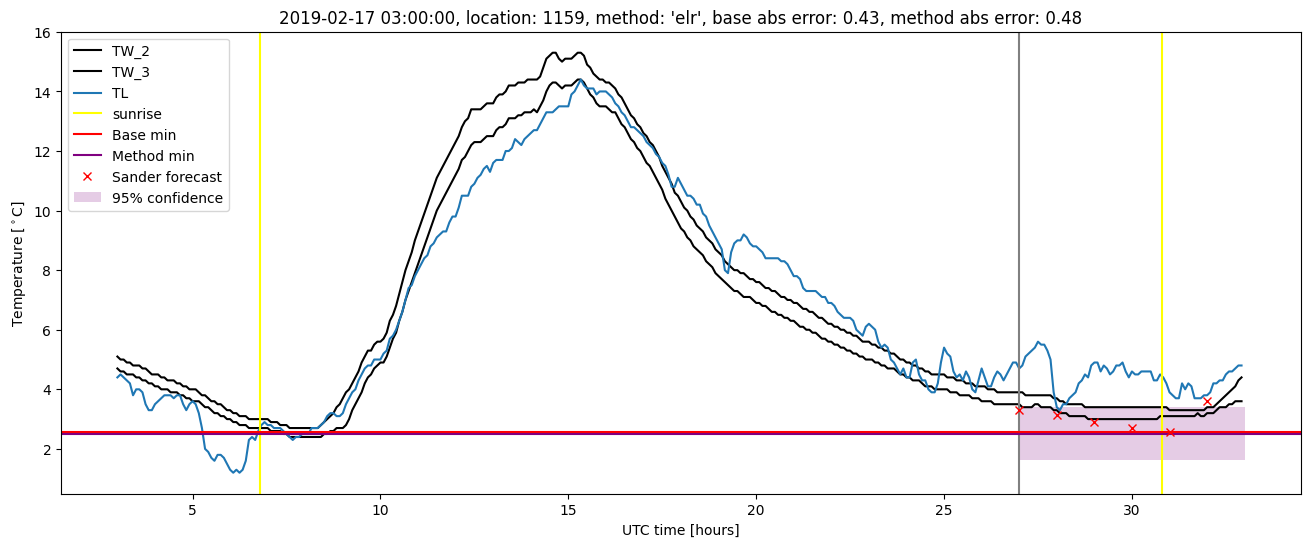
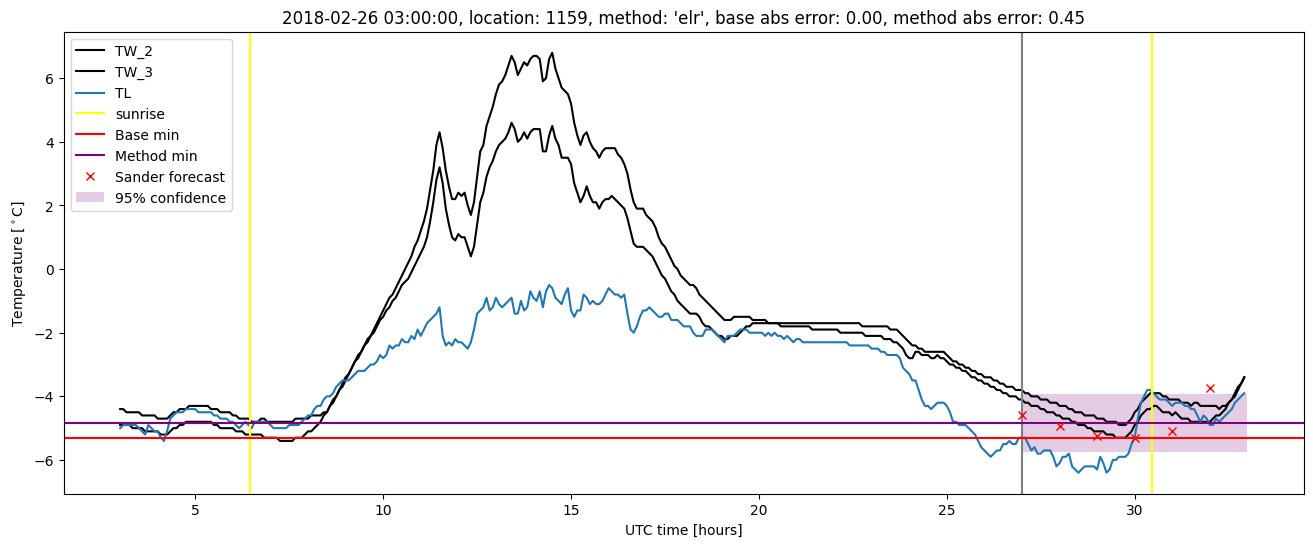
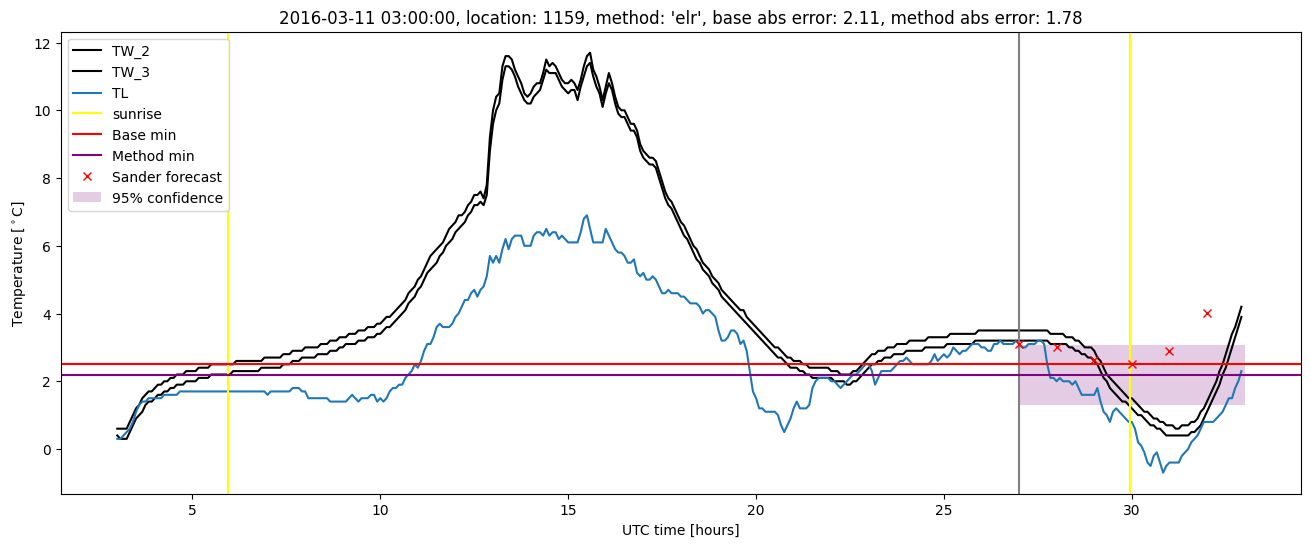
Extended logistic regression plots