GMS location: 1158
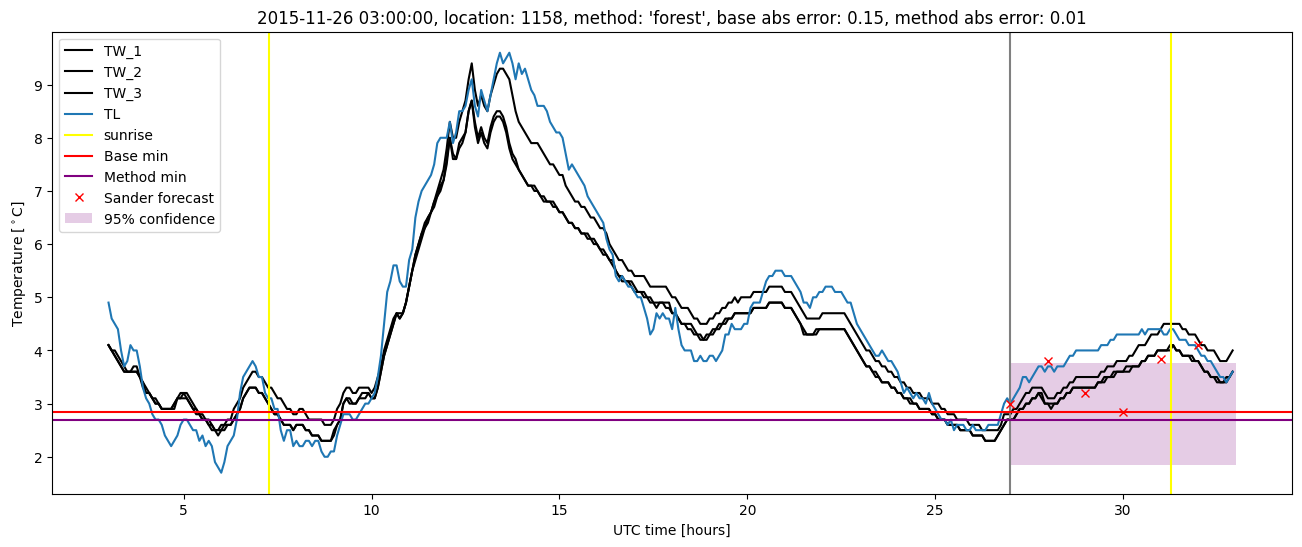
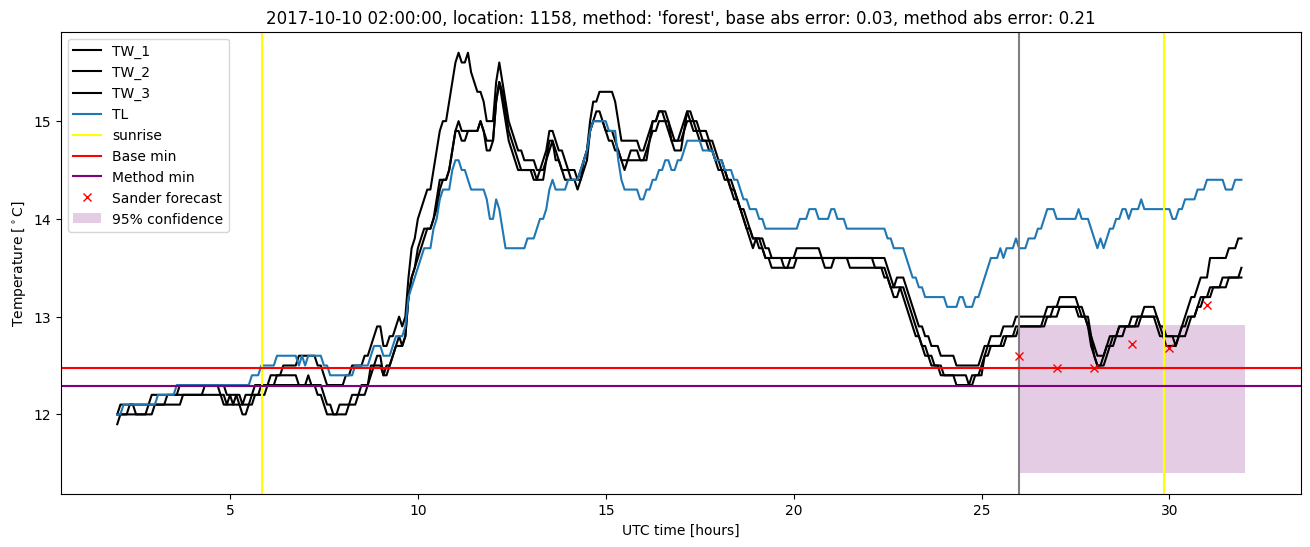
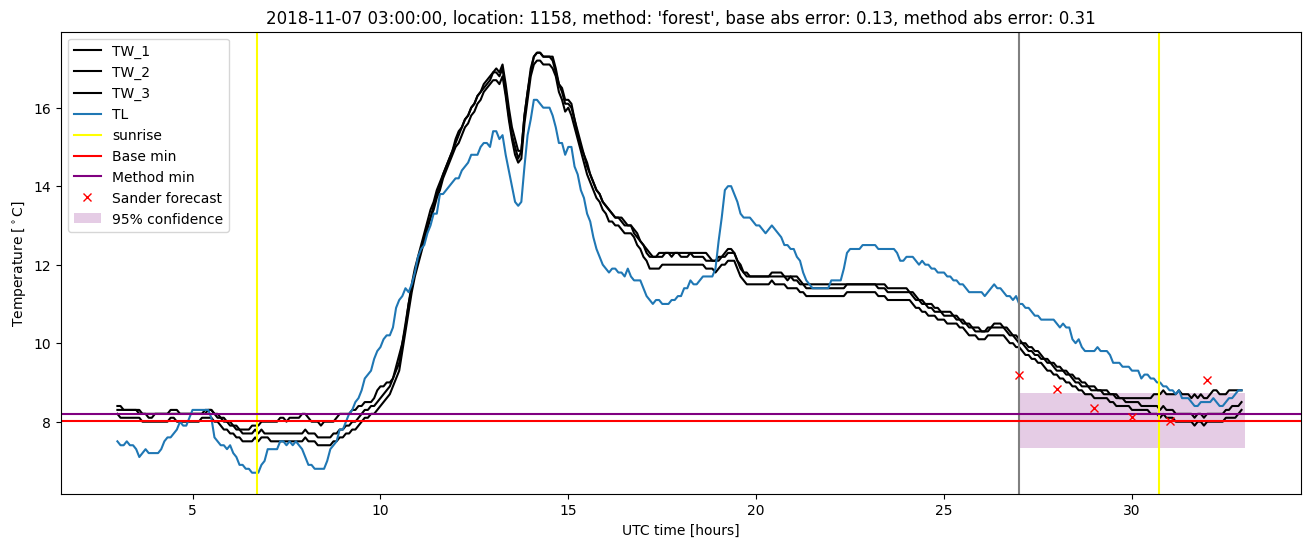
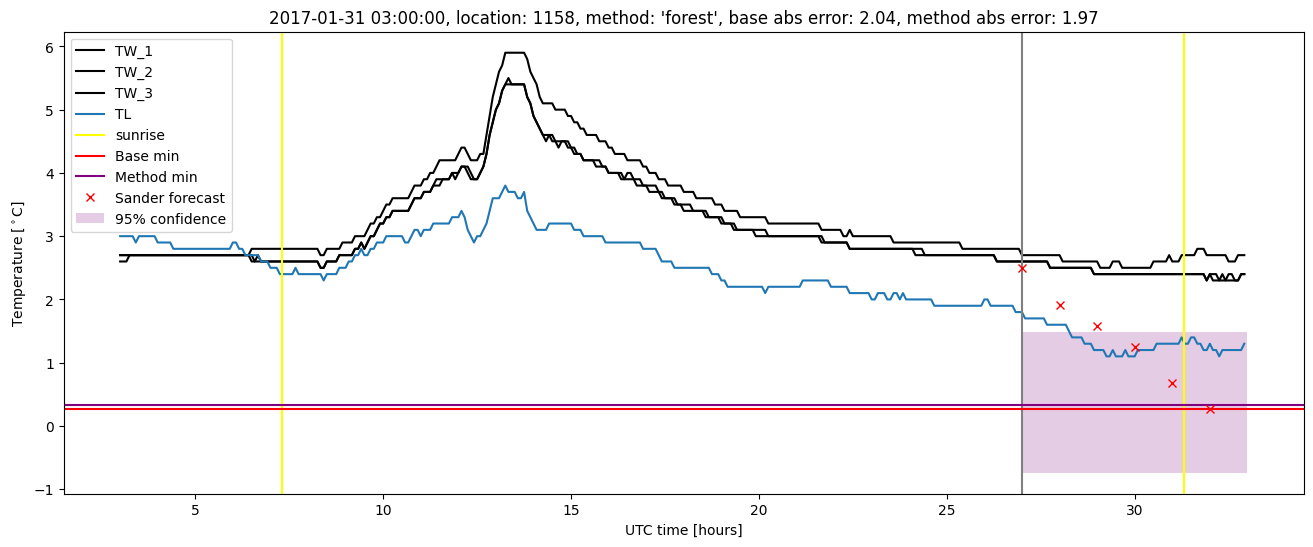
Random forest results
| names |
period |
power |
significance |
meanSquareError |
absError |
maxError |
CRPS |
IGN |
| baseline |
winter 2016 |
0.994 |
0.067 |
0.343 |
0.436 |
1.950 |
NaN |
NaN |
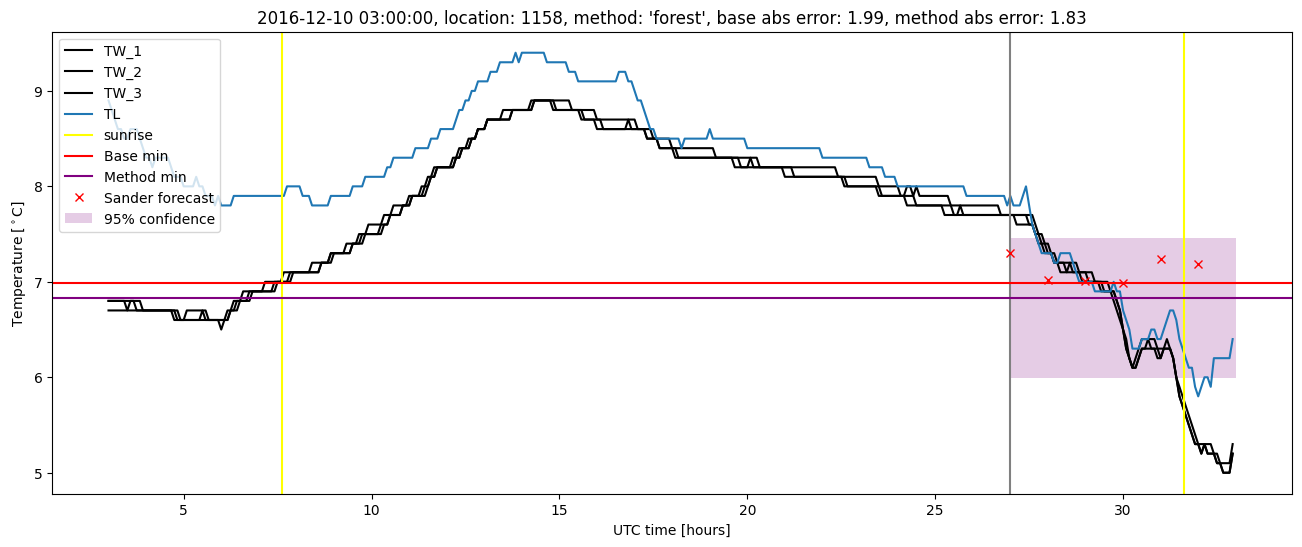
| forest |
winter 2016 |
0.994 |
0.067 |
0.283 |
0.398 |
1.686 |
0.511 |
3.296 |
| baseline |
winter 2017 |
0.975 |
0.029 |
0.403 |
0.465 |
2.037 |
NaN |
NaN |
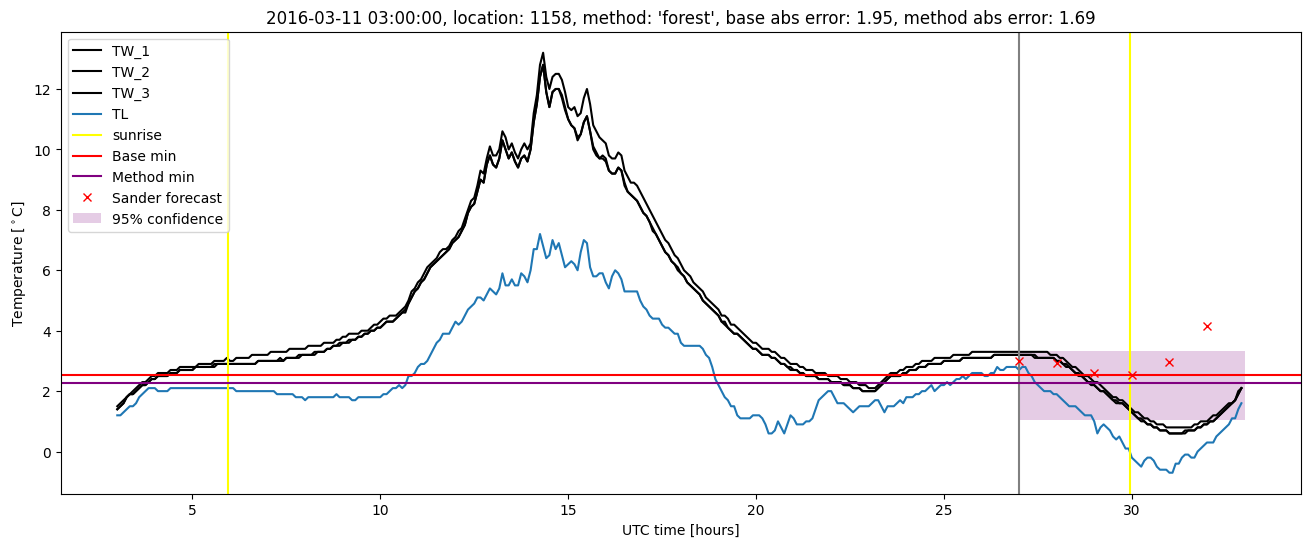
| forest |
winter 2017 |
0.975 |
0.029 |
0.356 |
0.449 |
1.969 |
0.530 |
3.897 |
| baseline |
winter 2018 |
0.982 |
0.083 |
0.395 |
0.445 |
2.030 |
NaN |
NaN |
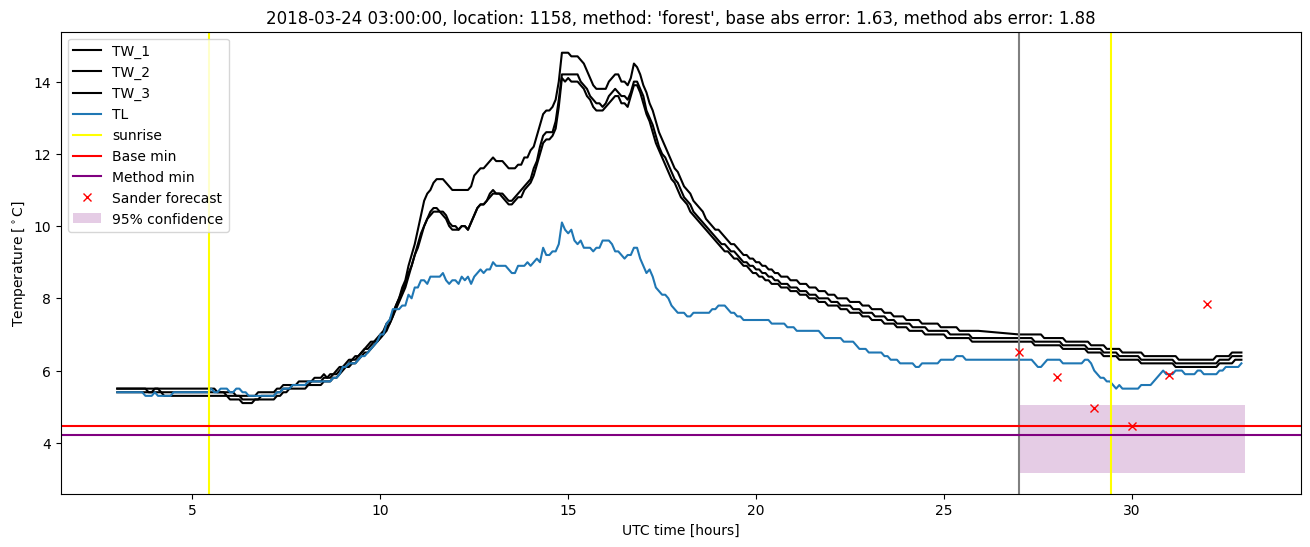
| forest |
winter 2018 |
0.982 |
0.125 |
0.384 |
0.447 |
1.881 |
0.540 |
3.134 |
| baseline |
winter 2019 |
1.000 |
0.000e+00 |
0.347 |
0.460 |
2.014 |
NaN |
NaN |
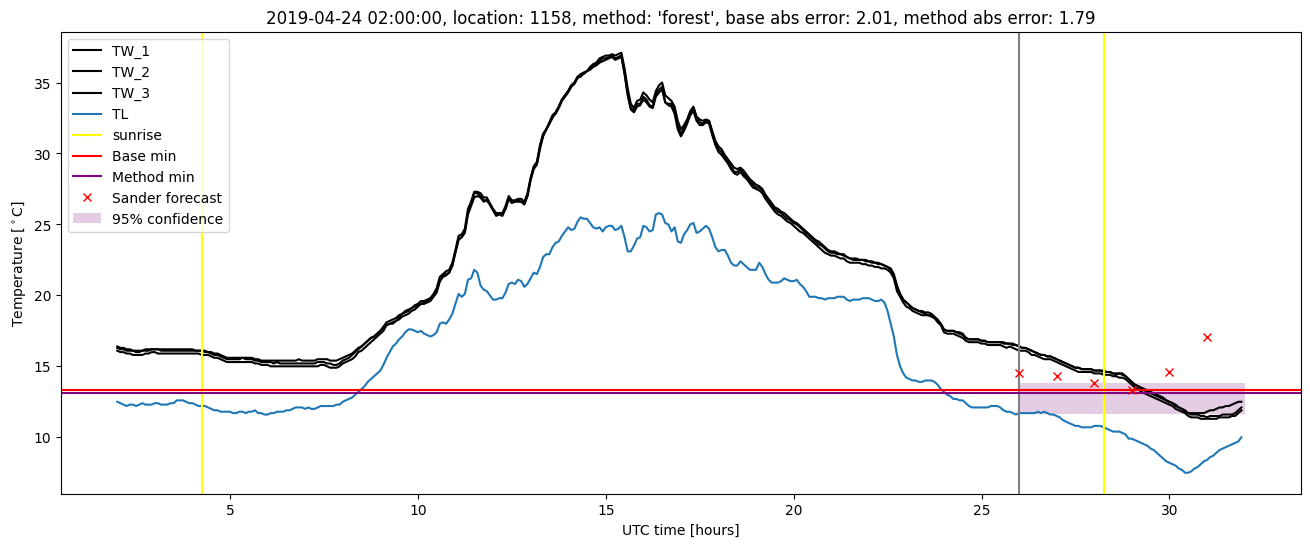
| forest |
winter 2019 |
1.000 |
0.000e+00 |
0.253 |
0.375 |
1.788 |
0.536 |
4.448 |
| baseline |
all |
0.987 |
0.053 |
0.372 |
0.449 |
2.037 |
NaN |
NaN |
| forest |
all |
0.987 |
0.064 |
0.323 |
0.420 |
1.969 |
0.526 |
3.575 |
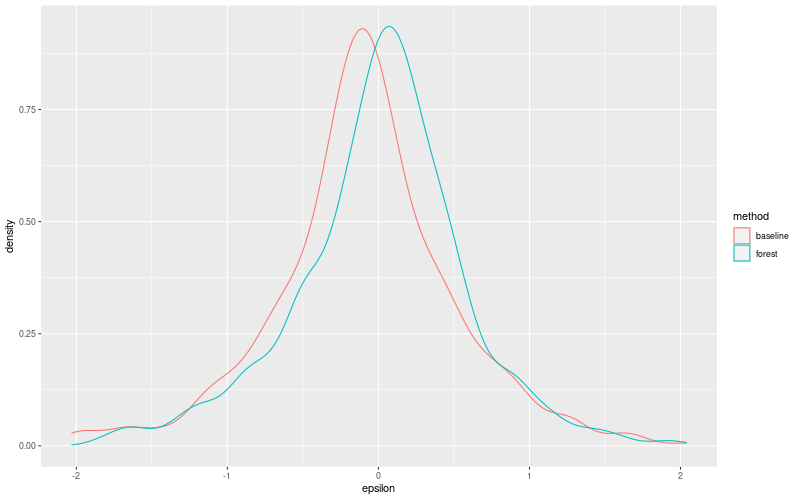
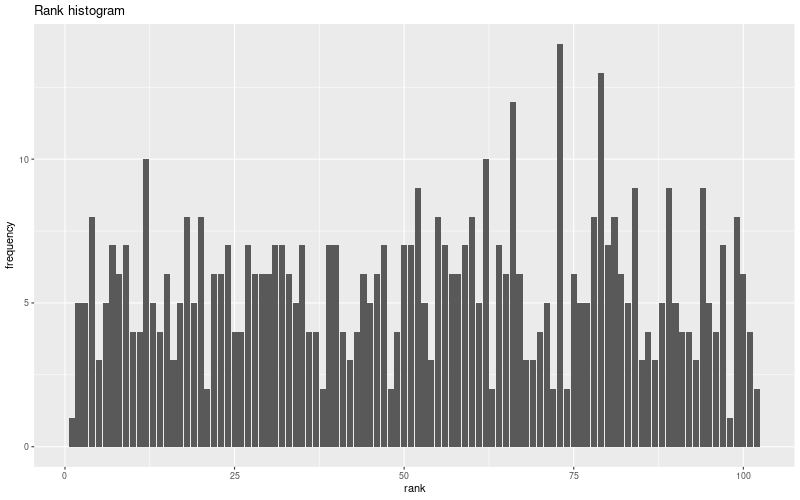
Random forest plots
Extended logistic regression results
| names |
period |
power |
significance |
meanSquareError |
absError |
maxError |
CRPS |
IGN |
| baseline |
winter 2016 |
0.994 |
0.067 |
0.343 |
0.436 |
1.950 |
NaN |
NaN |
| elr |
winter 2016 |
0.983 |
0.033 |
0.360 |
0.461 |
1.947 |
0.610 |
4.292 |
| baseline |
winter 2017 |
0.975 |
0.029 |
0.403 |
0.465 |
2.037 |
NaN |
NaN |
| elr |
winter 2017 |
0.966 |
0.029 |
0.423 |
0.494 |
2.301 |
0.598 |
4.546 |
| baseline |
winter 2018 |
0.982 |
0.083 |
0.395 |
0.445 |
2.030 |
NaN |
NaN |
| elr |
winter 2018 |
0.982 |
0.125 |
0.390 |
0.464 |
1.771 |
0.584 |
4.311 |
| baseline |
winter 2019 |
1.000 |
0.000e+00 |
0.347 |
0.460 |
2.014 |
NaN |
NaN |
| elr |
winter 2019 |
0.986 |
0.000e+00 |
0.390 |
0.479 |
2.359 |
0.551 |
3.734 |
| baseline |
all |
0.987 |
0.053 |
0.372 |
0.449 |
2.037 |
NaN |
NaN |
| elr |
all |
0.979 |
0.053 |
0.388 |
0.473 |
2.359 |
0.592 |
4.288 |
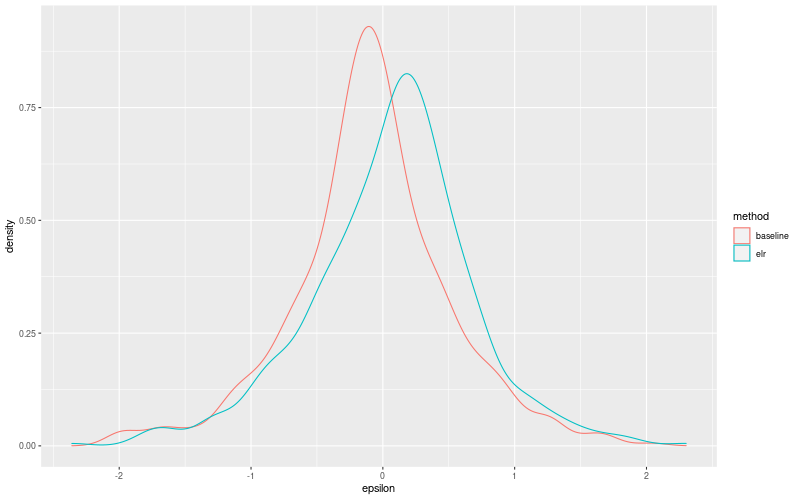
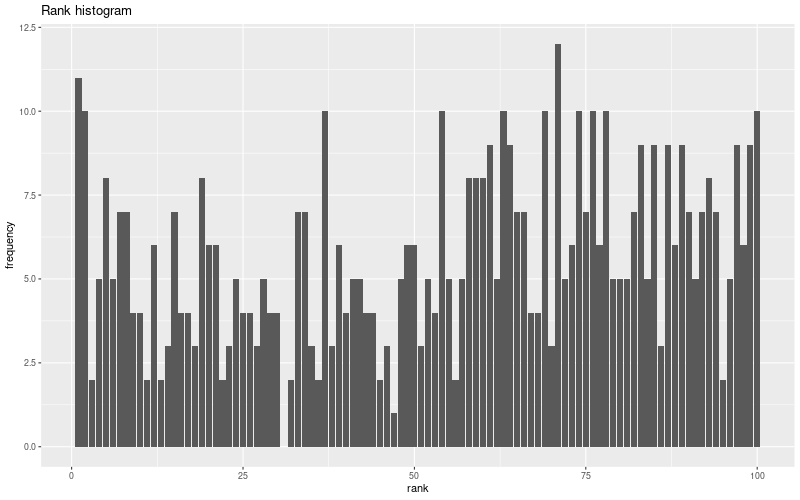
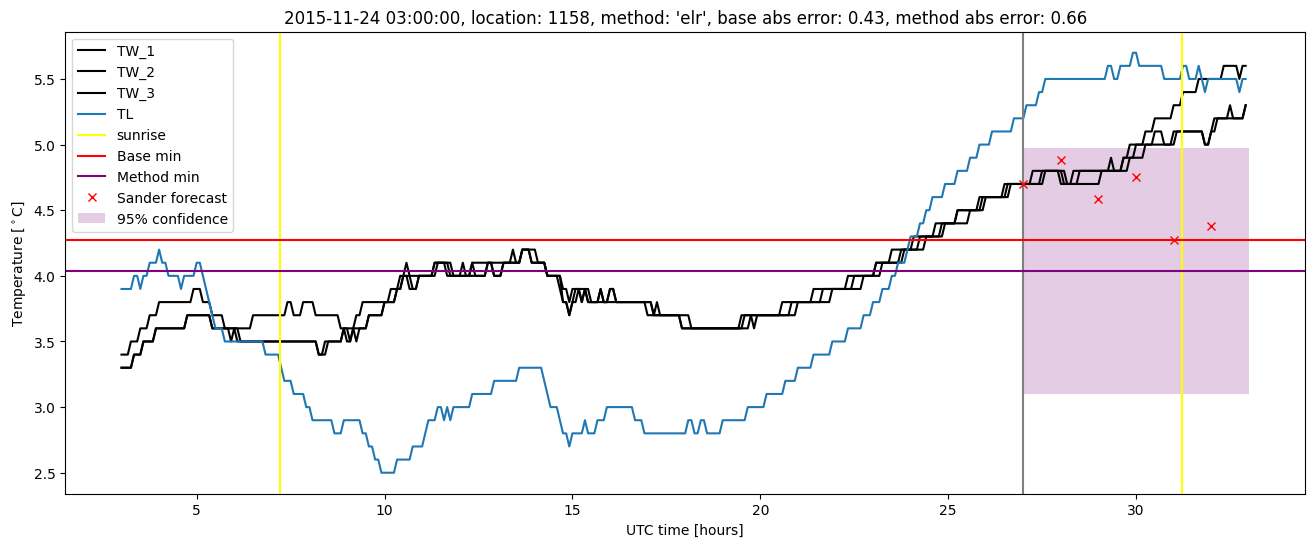
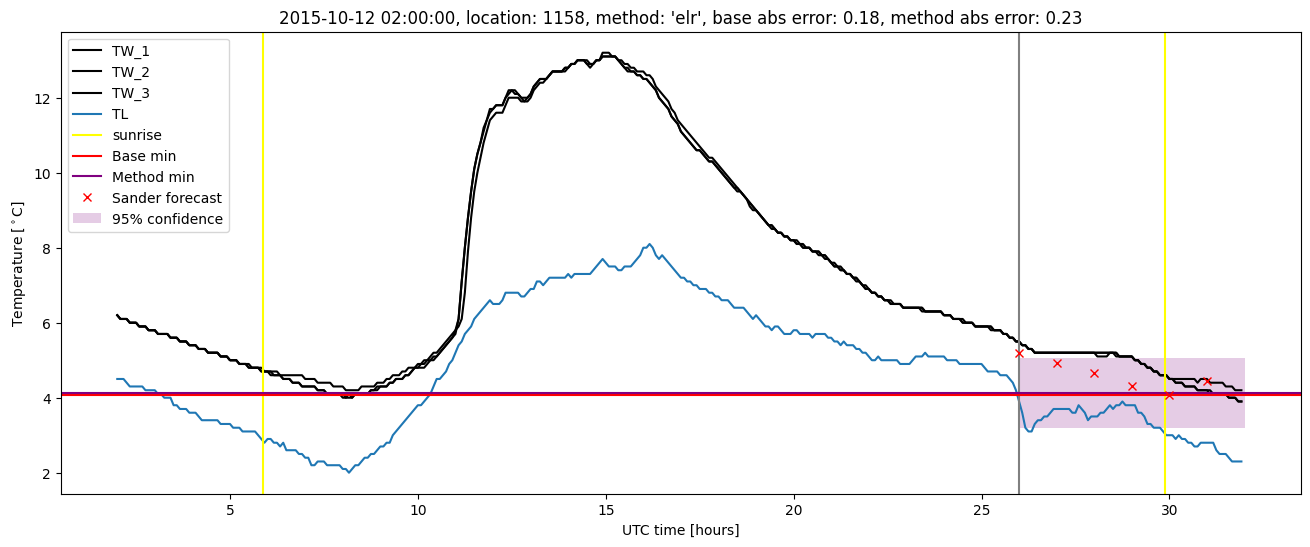
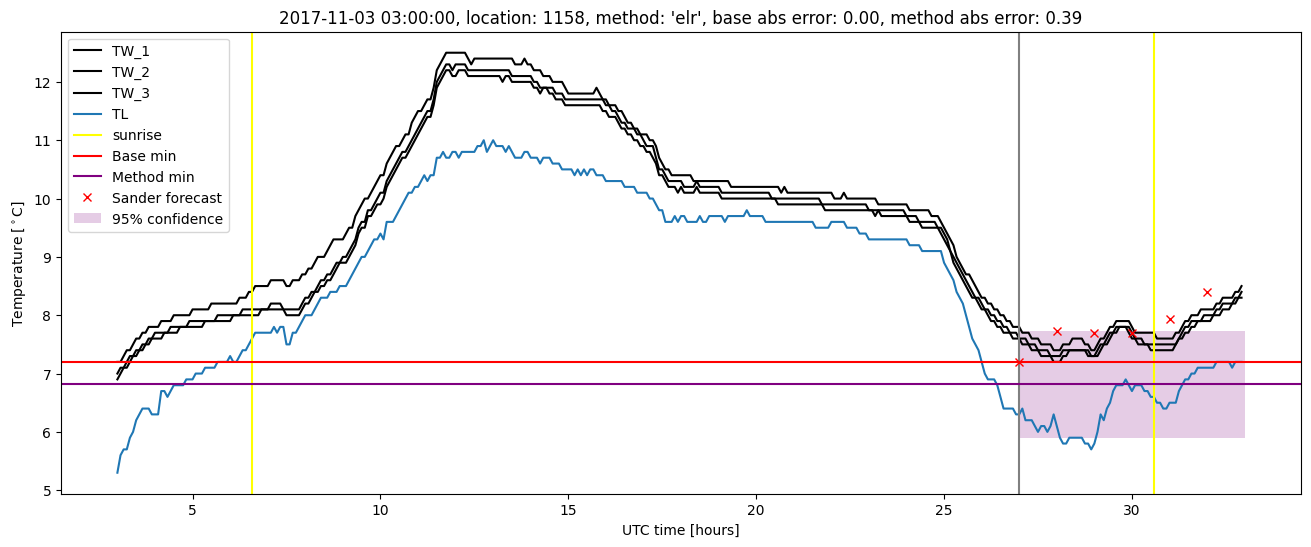
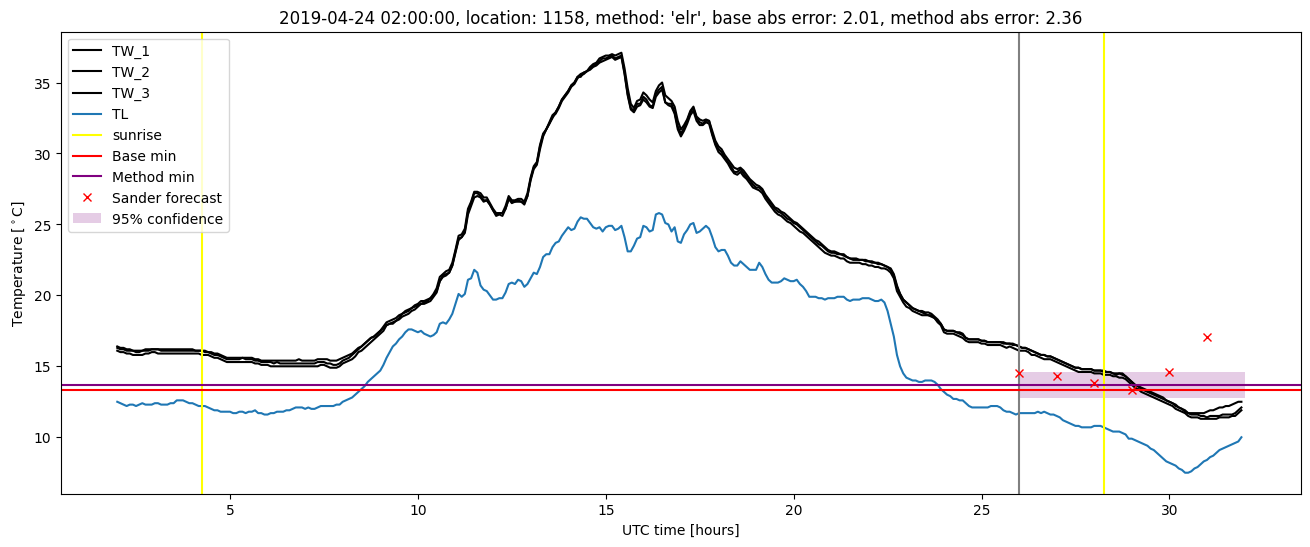
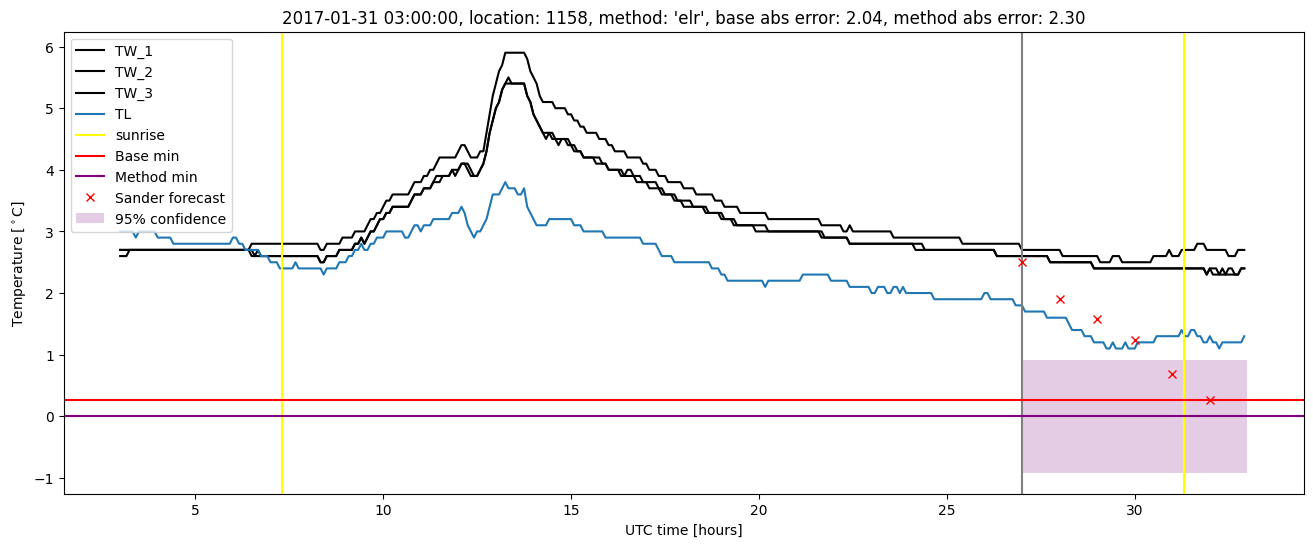
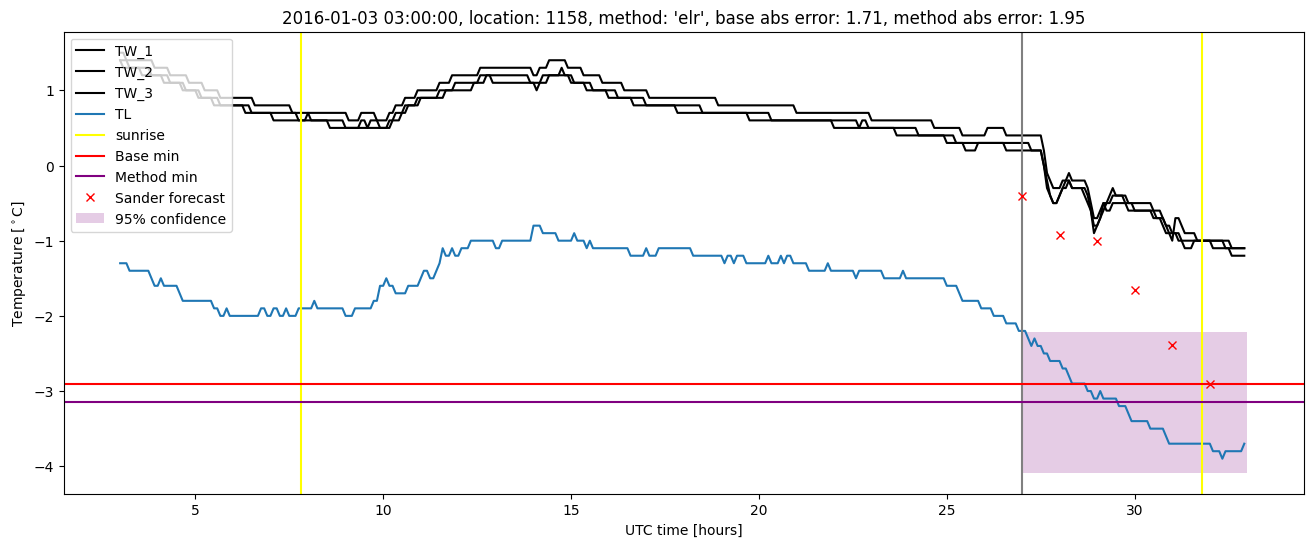
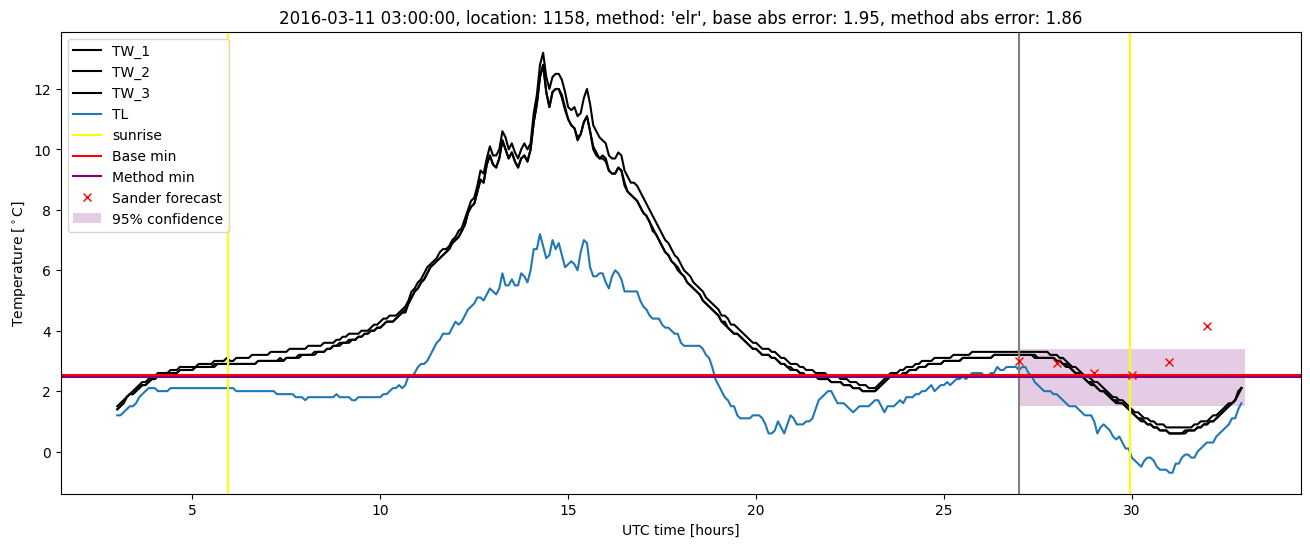
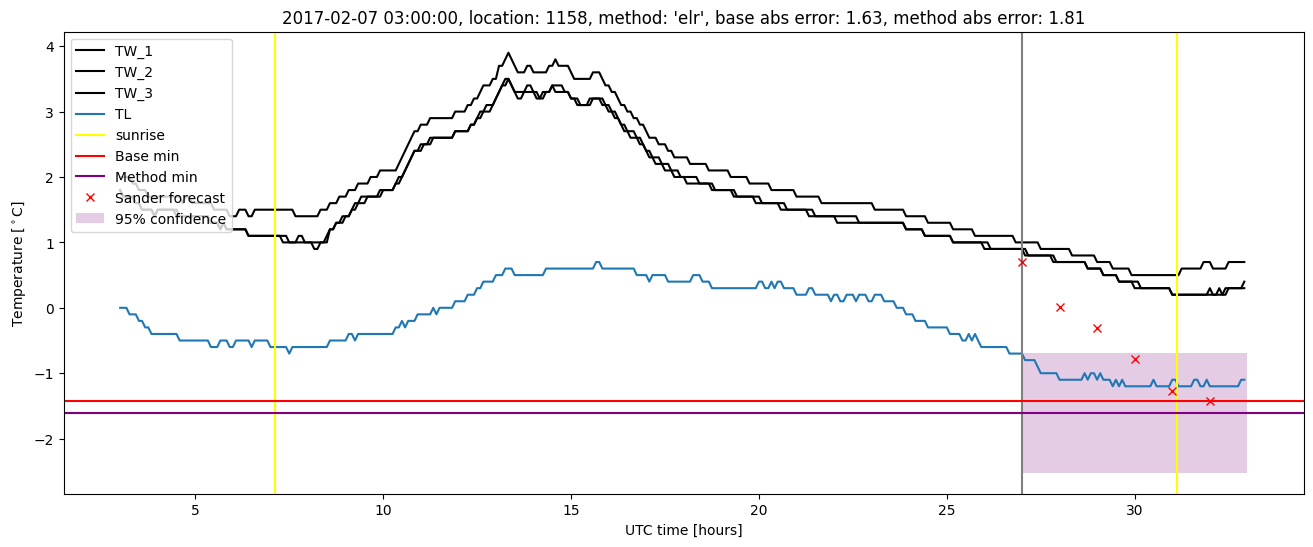
Extended logistic regression plots