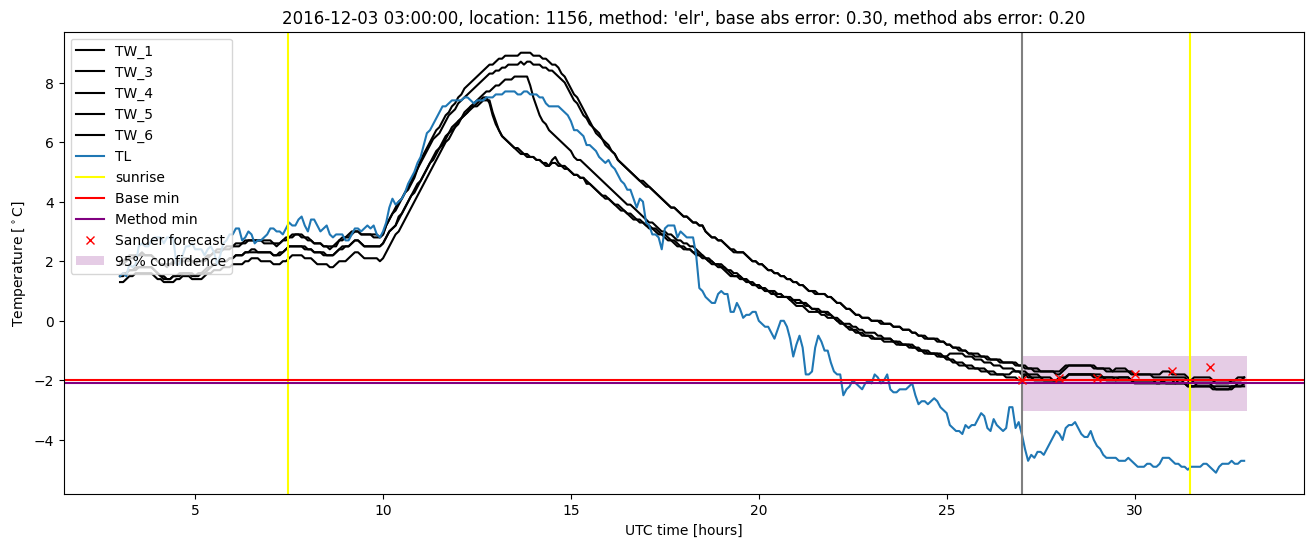
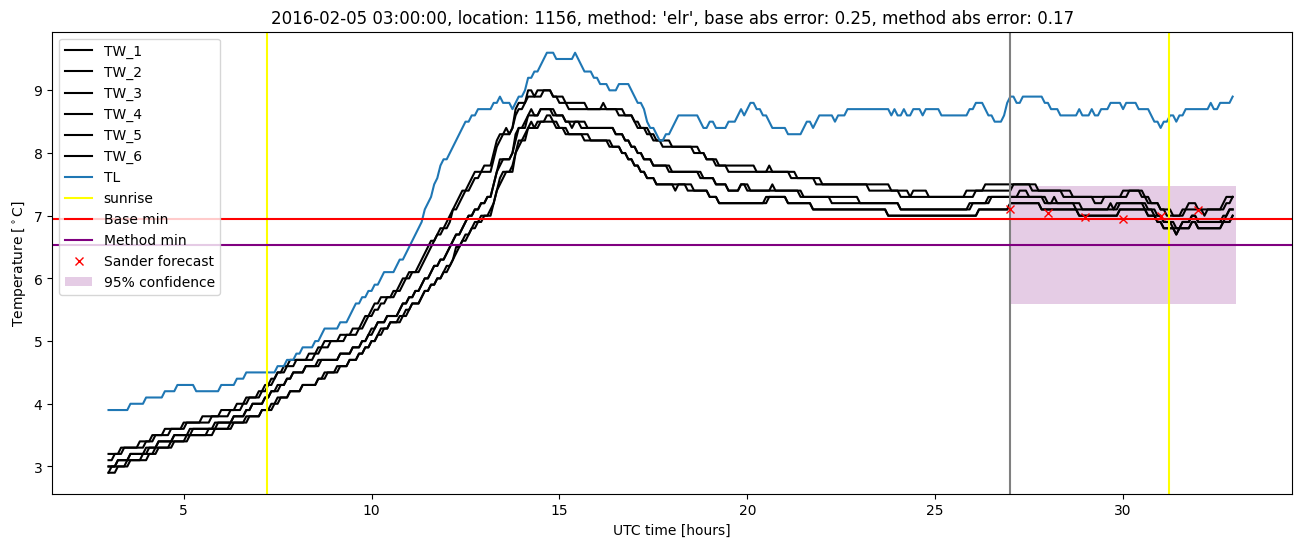
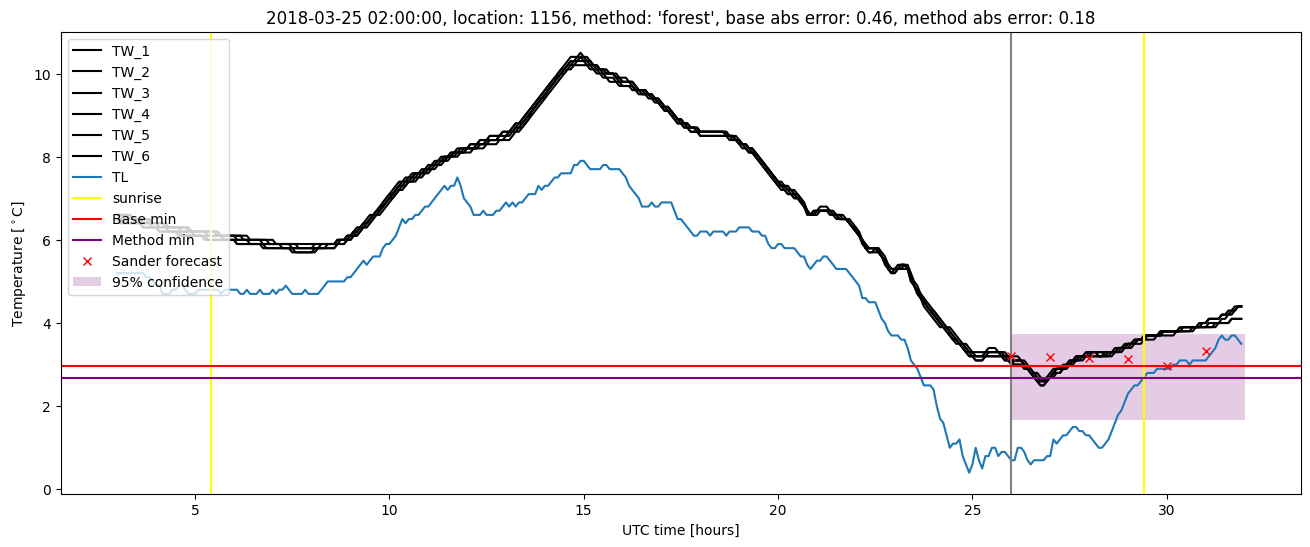
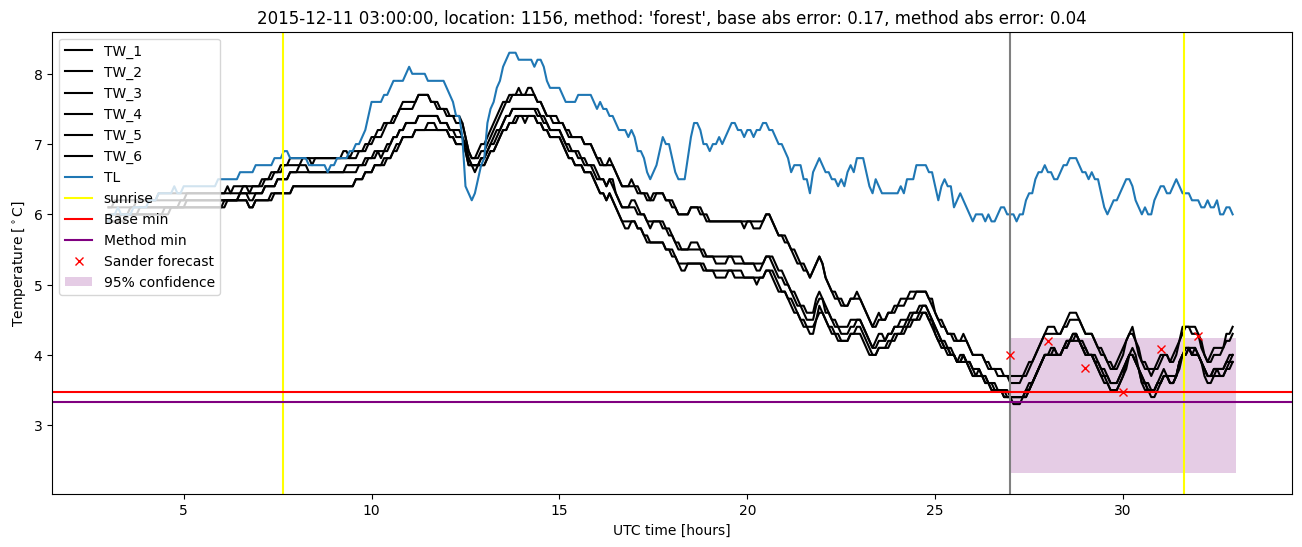
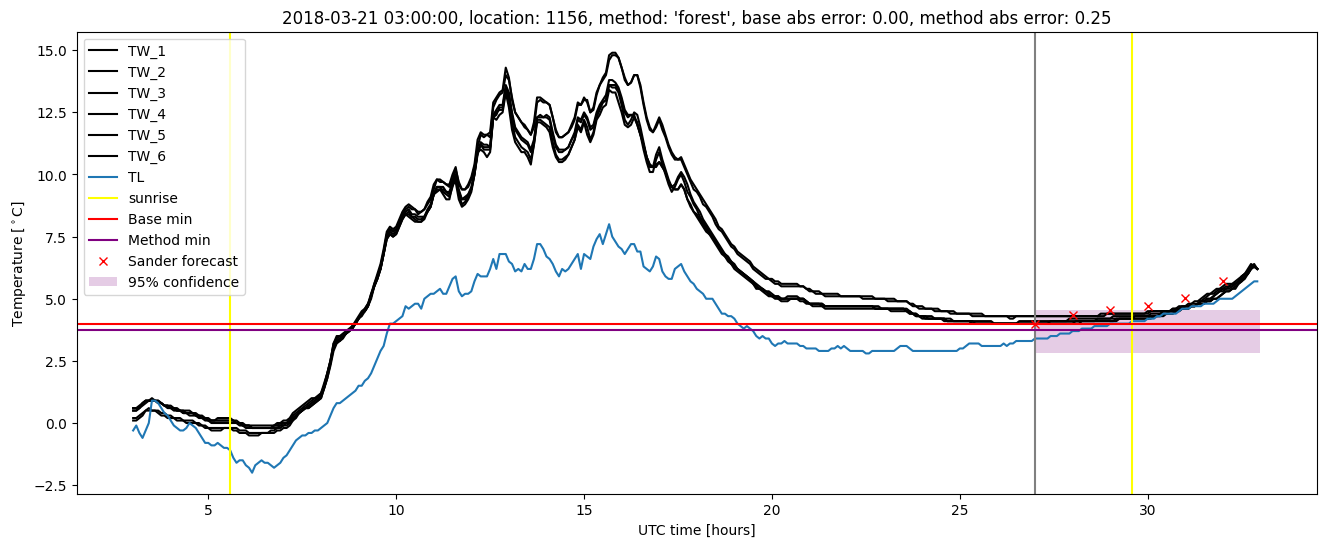
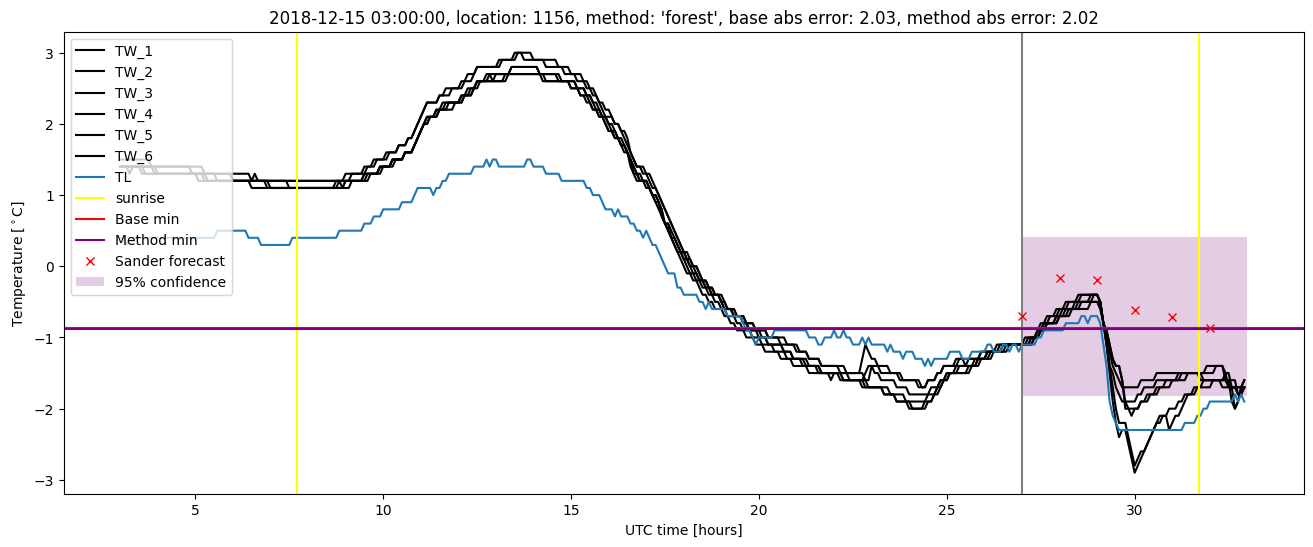
GMS location: 1156
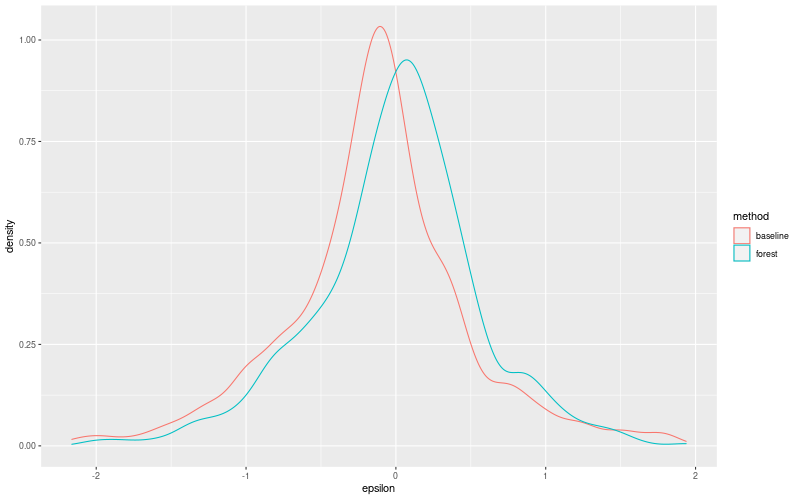
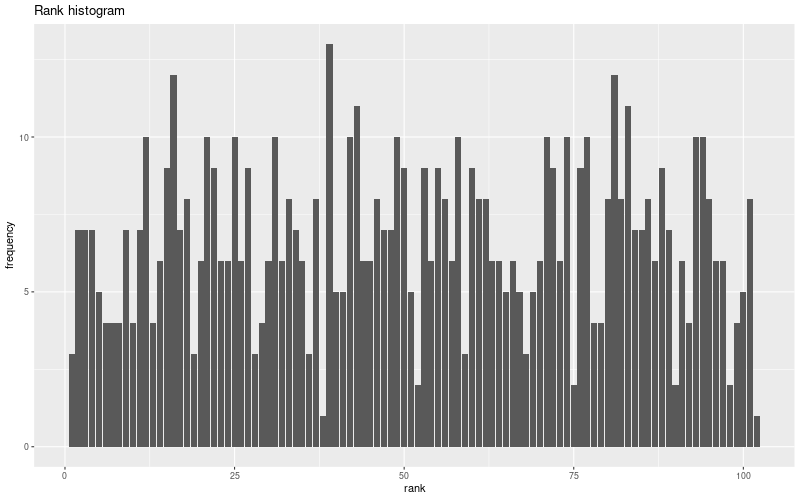
Random forest results
| names |
period |
power |
significance |
meanSquareError |
absError |
maxError |
CRPS |
IGN |
| baseline |
winter 2016 |
1.000 |
0.033 |
0.339 |
0.423 |
2.163 |
NaN |
NaN |
| forest |
winter 2016 |
0.981 |
0.033 |
0.275 |
0.389 |
1.937 |
0.563 |
3.803 |
| baseline |
winter 2017 |
0.991 |
0.028 |
0.421 |
0.469 |
1.900 |
NaN |
NaN |
| forest |
winter 2017 |
0.983 |
0.028 |
0.337 |
0.425 |
1.645 |
0.540 |
4.000 |
| baseline |
winter 2018 |
0.979 |
0.171 |
0.348 |
0.430 |
2.123 |
NaN |
NaN |
| forest |
winter 2018 |
0.993 |
0.146 |
0.305 |
0.418 |
1.994 |
0.565 |
3.592 |
| baseline |
winter 2019 |
0.993 |
0.000e+00 |
0.446 |
0.487 |
2.033 |
NaN |
NaN |
| forest |
winter 2019 |
1.000 |
0.000e+00 |
0.315 |
0.415 |
2.021 |
0.577 |
4.309 |
| baseline |
all |
0.991 |
0.076 |
0.384 |
0.450 |
2.163 |
NaN |
NaN |
| forest |
all |
0.989 |
0.067 |
0.306 |
0.411 |
2.021 |
0.562 |
3.905 |
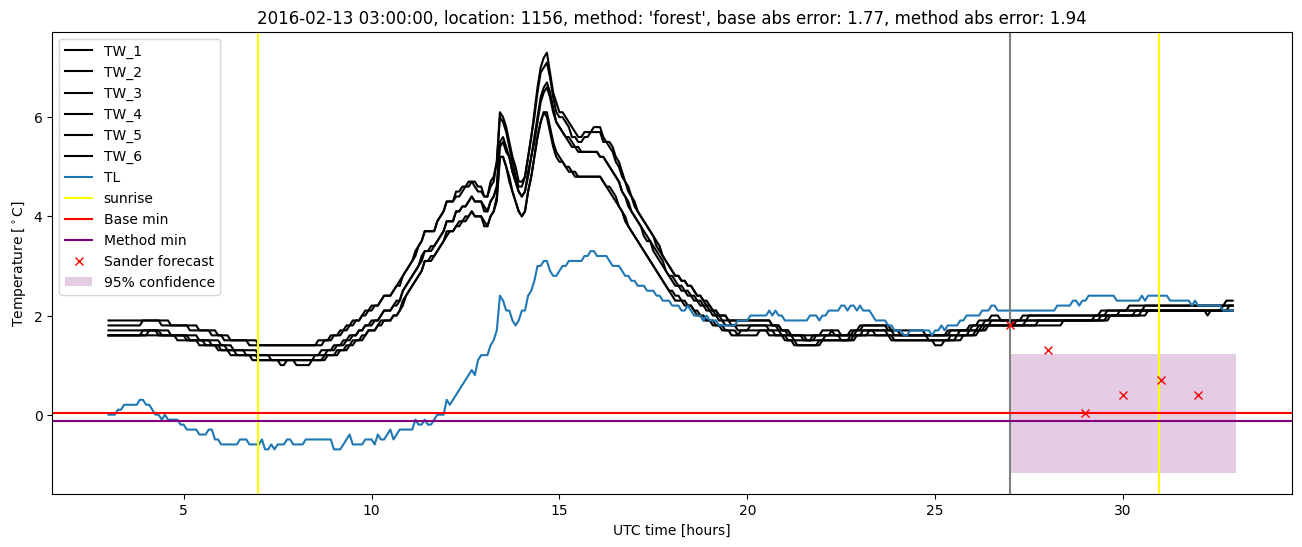
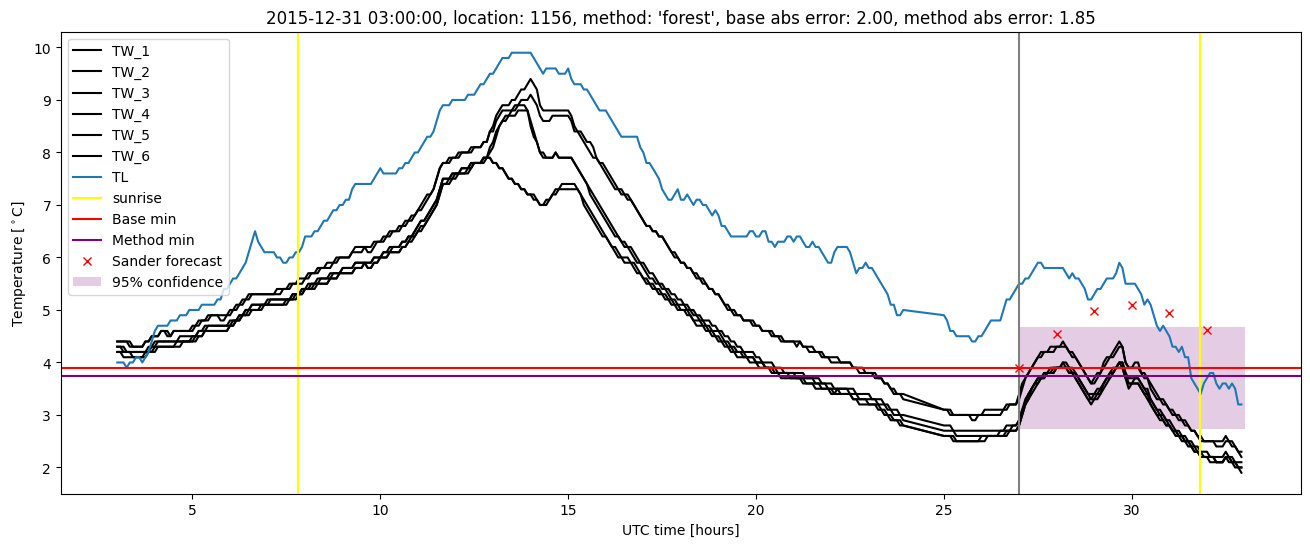
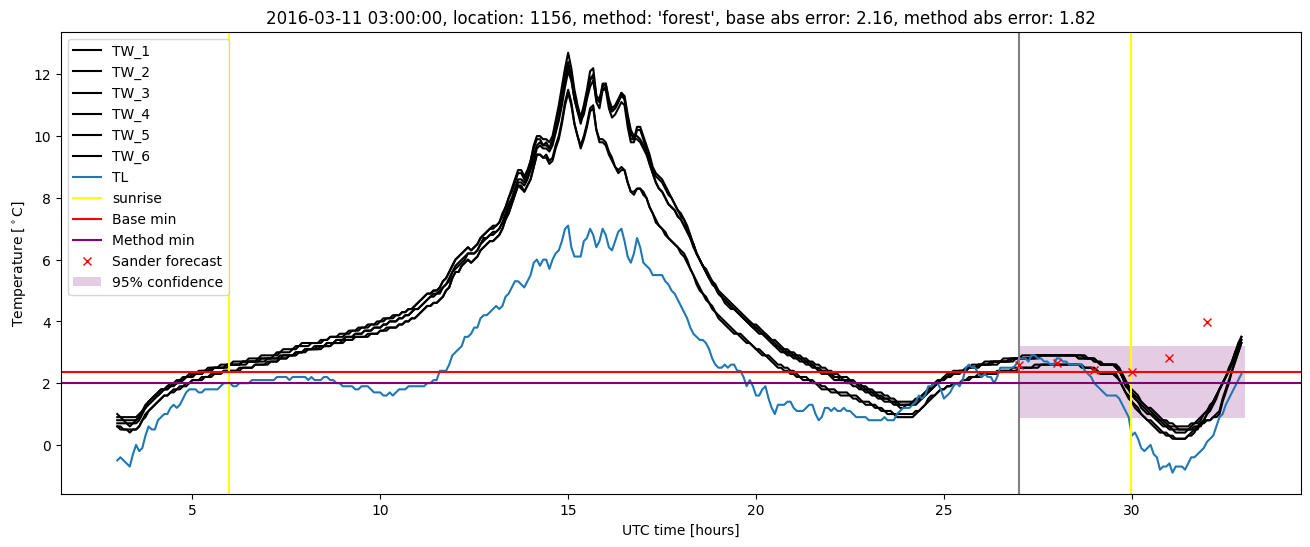
Random forest plots

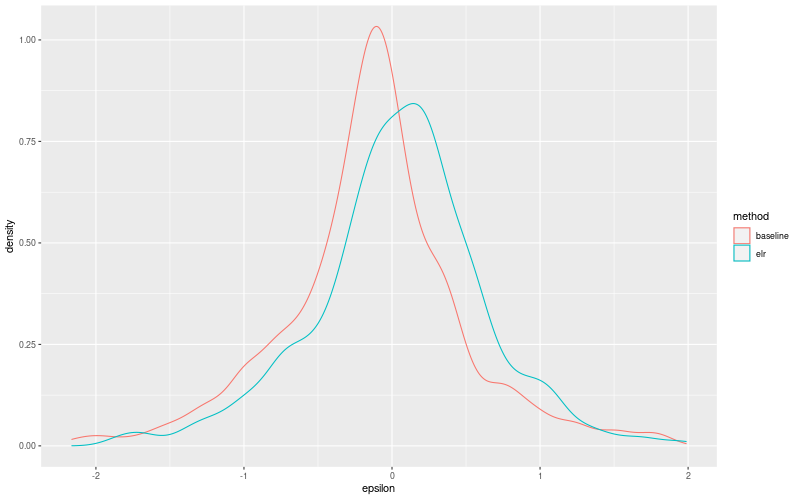
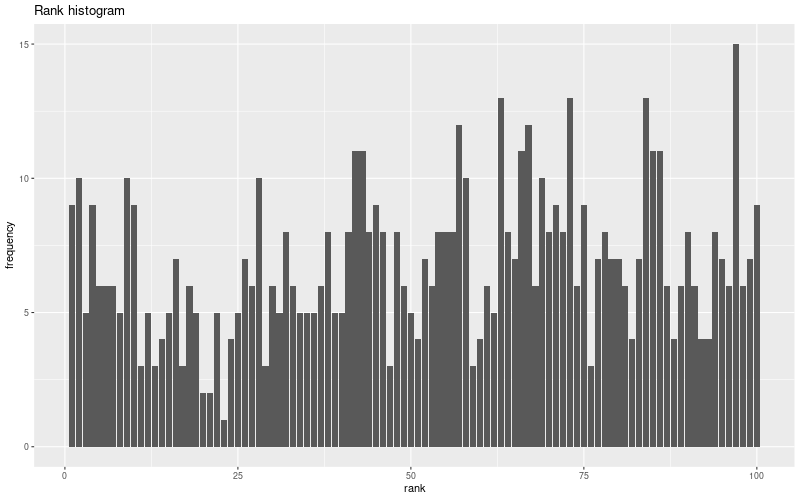
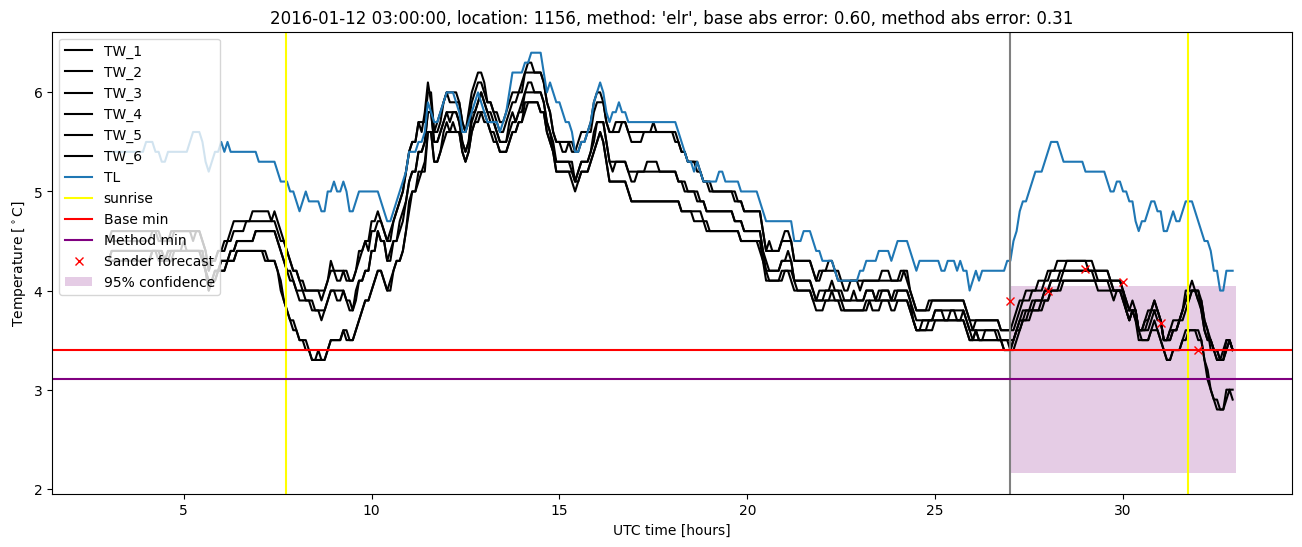
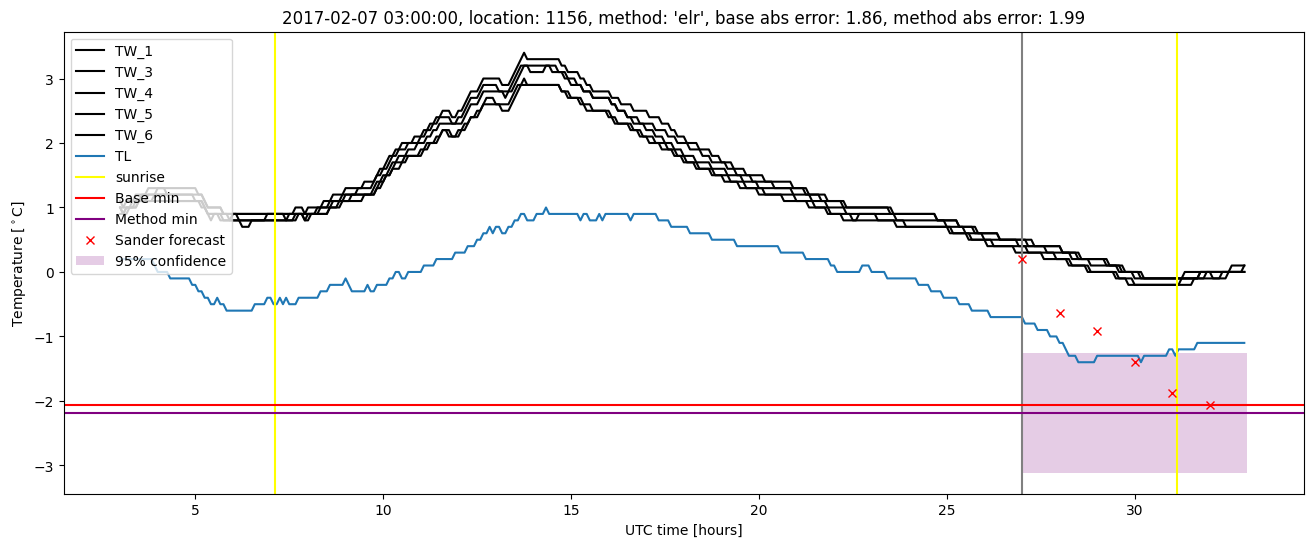
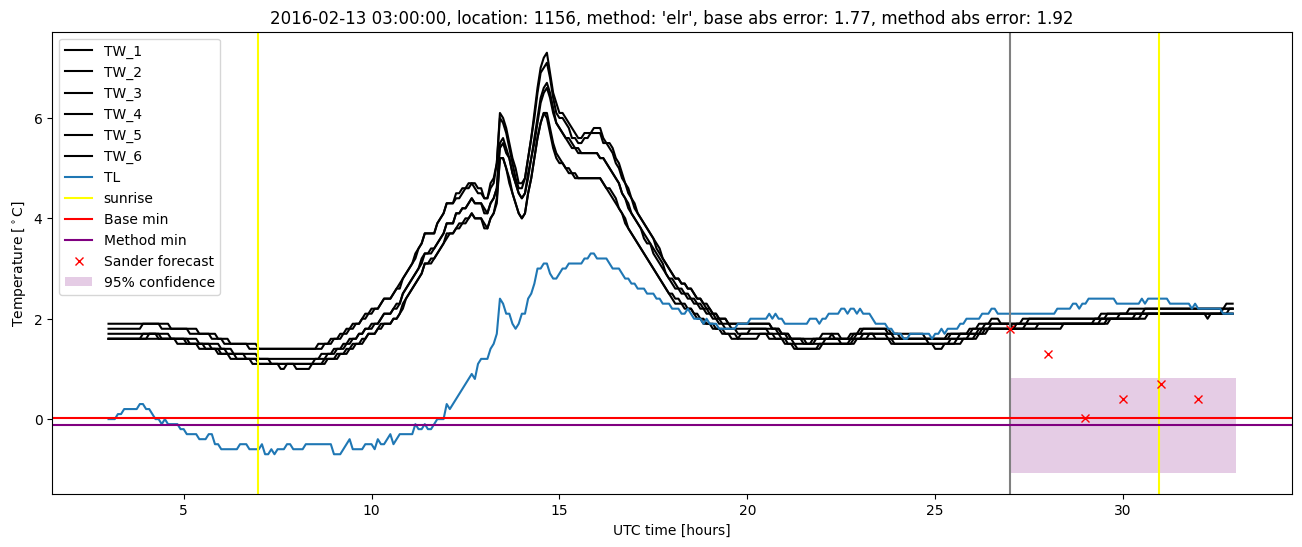
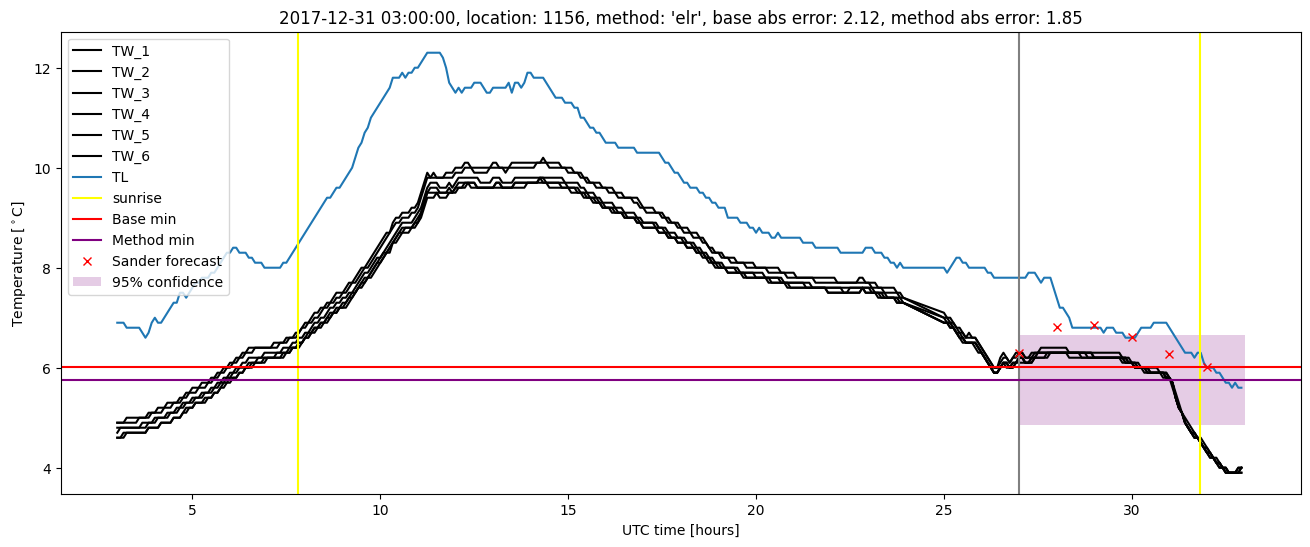
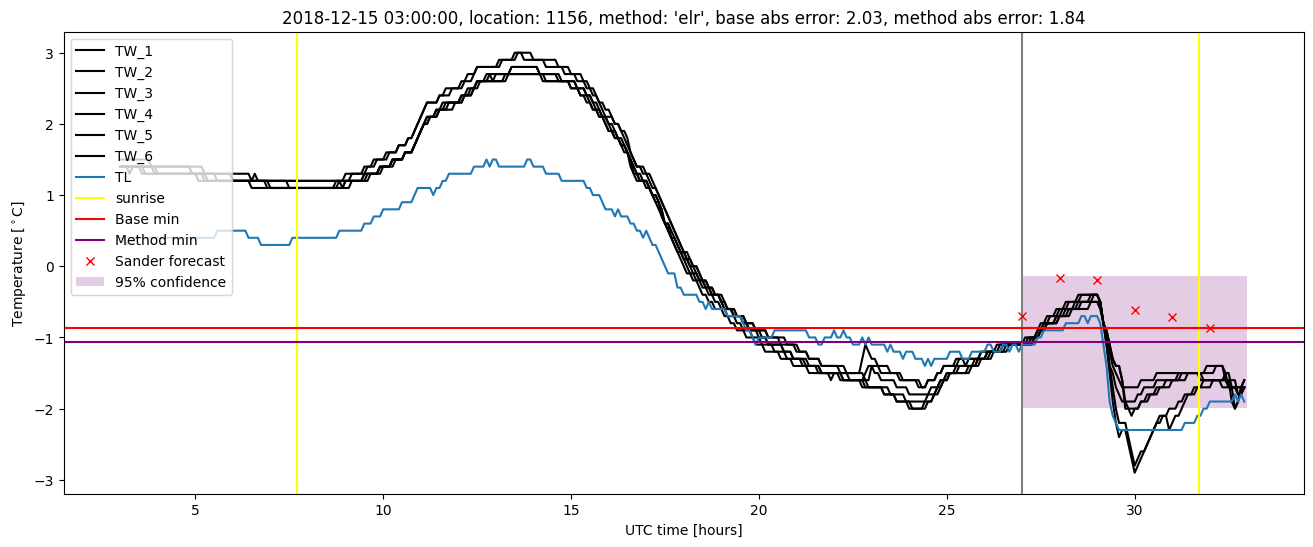
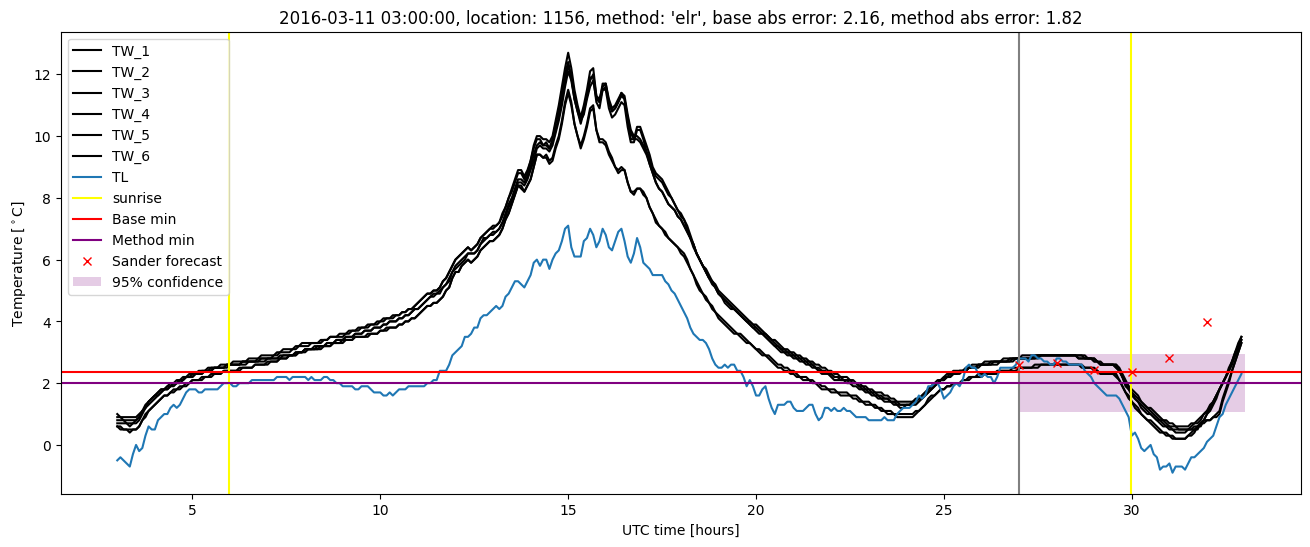
Extended logistic regression results
| names |
period |
power |
significance |
meanSquareError |
absError |
maxError |
CRPS |
IGN |
| baseline |
winter 2016 |
1.000 |
0.033 |
0.339 |
0.423 |
2.163 |
NaN |
NaN |
| elr |
winter 2016 |
0.994 |
0.000e+00 |
0.269 |
0.402 |
1.925 |
0.642 |
4.533 |
| baseline |
winter 2017 |
0.991 |
0.028 |
0.421 |
0.469 |
1.900 |
NaN |
NaN |
| elr |
winter 2017 |
0.991 |
0.028 |
0.391 |
0.452 |
1.987 |
0.576 |
4.064 |
| baseline |
winter 2018 |
0.979 |
0.171 |
0.348 |
0.430 |
2.123 |
NaN |
NaN |
| elr |
winter 2018 |
0.979 |
0.122 |
0.347 |
0.450 |
1.853 |
0.644 |
5.268 |
| baseline |
winter 2019 |
0.993 |
0.000e+00 |
0.446 |
0.487 |
2.033 |
NaN |
NaN |
| elr |
winter 2019 |
0.993 |
0.000e+00 |
0.361 |
0.453 |
1.837 |
0.587 |
4.120 |
| baseline |
all |
0.991 |
0.076 |
0.384 |
0.450 |
2.163 |
NaN |
NaN |
| elr |
all |
0.989 |
0.050 |
0.338 |
0.438 |
1.987 |
0.616 |
4.534 |
Extended logistic regression plots