GMS location: 1155
Random forest results
| names |
period |
power |
significance |
meanSquareError |
absError |
maxError |
CRPS |
IGN |
| baseline |
winter 2016 |
0.983 |
0.080 |
0.337 |
0.431 |
1.985 |
NaN |
NaN |
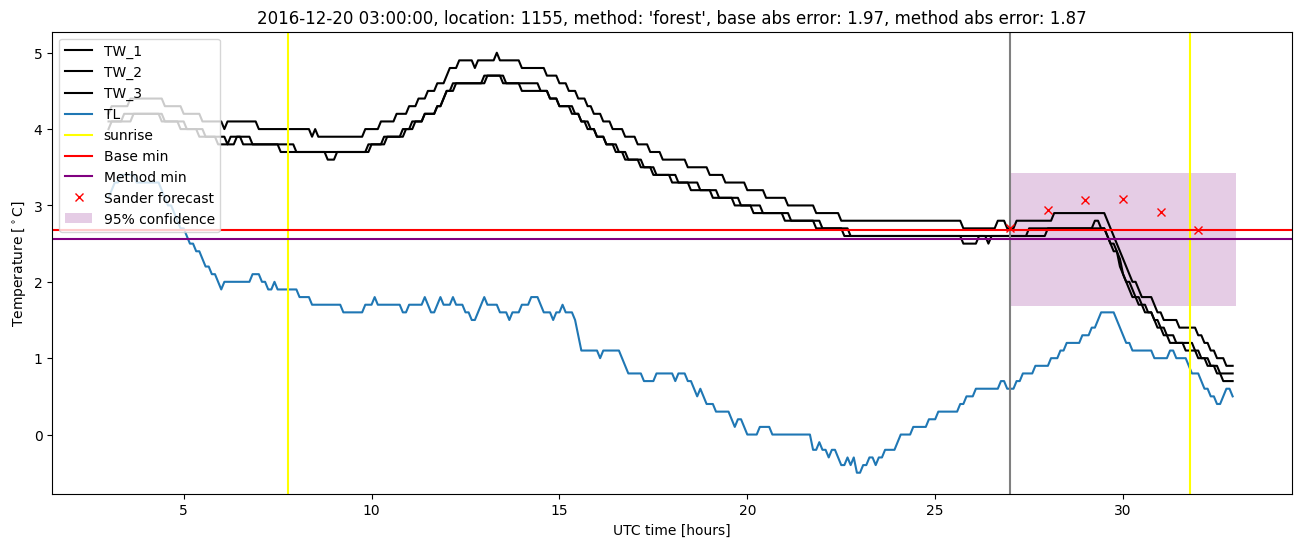
| forest |
winter 2016 |
0.983 |
0.080 |
0.273 |
0.383 |
1.685 |
0.504 |
3.213 |
| baseline |
winter 2017 |
0.959 |
0.000e+00 |
0.420 |
0.478 |
1.999 |
NaN |
NaN |
| forest |
winter 2017 |
0.959 |
0.000e+00 |
0.325 |
0.426 |
1.867 |
0.510 |
3.492 |
| baseline |
winter 2018 |
0.992 |
0.114 |
0.358 |
0.434 |
2.209 |
NaN |
NaN |
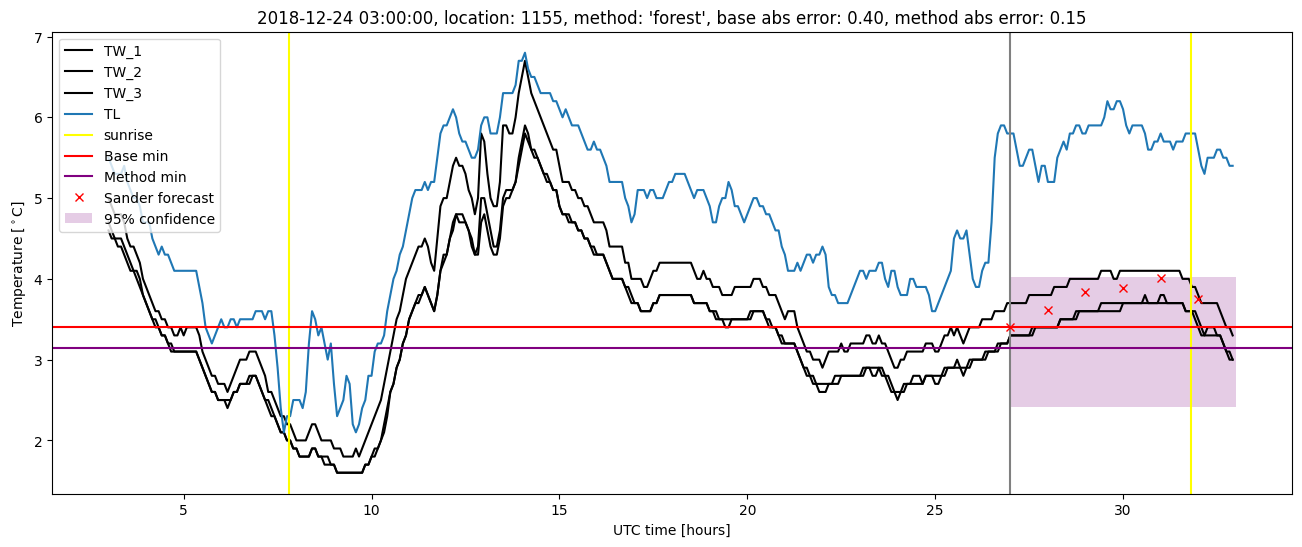
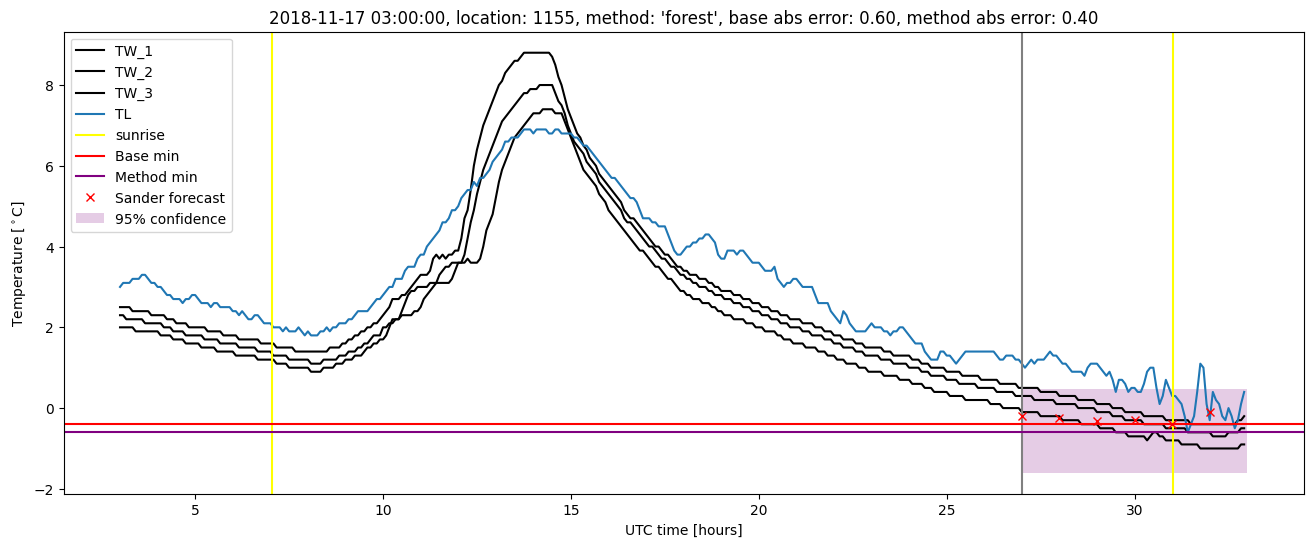
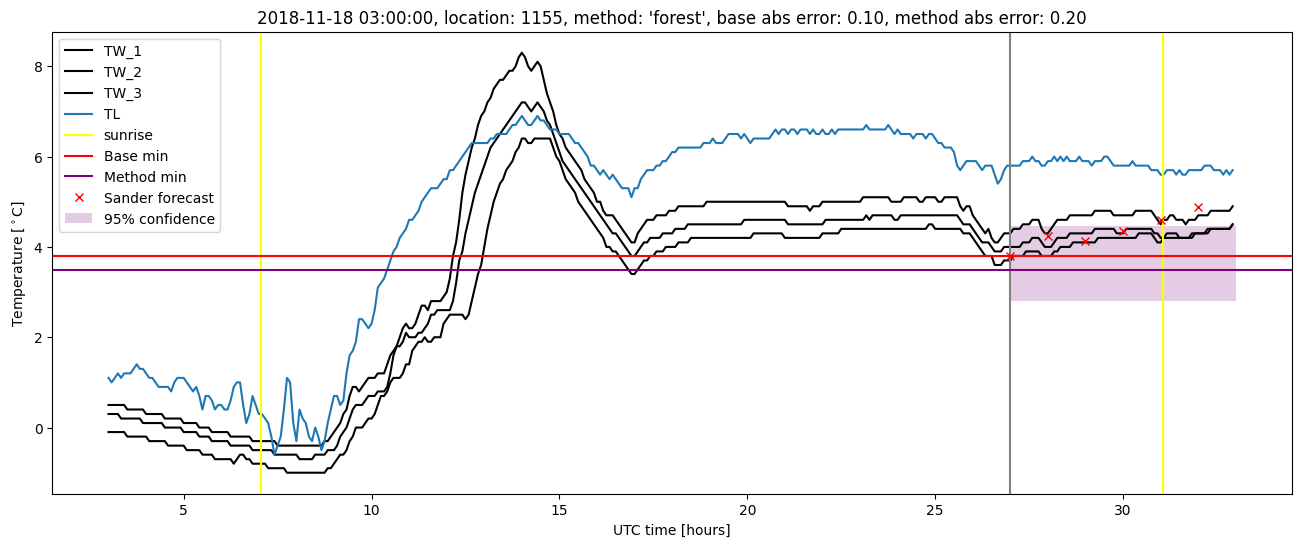
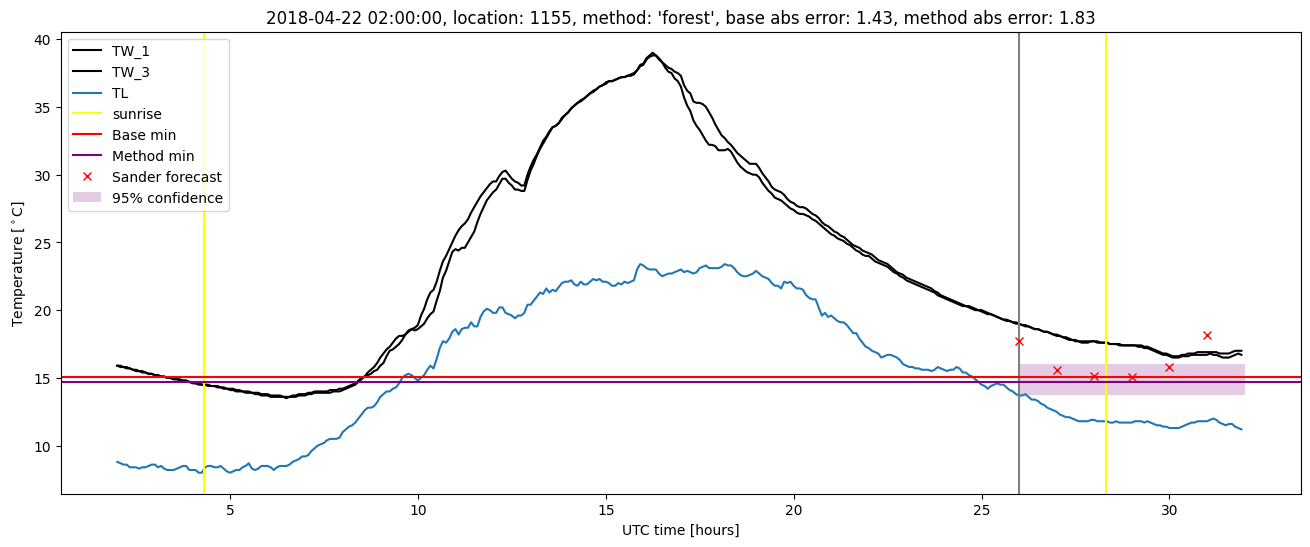
| forest |
winter 2018 |
0.977 |
0.057 |
0.339 |
0.431 |
2.324 |
0.518 |
3.318 |
| baseline |
winter 2019 |
0.985 |
0.000e+00 |
0.326 |
0.427 |
2.093 |
NaN |
NaN |
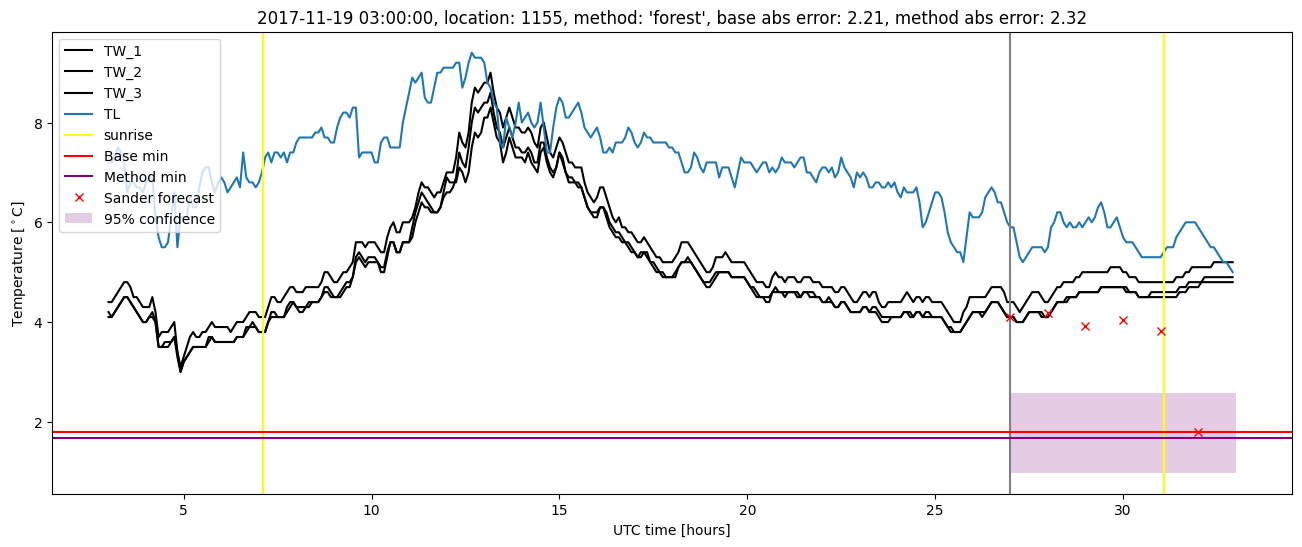
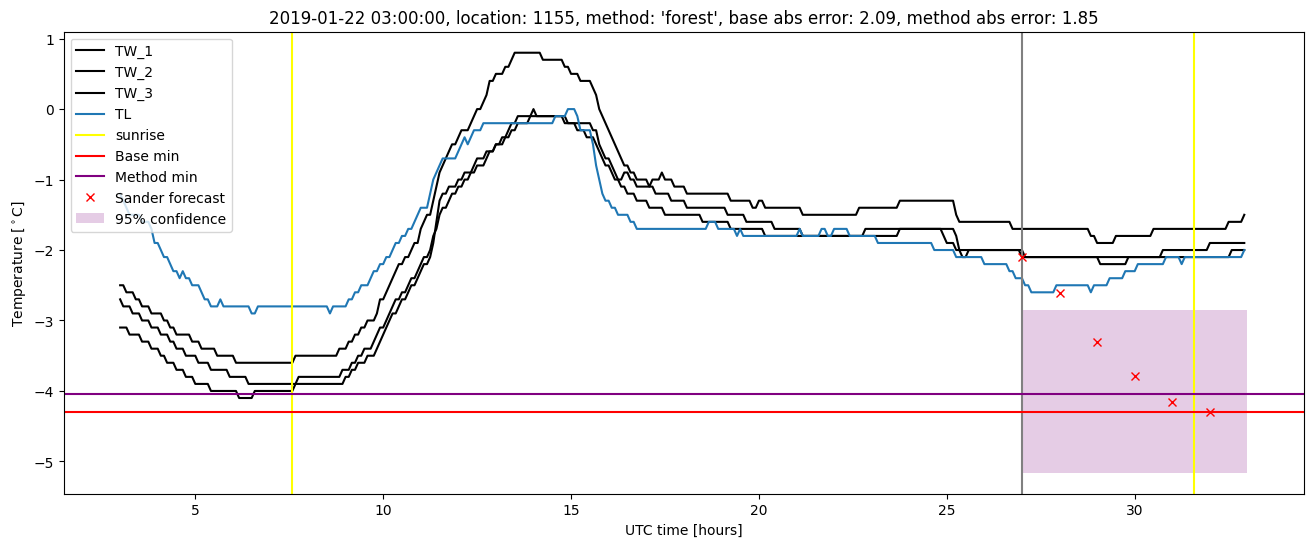
| forest |
winter 2019 |
0.985 |
0.000e+00 |
0.260 |
0.377 |
1.845 |
0.524 |
3.278 |
| baseline |
all |
0.980 |
0.059 |
0.359 |
0.442 |
2.209 |
NaN |
NaN |
| forest |
all |
0.977 |
0.039 |
0.299 |
0.404 |
2.324 |
0.513 |
3.318 |
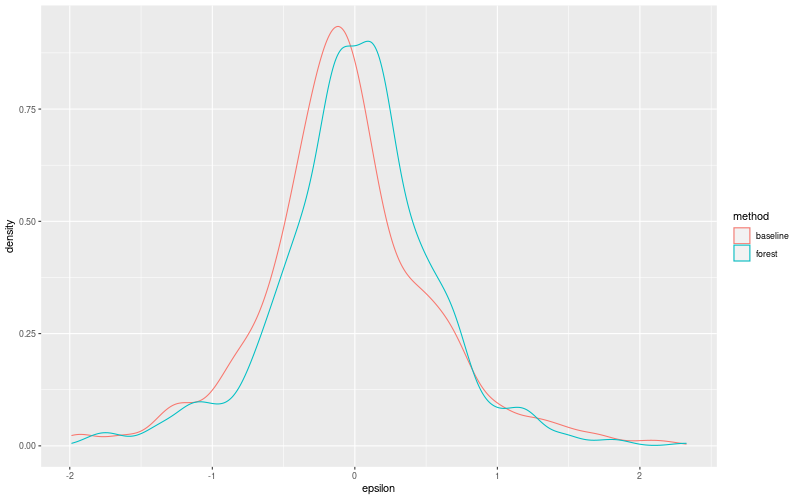
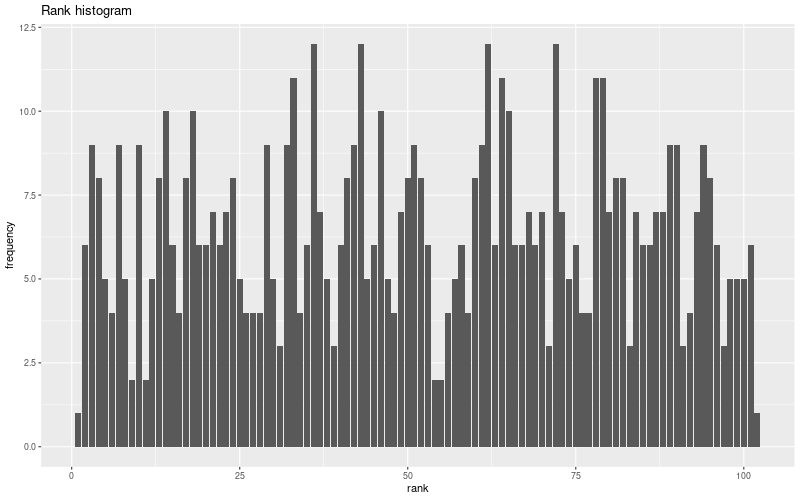
Random forest plots

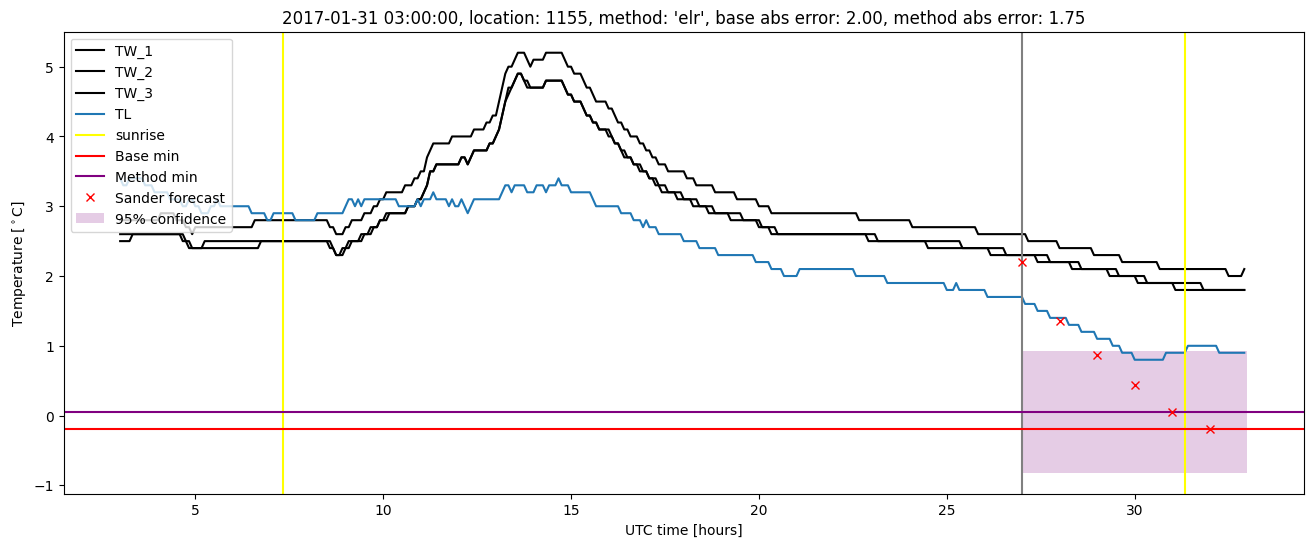
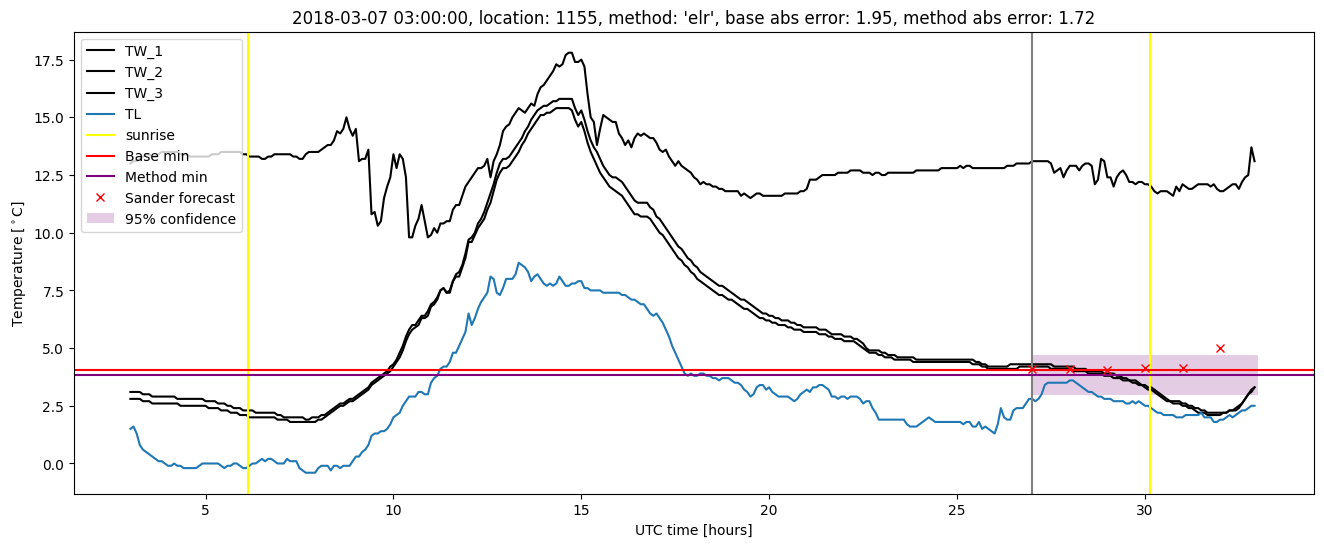
Extended logistic regression results
| names |
period |
power |
significance |
meanSquareError |
absError |
maxError |
CRPS |
IGN |
| baseline |
winter 2016 |
0.983 |
0.080 |
0.337 |
0.431 |
1.985 |
NaN |
NaN |
| elr |
winter 2016 |
0.977 |
0.040 |
0.292 |
0.413 |
1.642 |
0.559 |
4.228 |
| baseline |
winter 2017 |
0.959 |
0.000e+00 |
0.420 |
0.478 |
1.999 |
NaN |
NaN |
| elr |
winter 2017 |
0.959 |
0.000e+00 |
0.365 |
0.465 |
1.747 |
0.599 |
5.272 |
| baseline |
winter 2018 |
0.992 |
0.114 |
0.358 |
0.434 |
2.209 |
NaN |
NaN |
| elr |
winter 2018 |
0.985 |
0.086 |
0.348 |
0.454 |
2.261 |
0.579 |
5.056 |
| baseline |
winter 2019 |
0.985 |
0.000e+00 |
0.326 |
0.427 |
2.093 |
NaN |
NaN |
| elr |
winter 2019 |
0.992 |
0.000e+00 |
0.271 |
0.382 |
1.961 |
0.552 |
3.974 |
| baseline |
all |
0.980 |
0.059 |
0.359 |
0.442 |
2.209 |
NaN |
NaN |
| elr |
all |
0.978 |
0.039 |
0.319 |
0.429 |
2.261 |
0.572 |
4.626 |
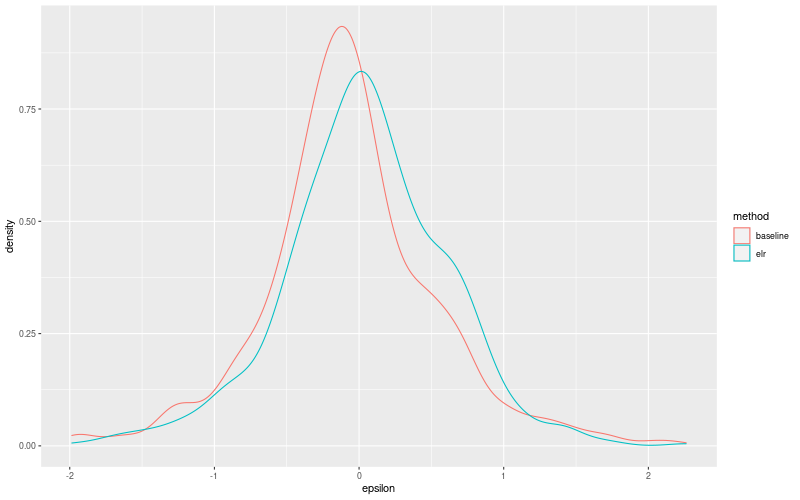
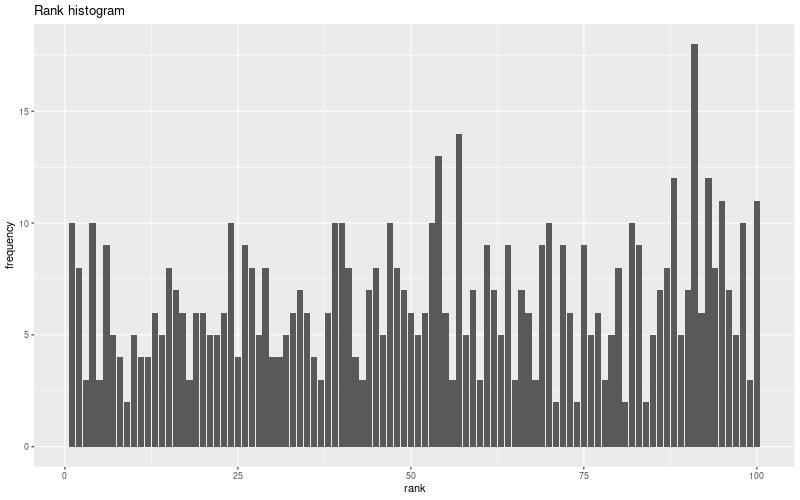
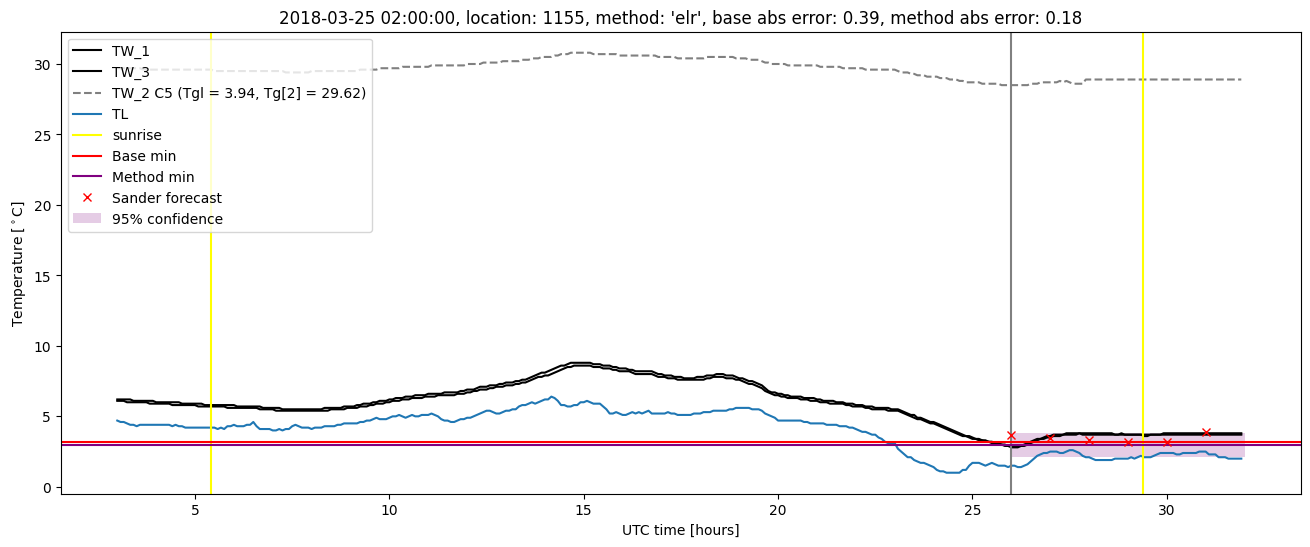
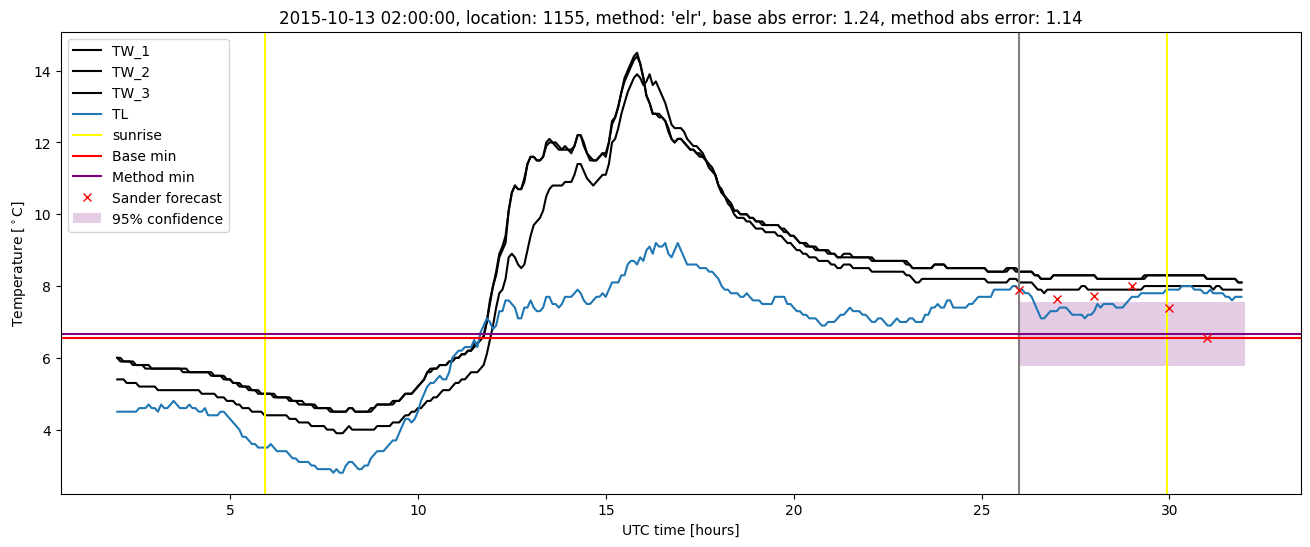
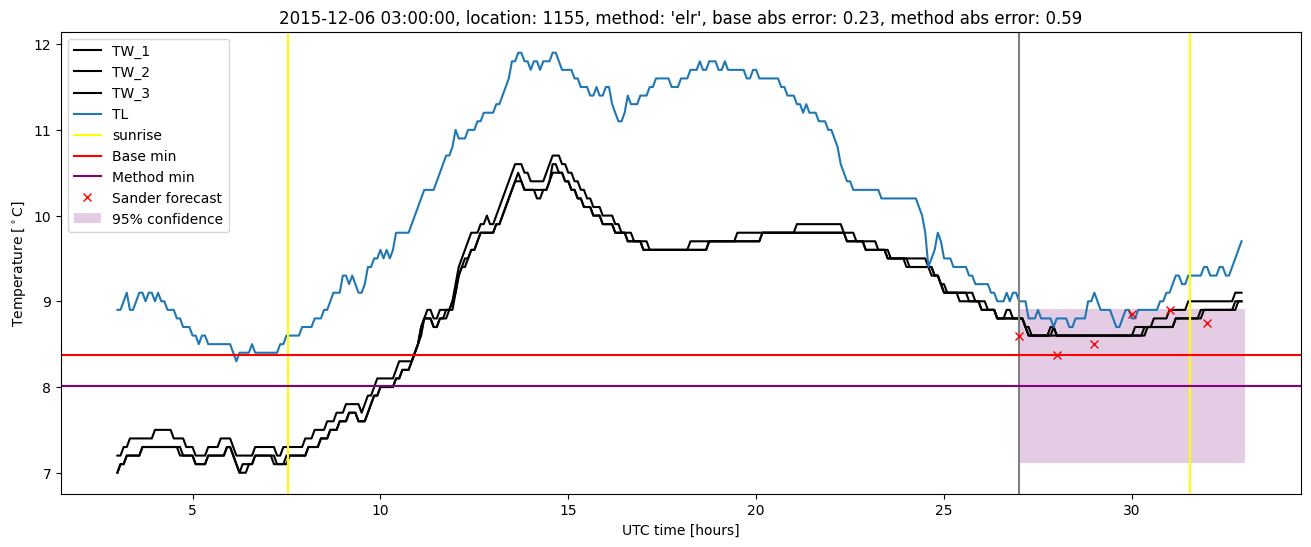
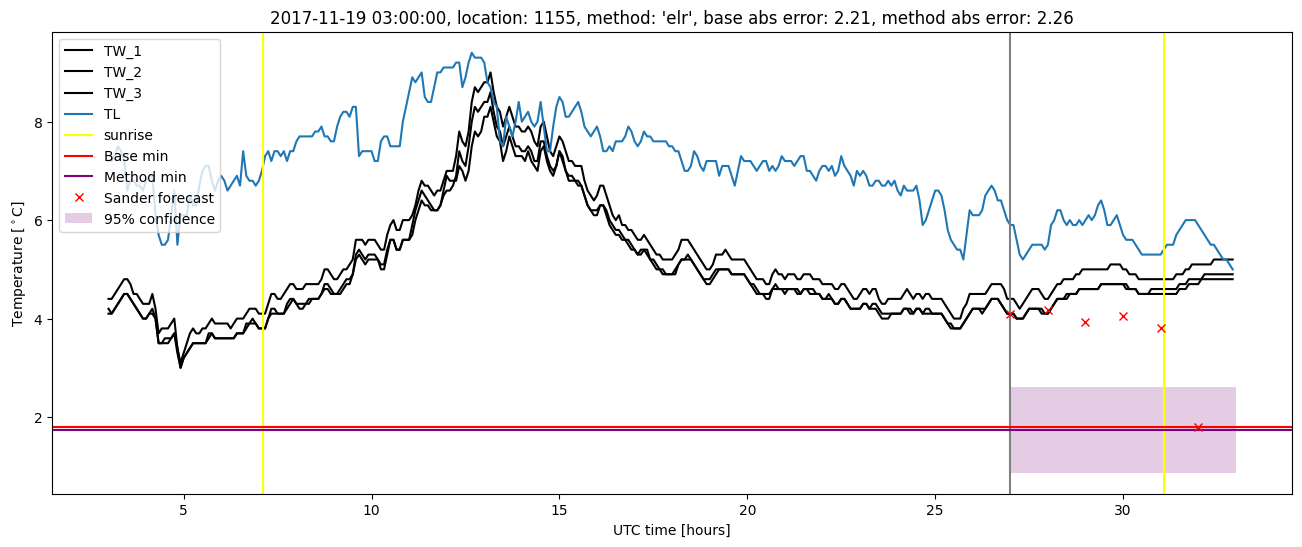
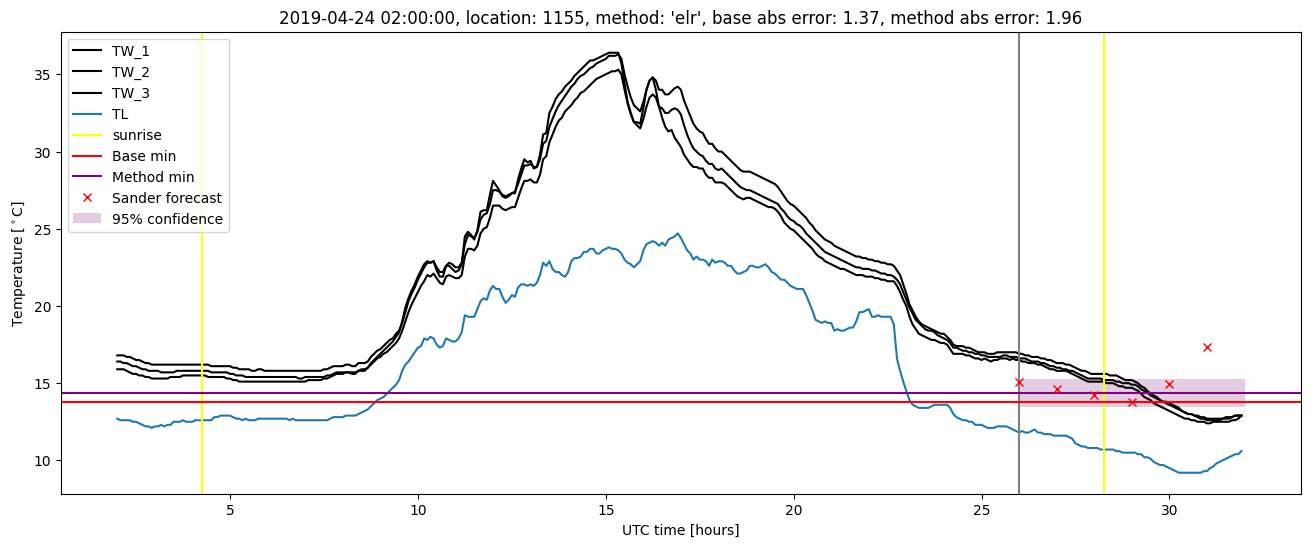
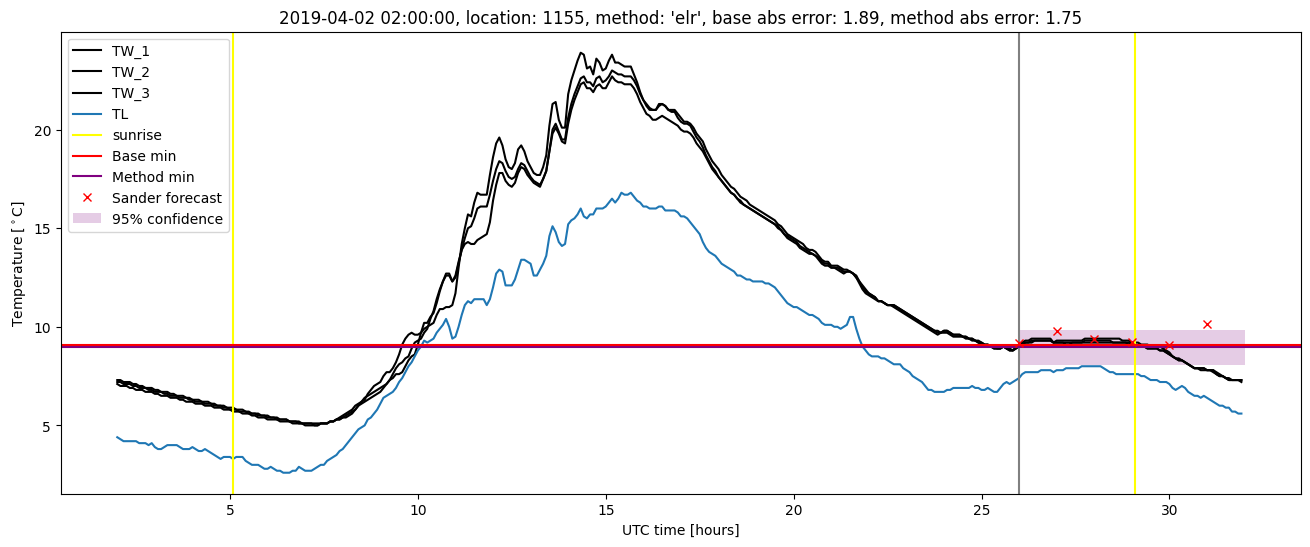
Extended logistic regression plots