GMS location: 1154
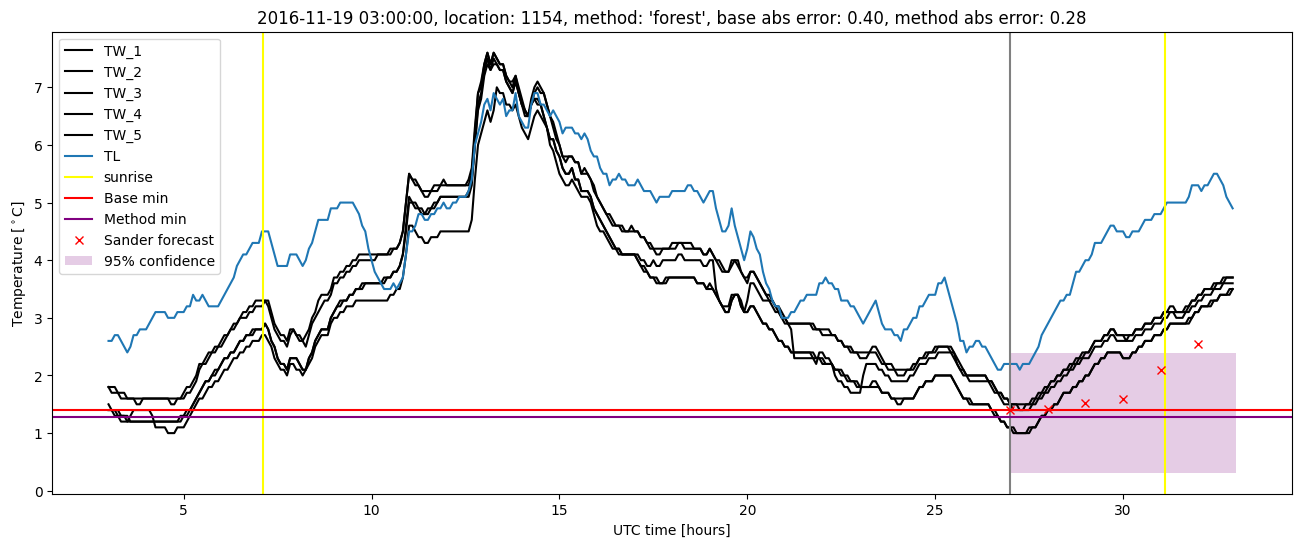
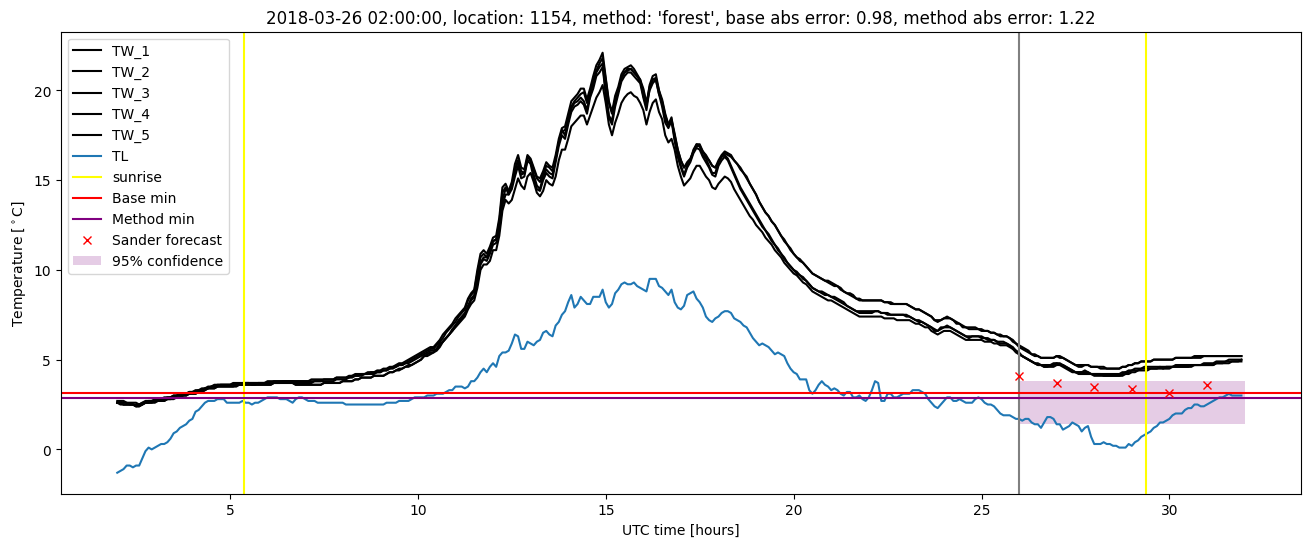
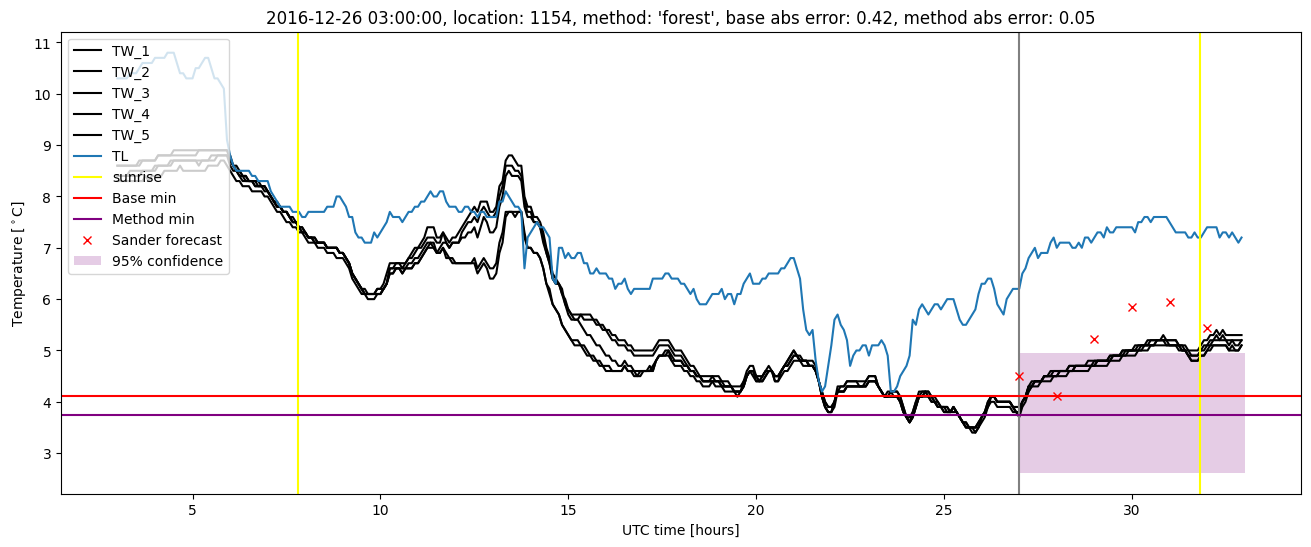
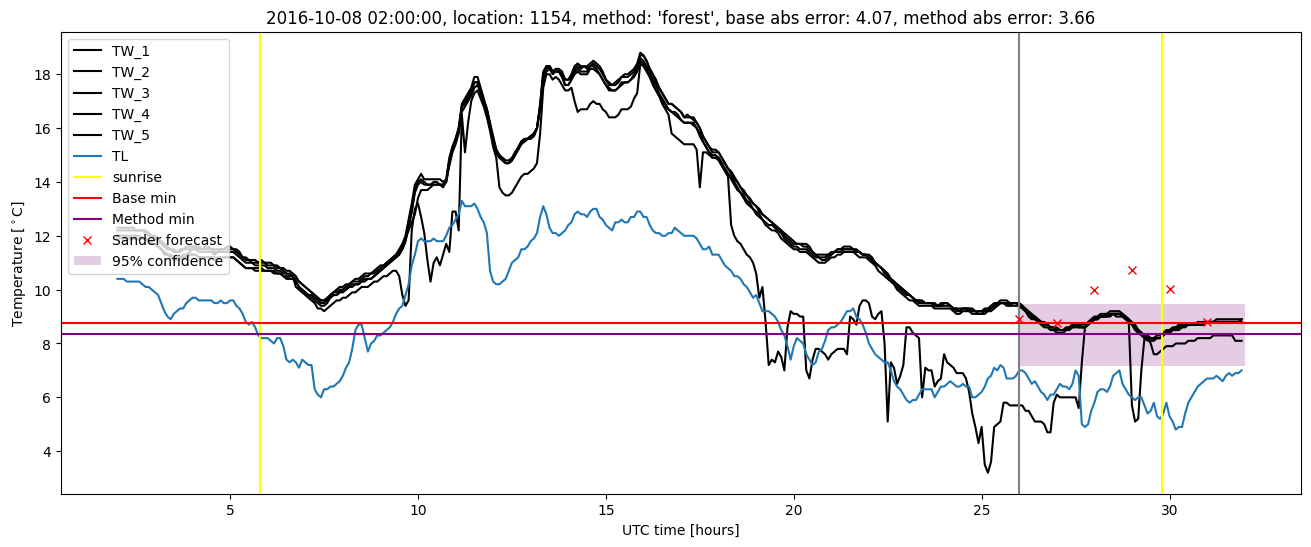
Random forest results
| names |
period |
power |
significance |
meanSquareError |
absError |
maxError |
CRPS |
IGN |
| baseline |
winter 2016 |
1.000 |
0.030 |
0.422 |
0.473 |
2.380 |
NaN |
NaN |
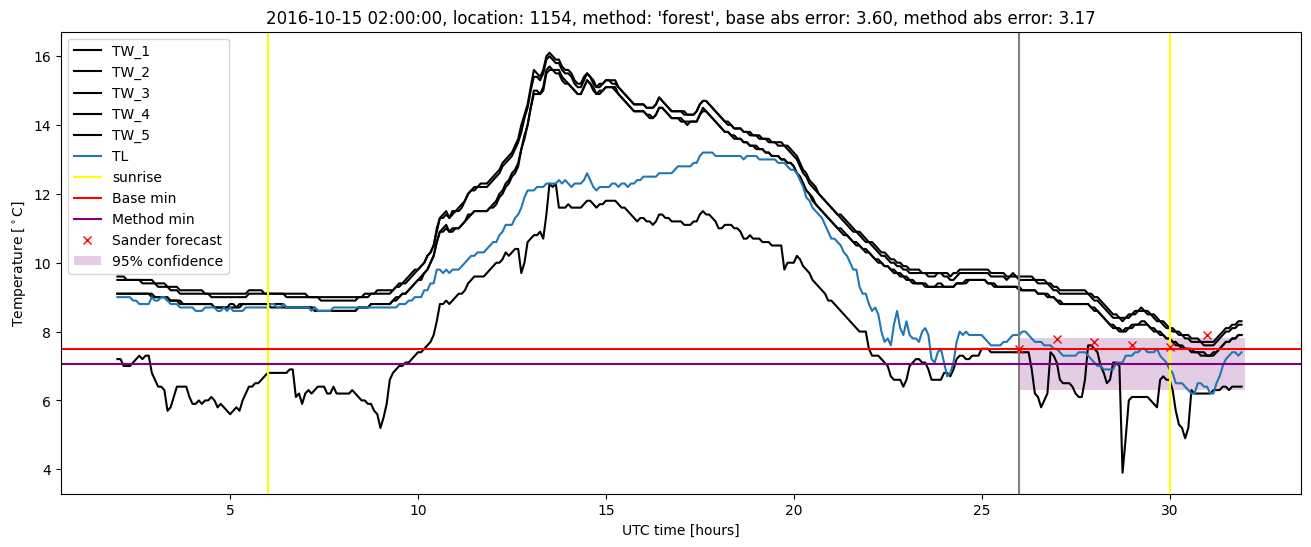
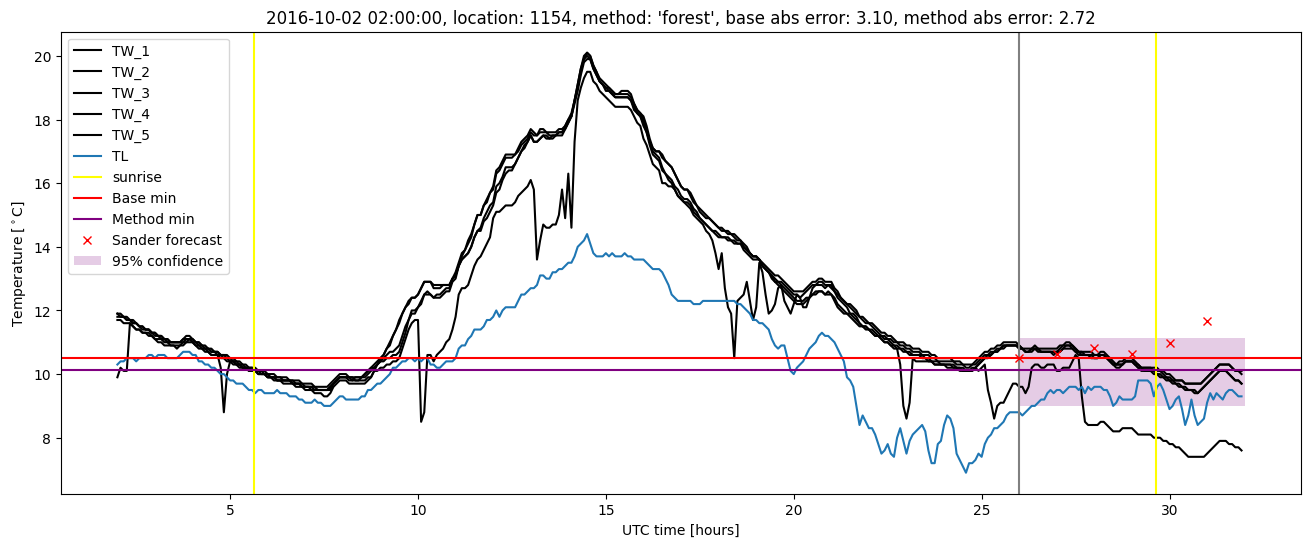
| forest |
winter 2016 |
1.000 |
0.030 |
0.328 |
0.425 |
2.013 |
0.568 |
2.052 |
| baseline |
winter 2017 |
0.983 |
0.000e+00 |
0.911 |
0.631 |
4.066 |
NaN |
NaN |
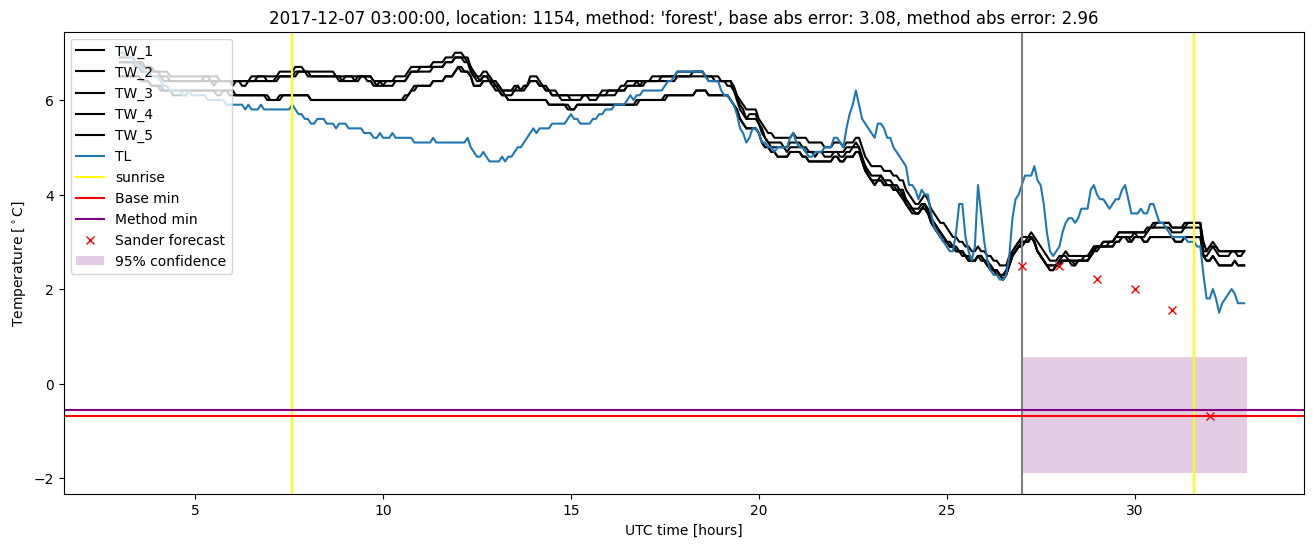
| forest |
winter 2017 |
0.992 |
0.000e+00 |
0.749 |
0.576 |
3.663 |
0.586 |
3.928 |
| baseline |
winter 2018 |
0.971 |
0.100 |
0.403 |
0.447 |
3.085 |
NaN |
NaN |
| forest |
winter 2018 |
0.978 |
0.050 |
0.375 |
0.445 |
2.963 |
0.598 |
2.171 |
| baseline |
winter 2019 |
0.993 |
0.077 |
0.434 |
0.495 |
2.105 |
NaN |
NaN |
| forest |
winter 2019 |
0.993 |
0.077 |
0.287 |
0.407 |
1.936 |
0.603 |
2.472 |
| baseline |
all |
0.988 |
0.049 |
0.529 |
0.506 |
4.066 |
NaN |
NaN |
| forest |
all |
0.991 |
0.033 |
0.425 |
0.460 |
3.663 |
0.588 |
2.598 |
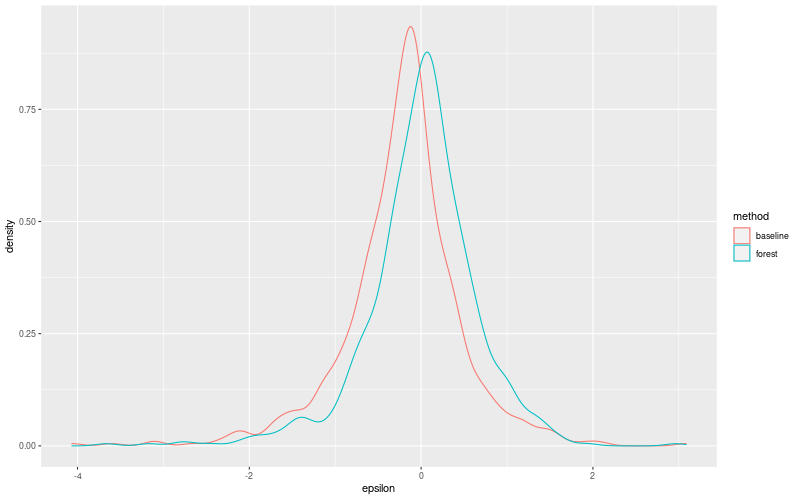
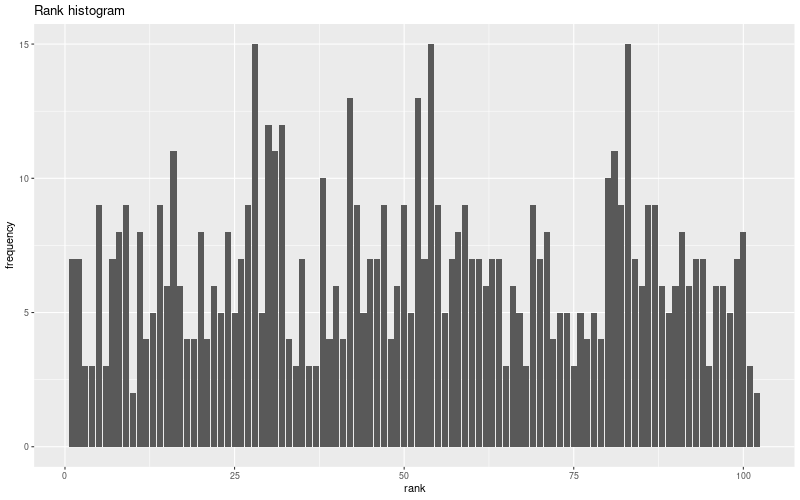
Random forest plots

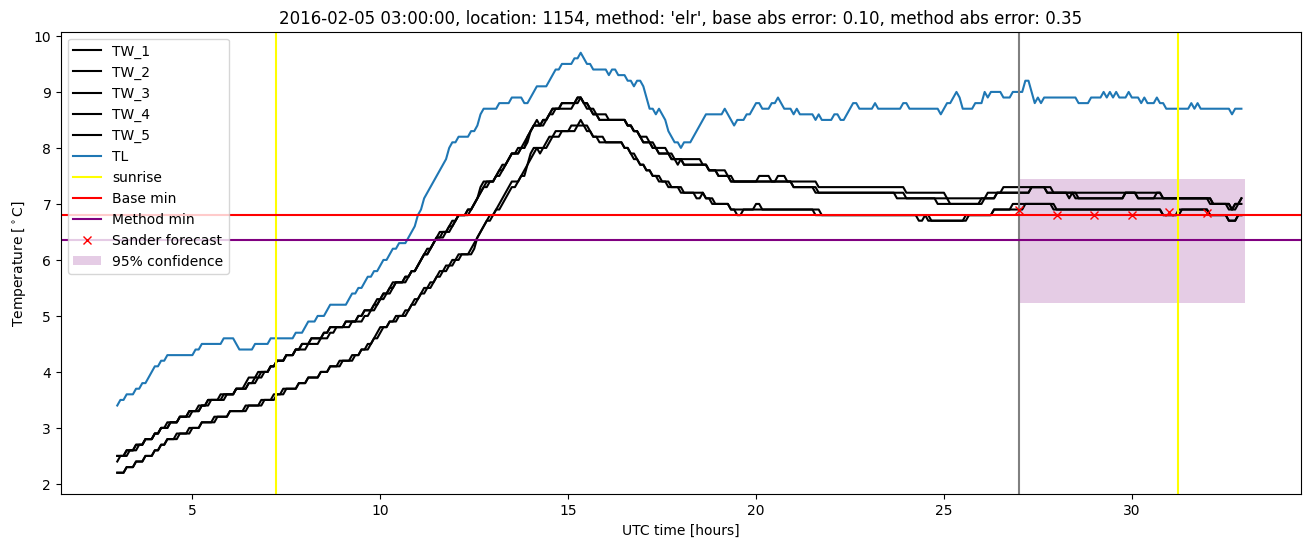
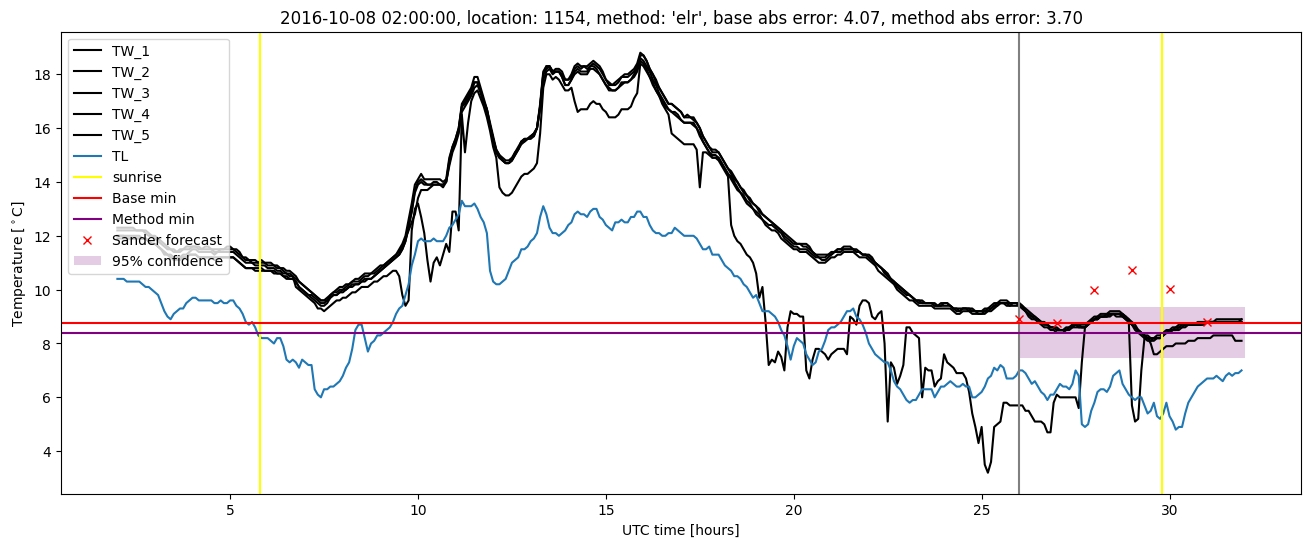
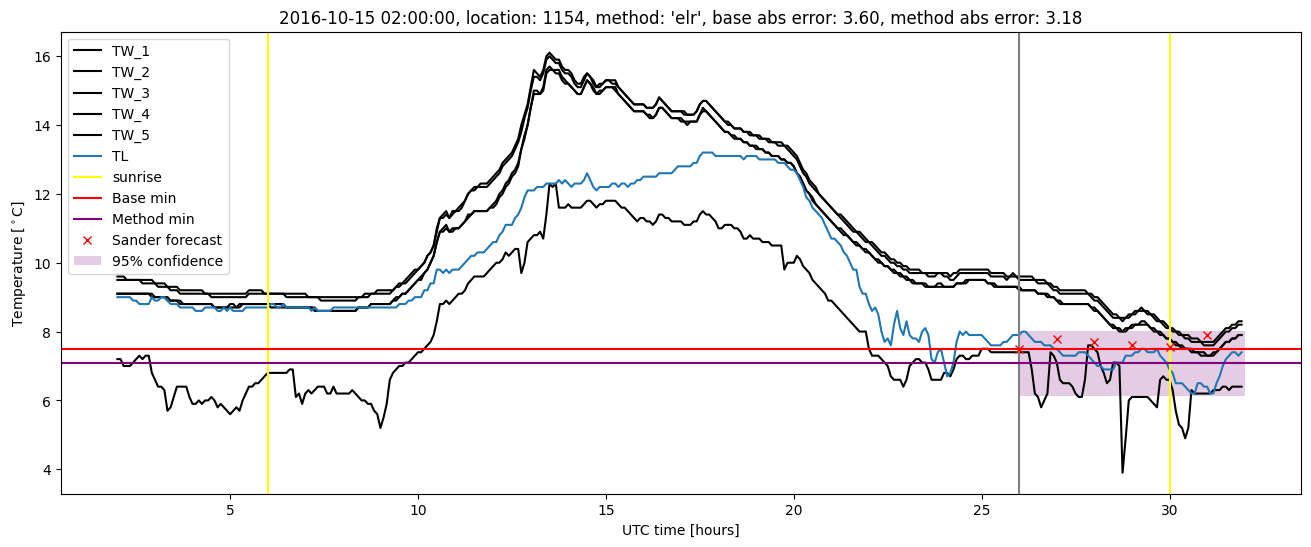
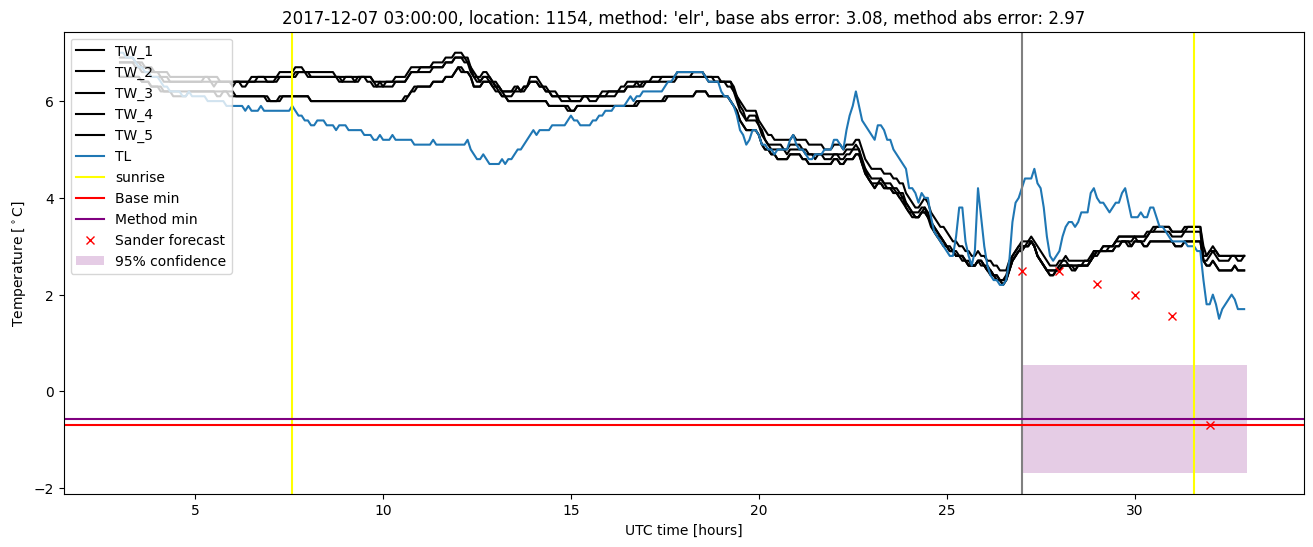
Extended logistic regression results
| names |
period |
power |
significance |
meanSquareError |
absError |
maxError |
CRPS |
IGN |
| baseline |
winter 2016 |
1.000 |
0.030 |
0.422 |
0.473 |
2.380 |
NaN |
NaN |
| elr |
winter 2016 |
1.000 |
0.030 |
0.352 |
0.467 |
1.937 |
0.657 |
2.889 |
| baseline |
winter 2017 |
0.983 |
0.000e+00 |
0.911 |
0.631 |
4.066 |
NaN |
NaN |
| elr |
winter 2017 |
0.983 |
0.000e+00 |
0.766 |
0.608 |
3.702 |
0.660 |
4.724 |
| baseline |
winter 2018 |
0.971 |
0.100 |
0.403 |
0.447 |
3.085 |
NaN |
NaN |
| elr |
winter 2018 |
0.964 |
0.050 |
0.407 |
0.500 |
2.972 |
0.673 |
2.962 |
| baseline |
winter 2019 |
0.993 |
0.077 |
0.434 |
0.495 |
2.105 |
NaN |
NaN |
| elr |
winter 2019 |
0.993 |
0.077 |
0.340 |
0.468 |
1.965 |
0.682 |
2.954 |
| baseline |
all |
0.988 |
0.049 |
0.529 |
0.506 |
4.066 |
NaN |
NaN |
| elr |
all |
0.986 |
0.033 |
0.456 |
0.507 |
3.702 |
0.668 |
3.333 |
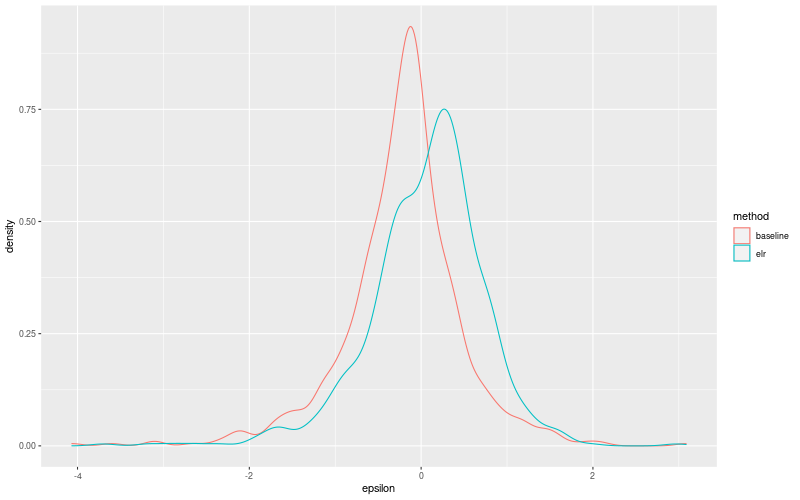
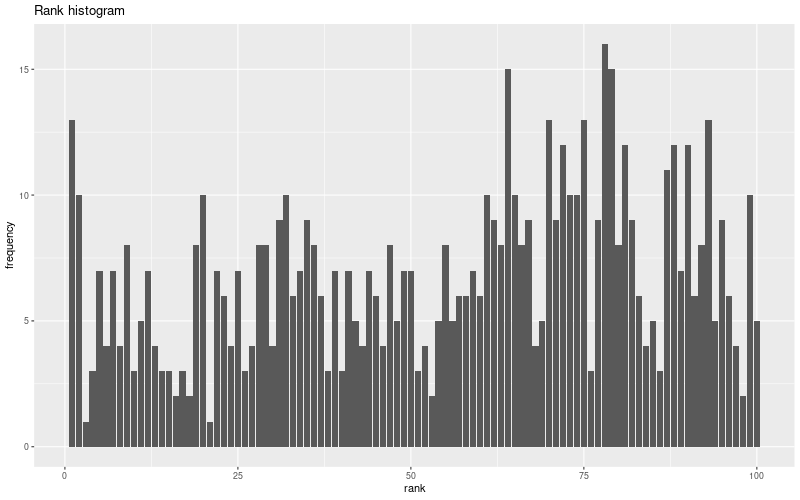
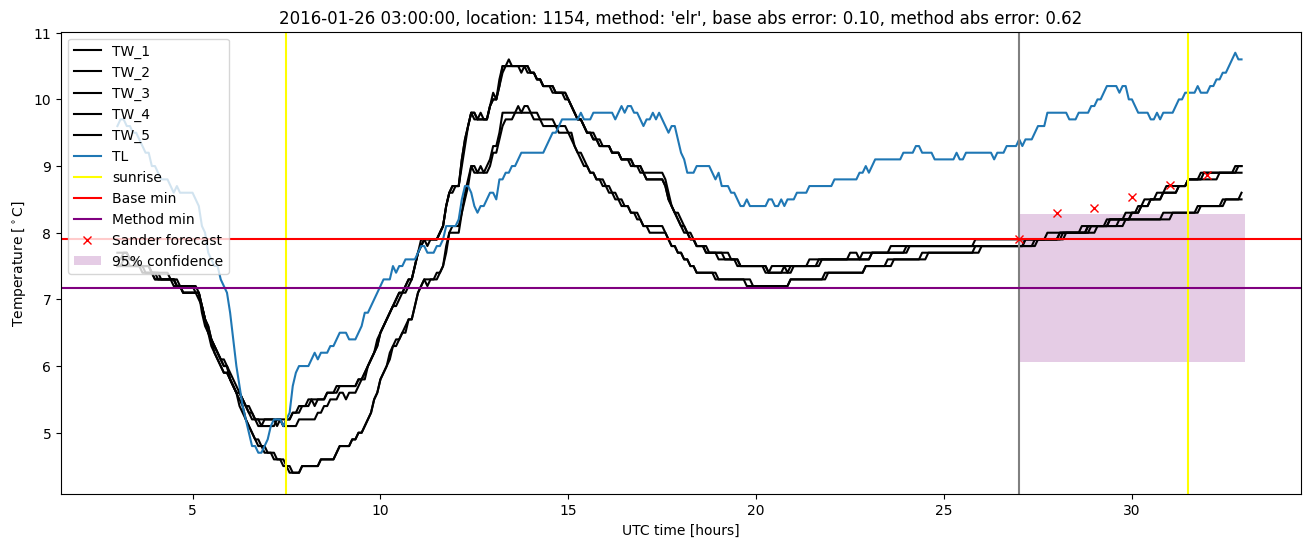
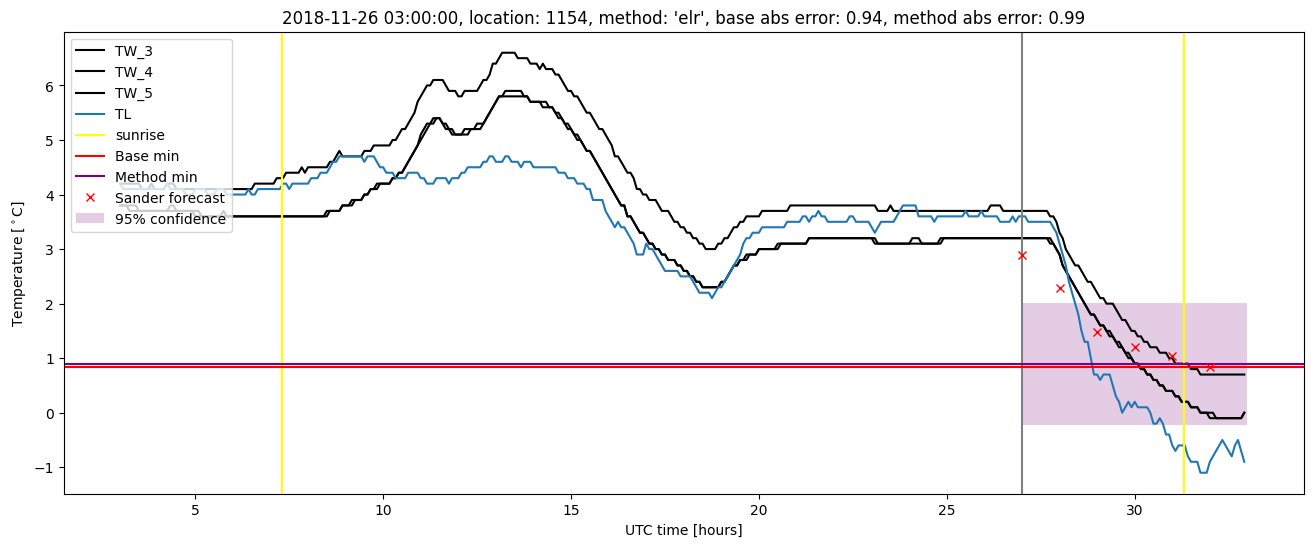
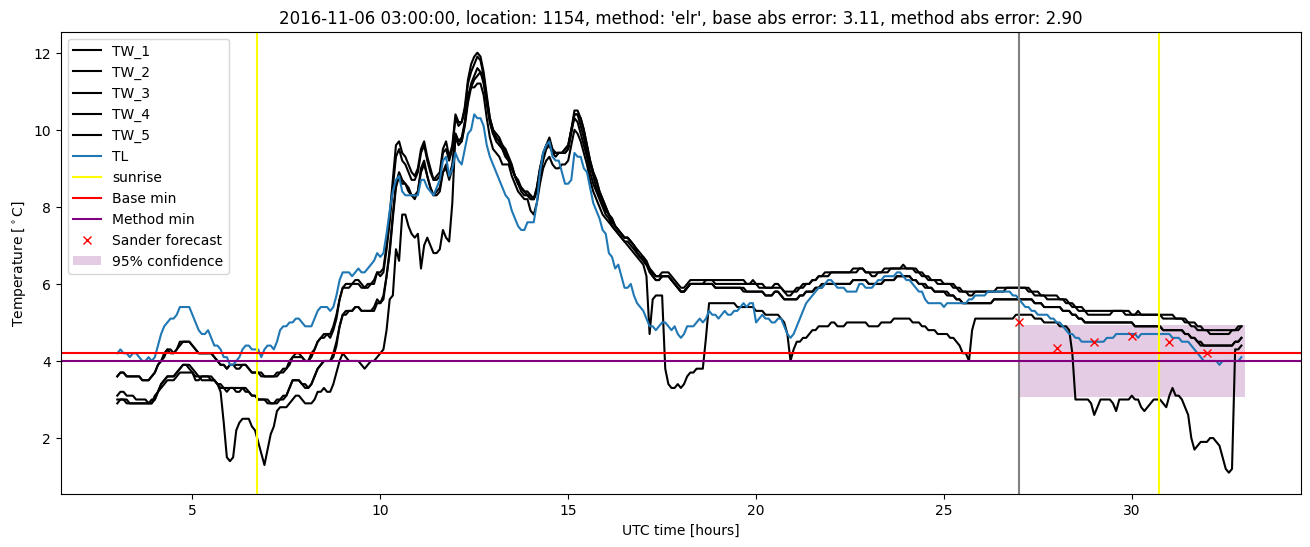
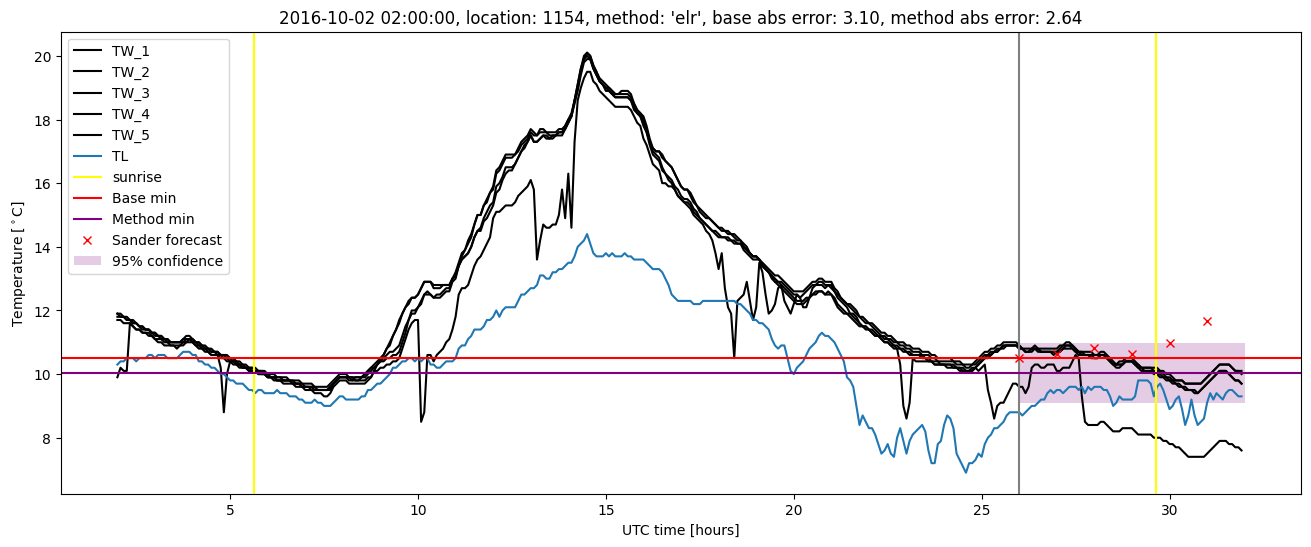
Extended logistic regression plots