GMS location: 1151
Random forest results
| names |
period |
power |
significance |
meanSquareError |
absError |
maxError |
CRPS |
IGN |
| baseline |
winter 2016 |
0.983 |
0.120 |
0.346 |
0.428 |
1.960 |
NaN |
NaN |
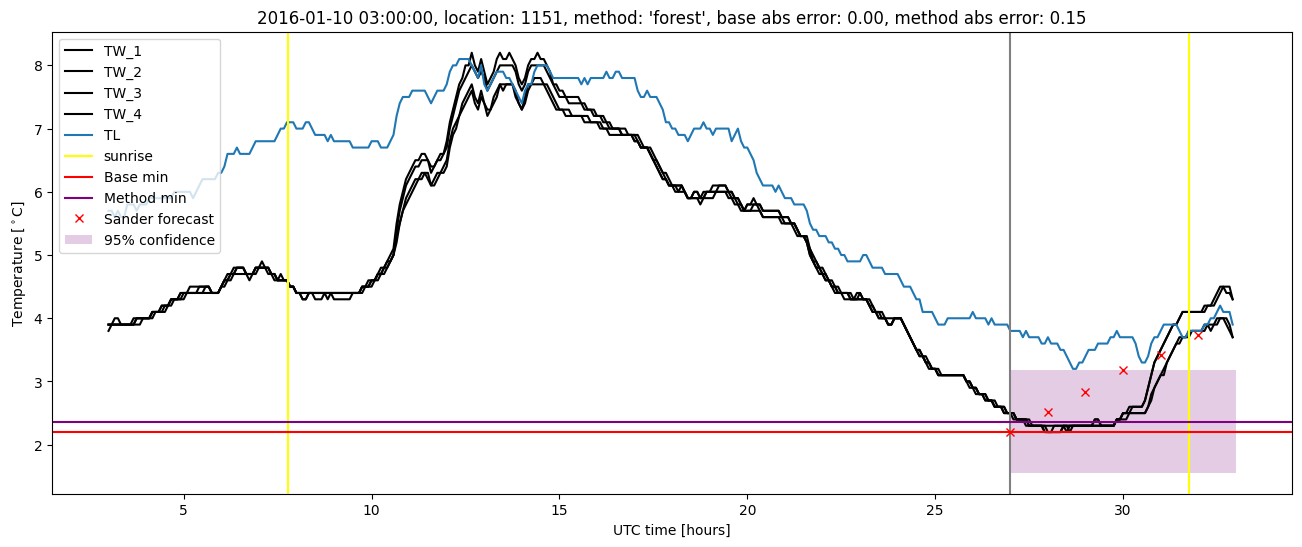
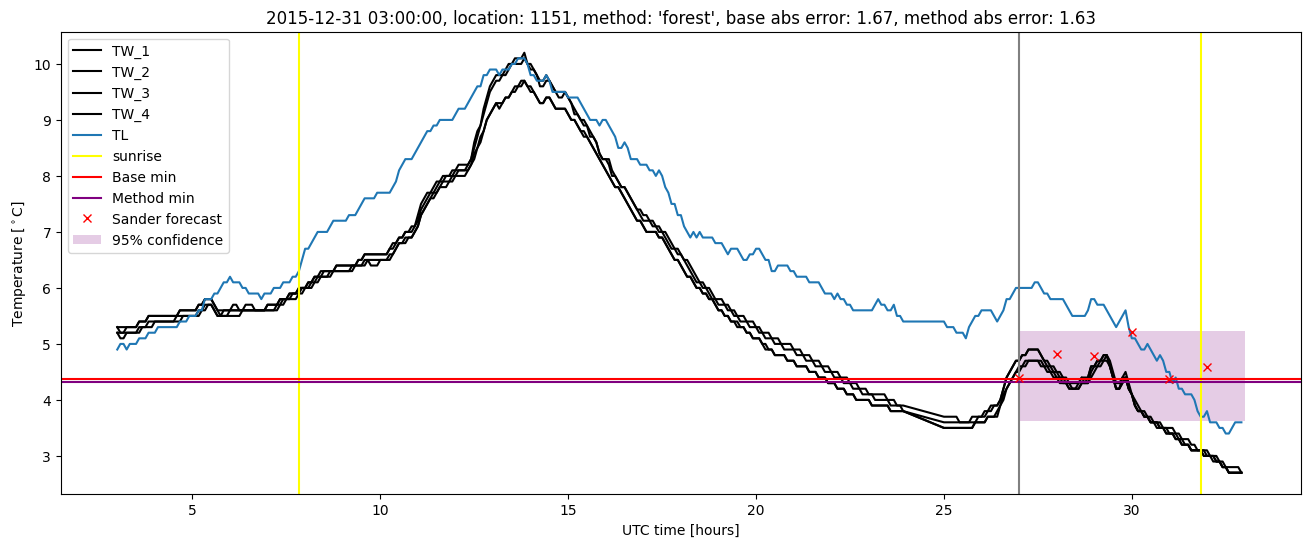
| forest |
winter 2016 |
1.000 |
0.120 |
0.245 |
0.357 |
1.627 |
0.477 |
3.216 |
| baseline |
winter 2017 |
0.983 |
0.032 |
0.553 |
0.550 |
2.175 |
NaN |
NaN |
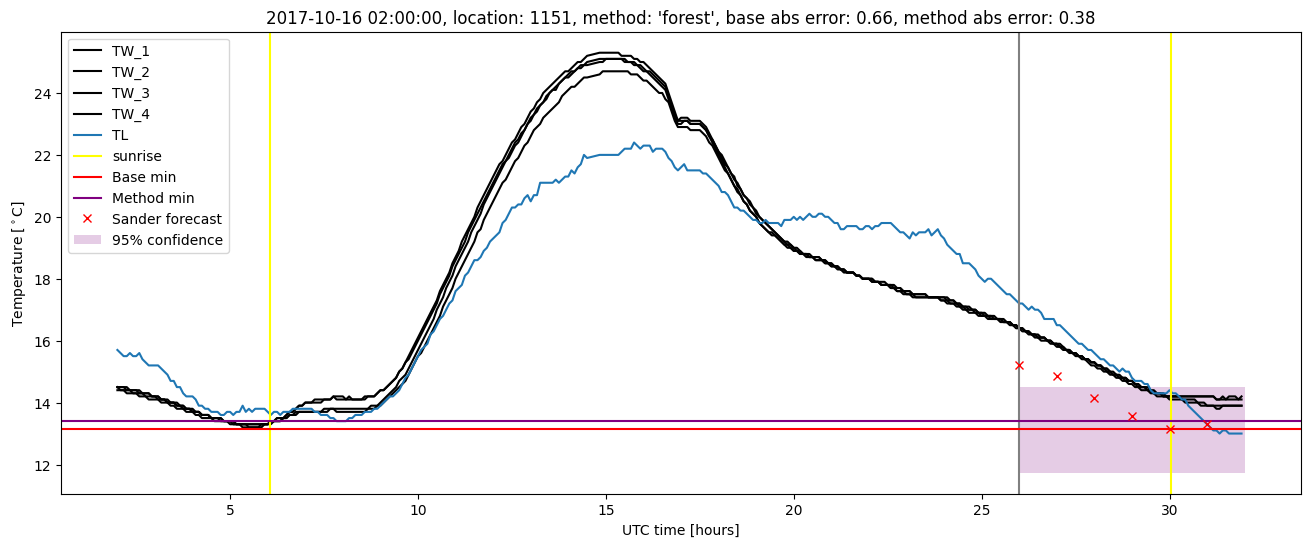
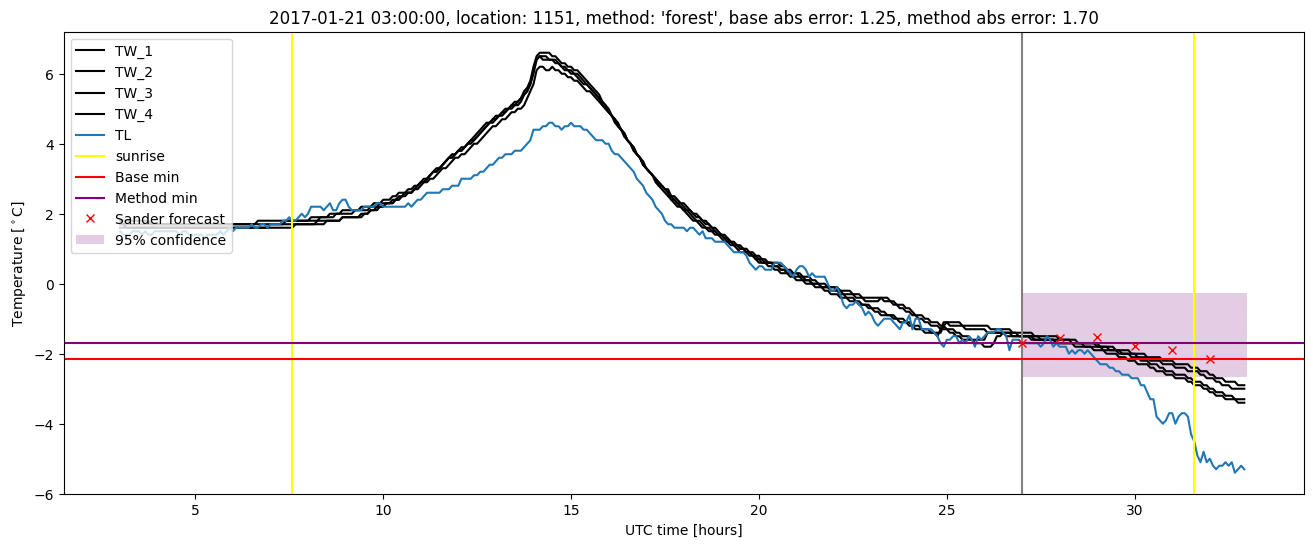
| forest |
winter 2017 |
0.992 |
0.032 |
0.339 |
0.436 |
1.700 |
0.478 |
3.730 |
| baseline |
winter 2018 |
0.987 |
0.176 |
0.373 |
0.445 |
2.091 |
NaN |
NaN |
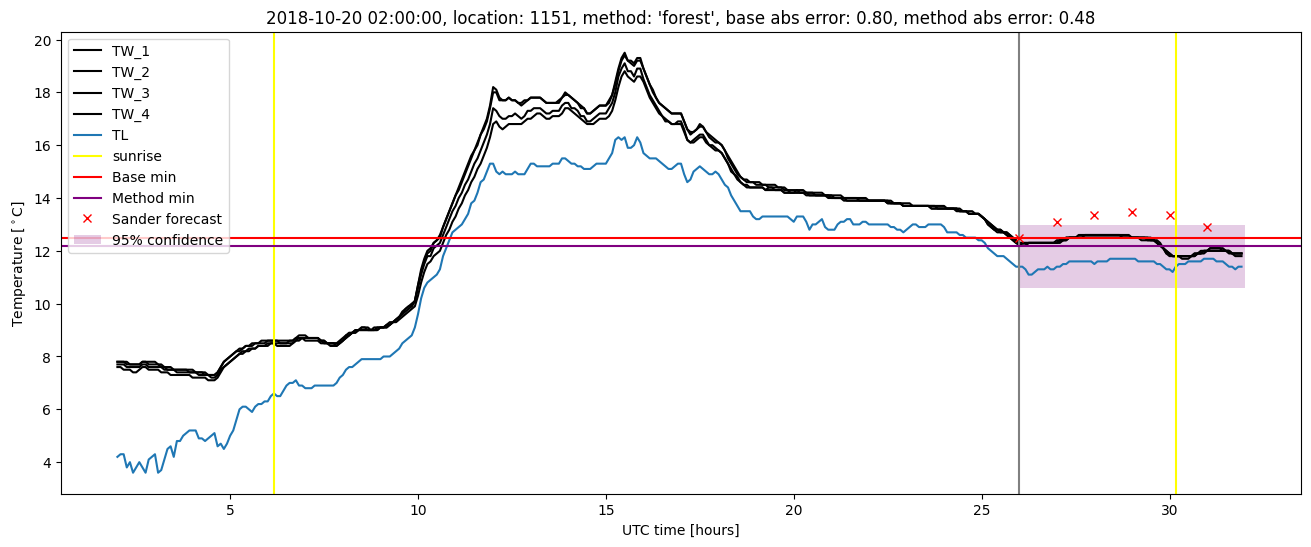
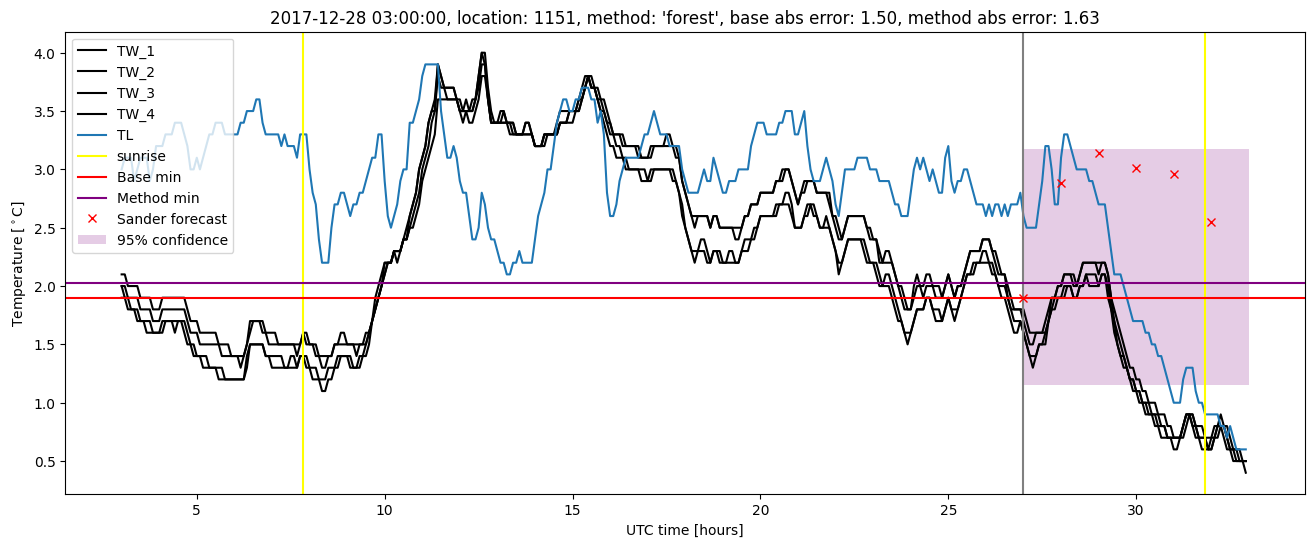
| forest |
winter 2018 |
0.993 |
0.176 |
0.305 |
0.410 |
1.630 |
0.477 |
3.015 |
| baseline |
winter 2019 |
1.000 |
0.000e+00 |
0.355 |
0.421 |
2.413 |
NaN |
NaN |
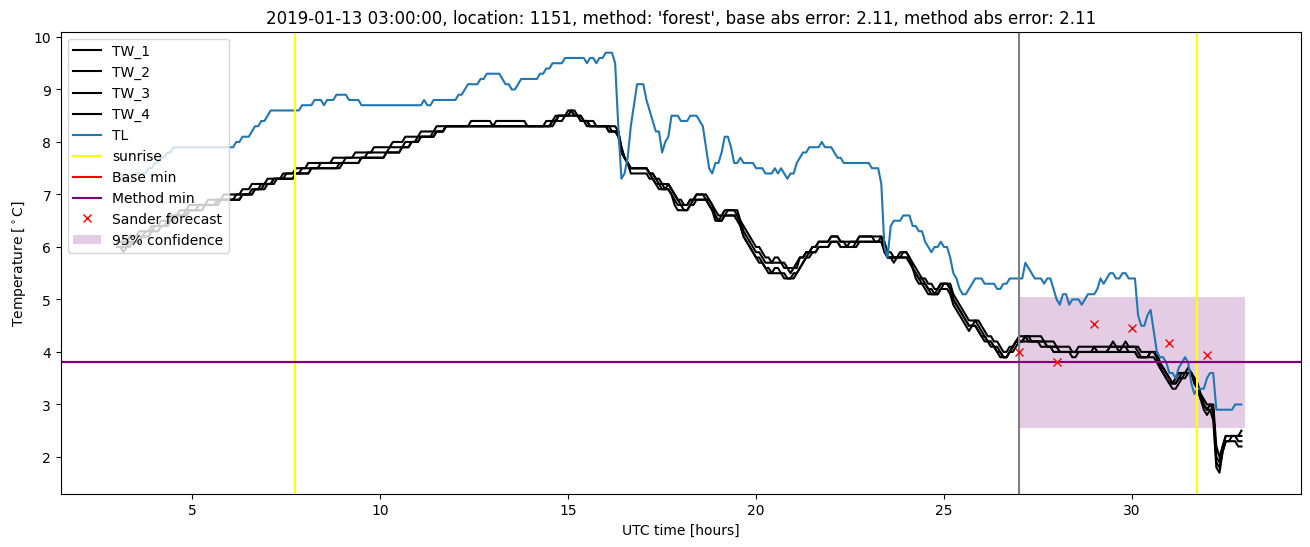
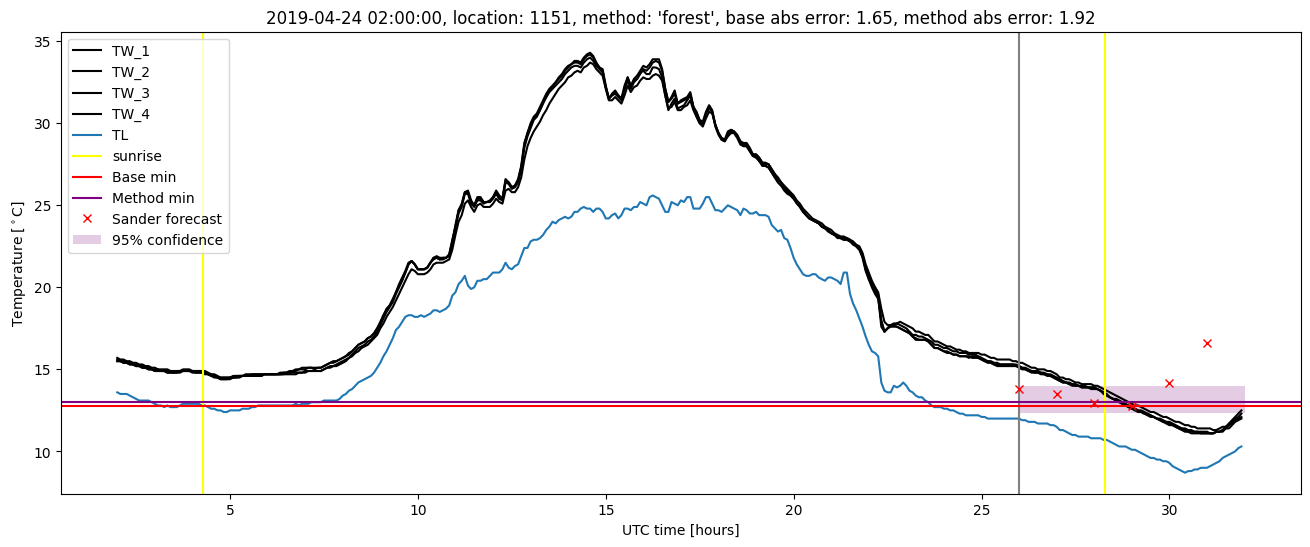
| forest |
winter 2019 |
1.000 |
0.077 |
0.251 |
0.365 |
2.107 |
0.462 |
3.335 |
| baseline |
all |
0.988 |
0.097 |
0.399 |
0.457 |
2.413 |
NaN |
NaN |
| forest |
all |
0.997 |
0.107 |
0.282 |
0.390 |
2.107 |
0.474 |
3.301 |
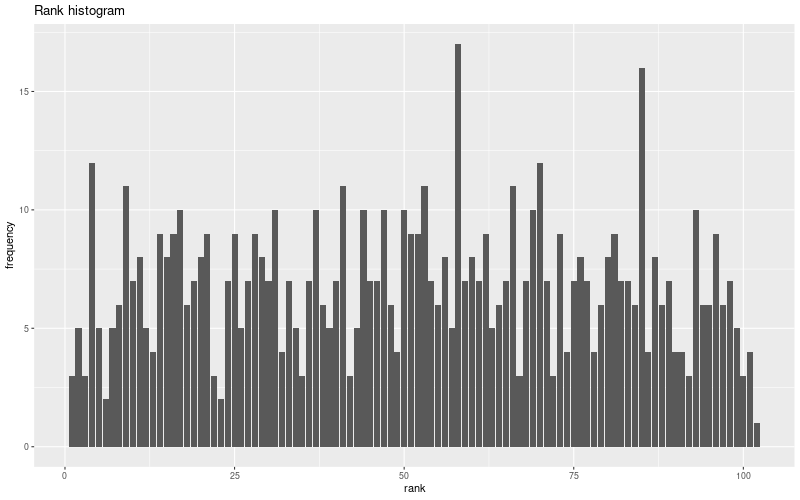
Random forest plots
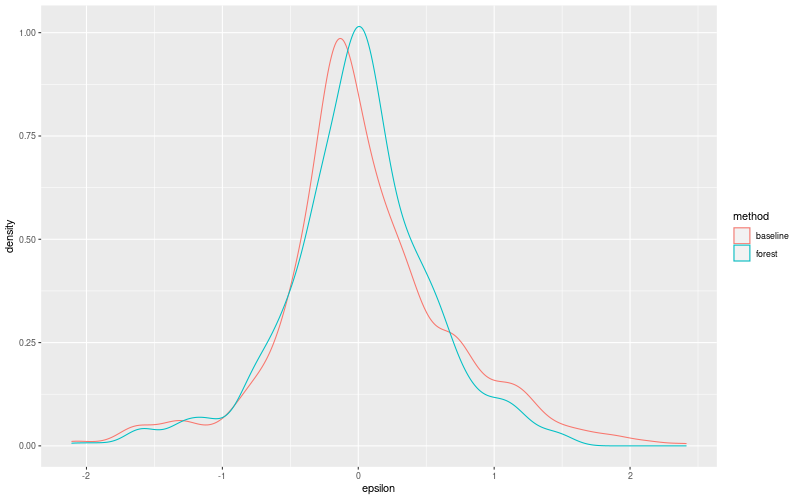
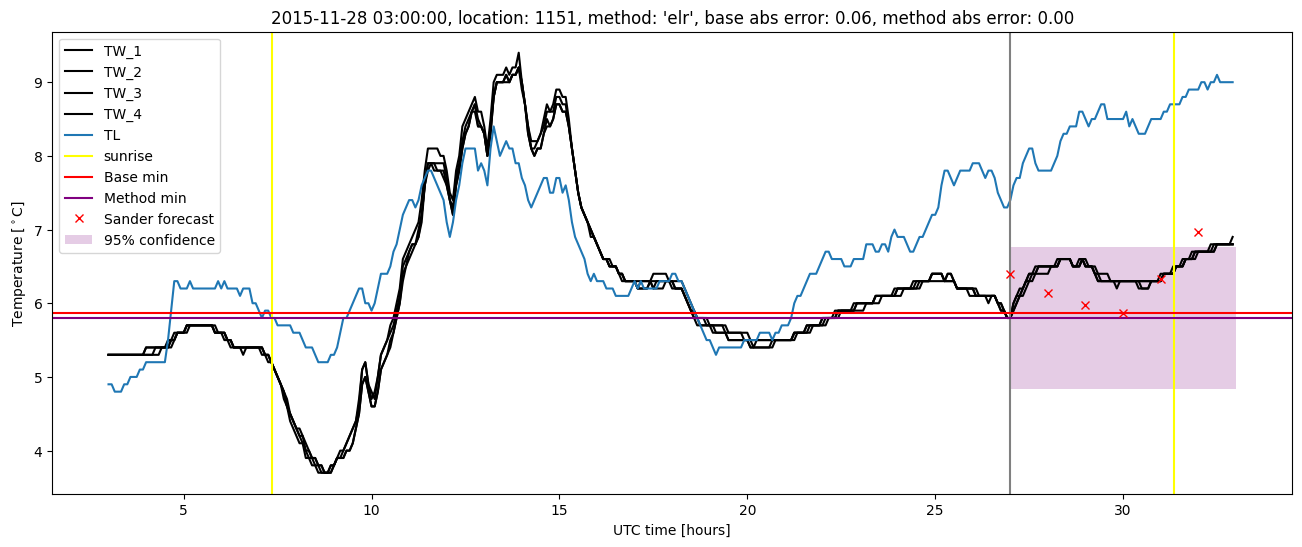
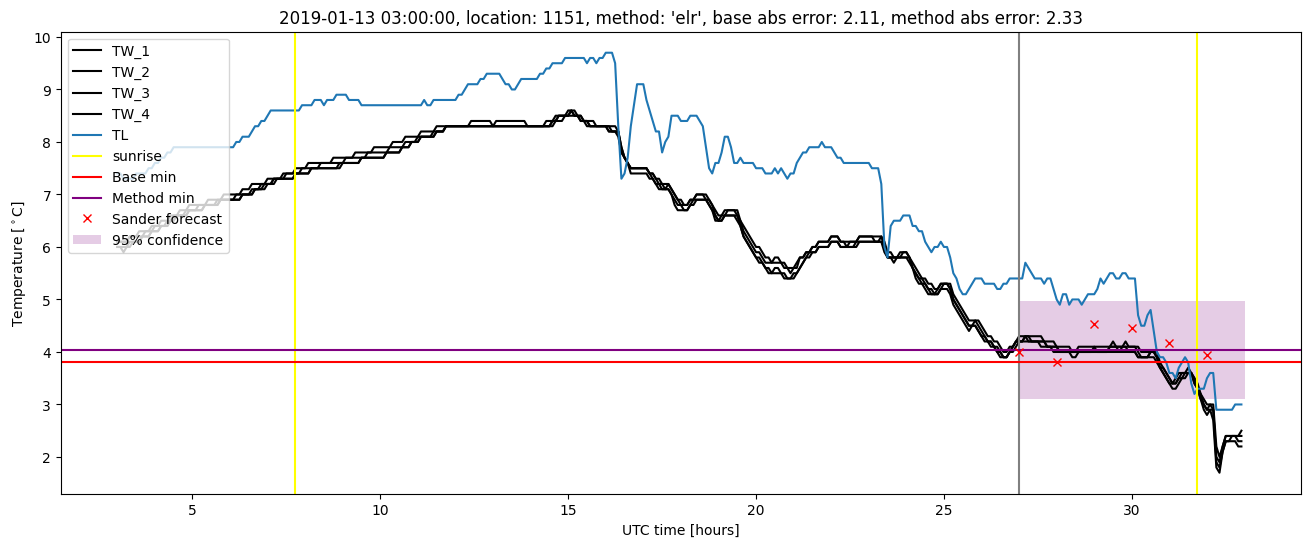
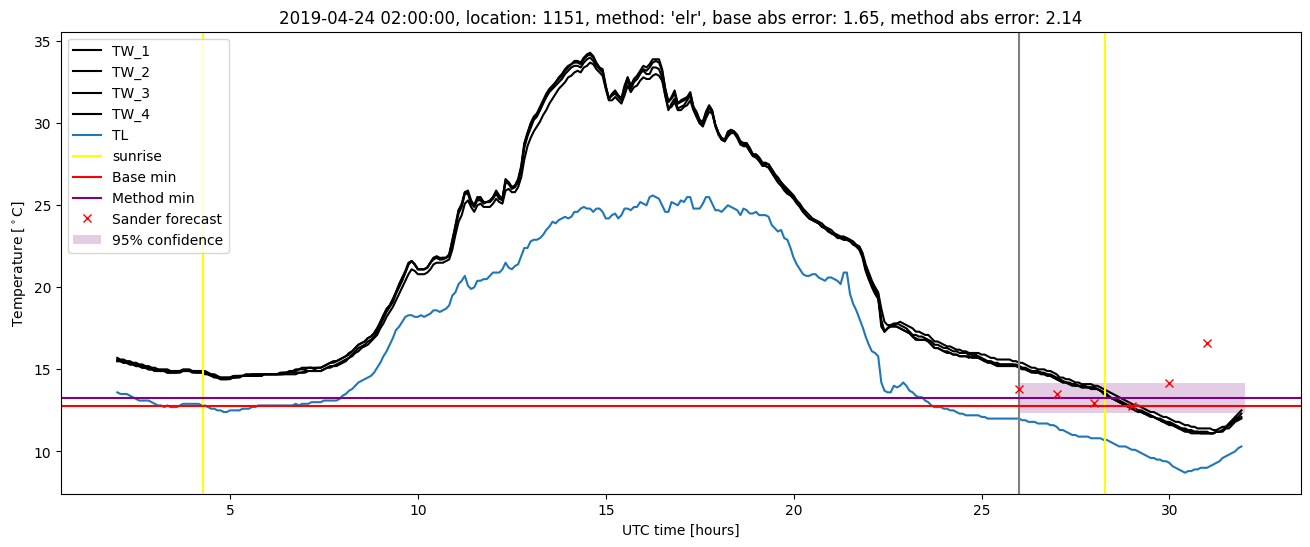
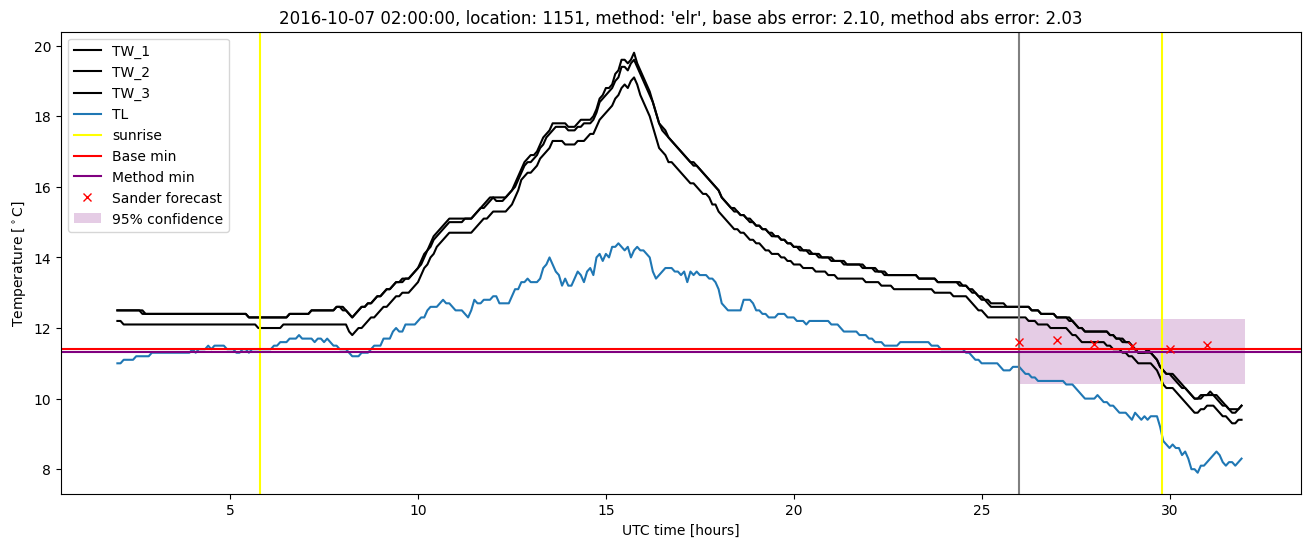
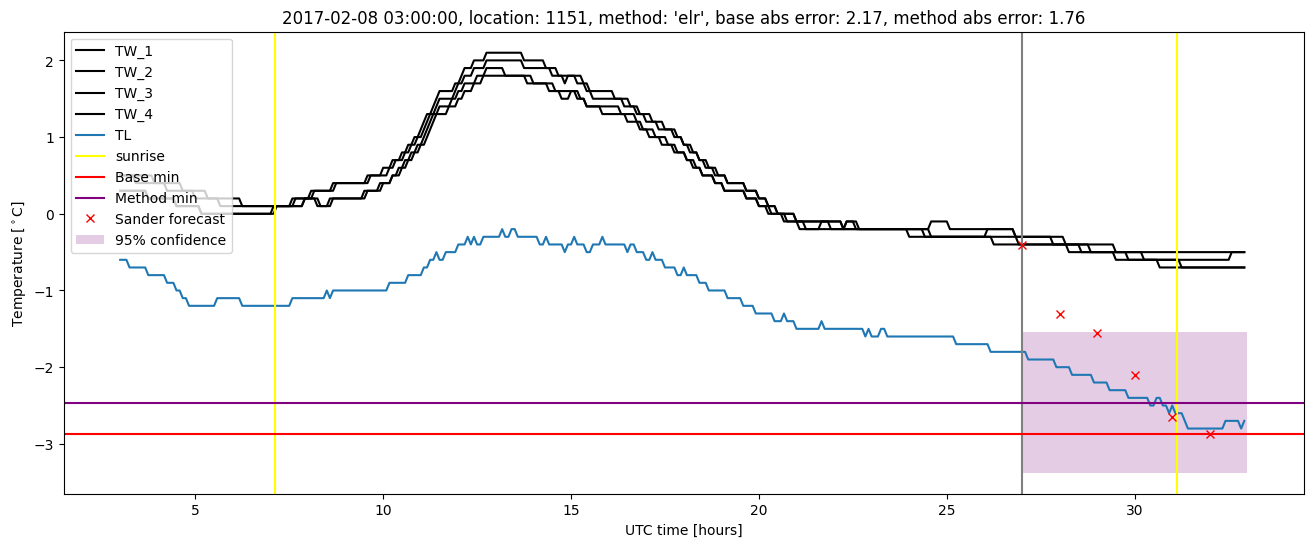
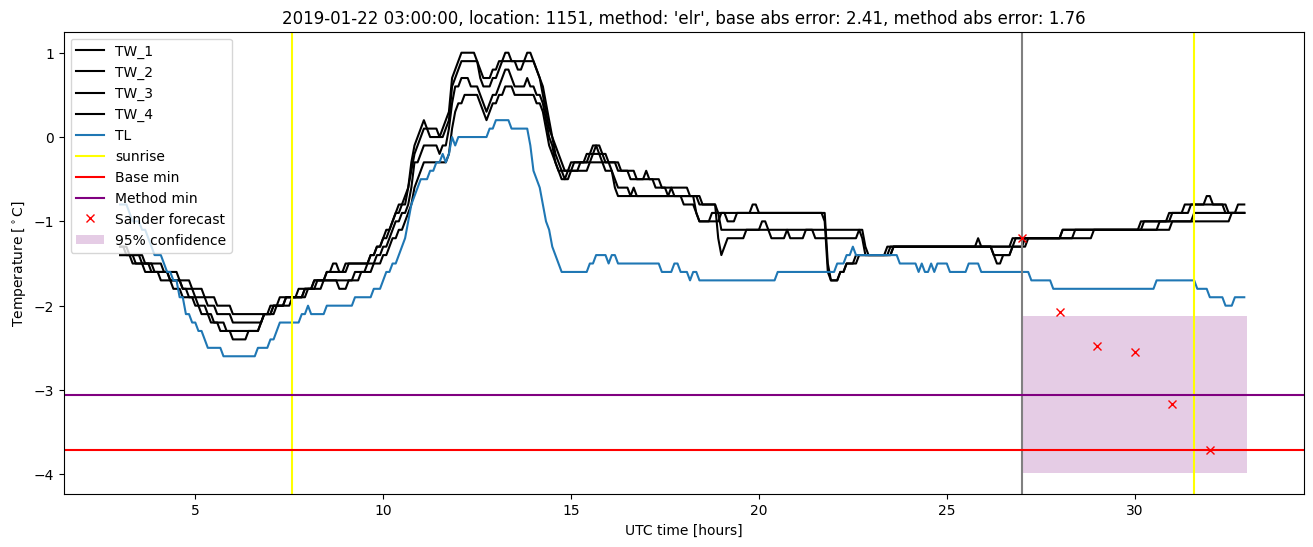
Extended logistic regression results
| names |
period |
power |
significance |
meanSquareError |
absError |
maxError |
CRPS |
IGN |
| baseline |
winter 2016 |
0.983 |
0.120 |
0.346 |
0.428 |
1.960 |
NaN |
NaN |
| elr |
winter 2016 |
0.978 |
0.000e+00 |
0.286 |
0.411 |
1.738 |
0.569 |
3.489 |
| baseline |
winter 2017 |
0.983 |
0.032 |
0.553 |
0.550 |
2.175 |
NaN |
NaN |
| elr |
winter 2017 |
0.992 |
0.032 |
0.420 |
0.483 |
2.030 |
0.502 |
3.248 |
| baseline |
winter 2018 |
0.987 |
0.176 |
0.373 |
0.445 |
2.091 |
NaN |
NaN |
| elr |
winter 2018 |
0.987 |
0.235 |
0.371 |
0.468 |
1.709 |
0.559 |
3.962 |
| baseline |
winter 2019 |
1.000 |
0.000e+00 |
0.355 |
0.421 |
2.413 |
NaN |
NaN |
| elr |
winter 2019 |
1.000 |
0.077 |
0.361 |
0.444 |
2.332 |
0.510 |
3.177 |
| baseline |
all |
0.988 |
0.097 |
0.399 |
0.457 |
2.413 |
NaN |
NaN |
| elr |
all |
0.988 |
0.097 |
0.354 |
0.449 |
2.332 |
0.538 |
3.488 |
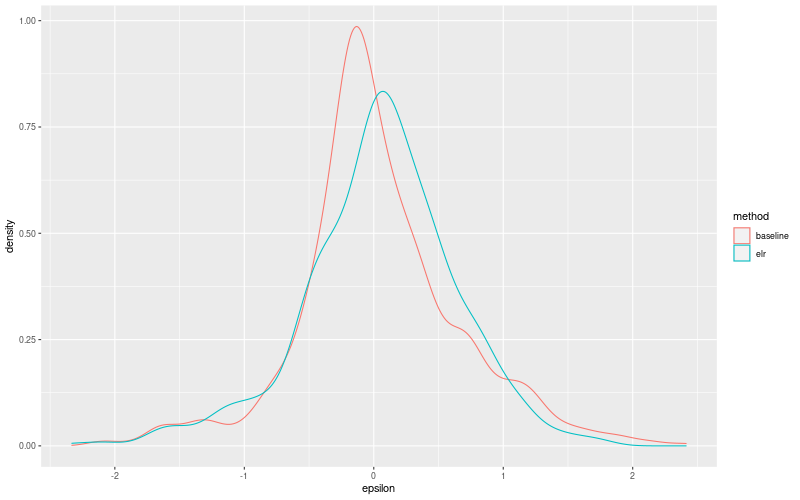
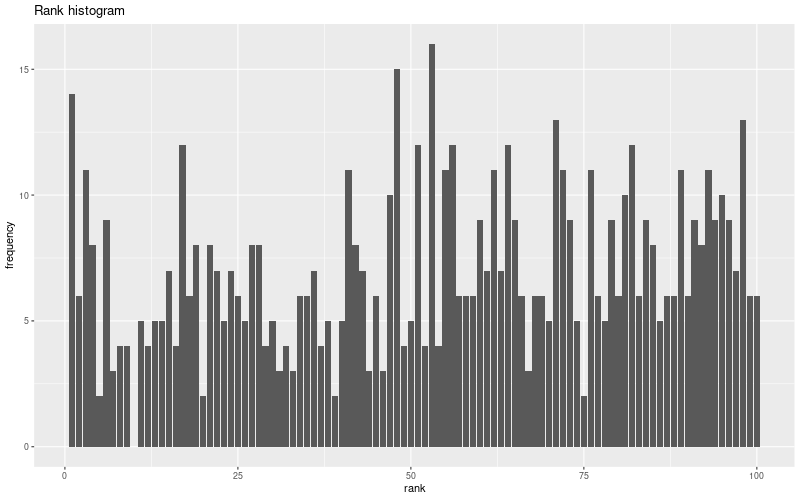
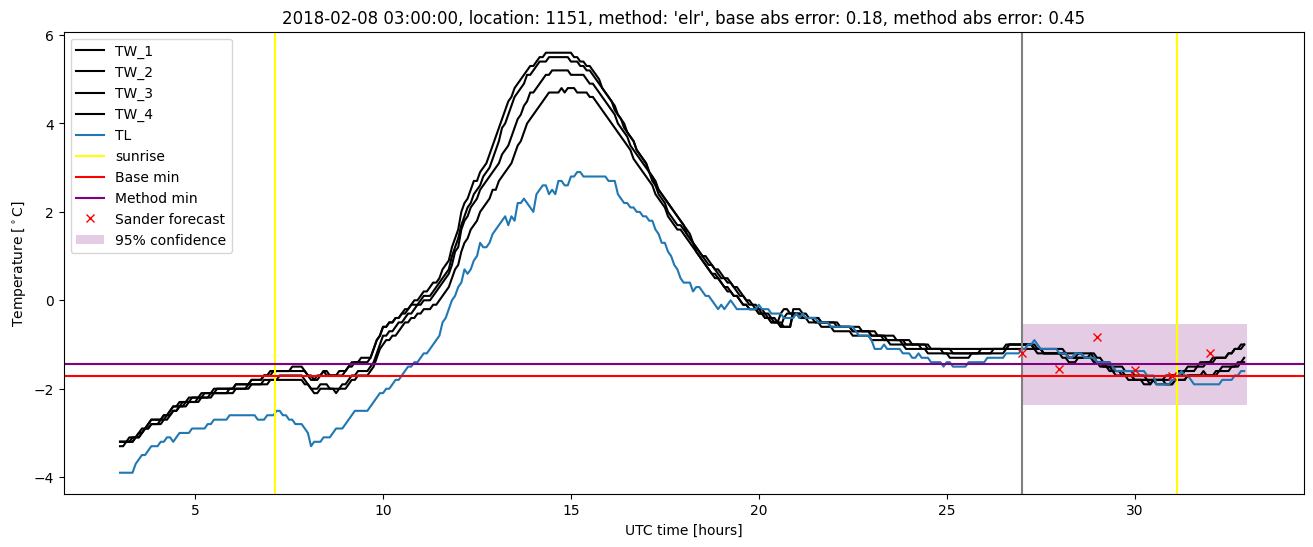
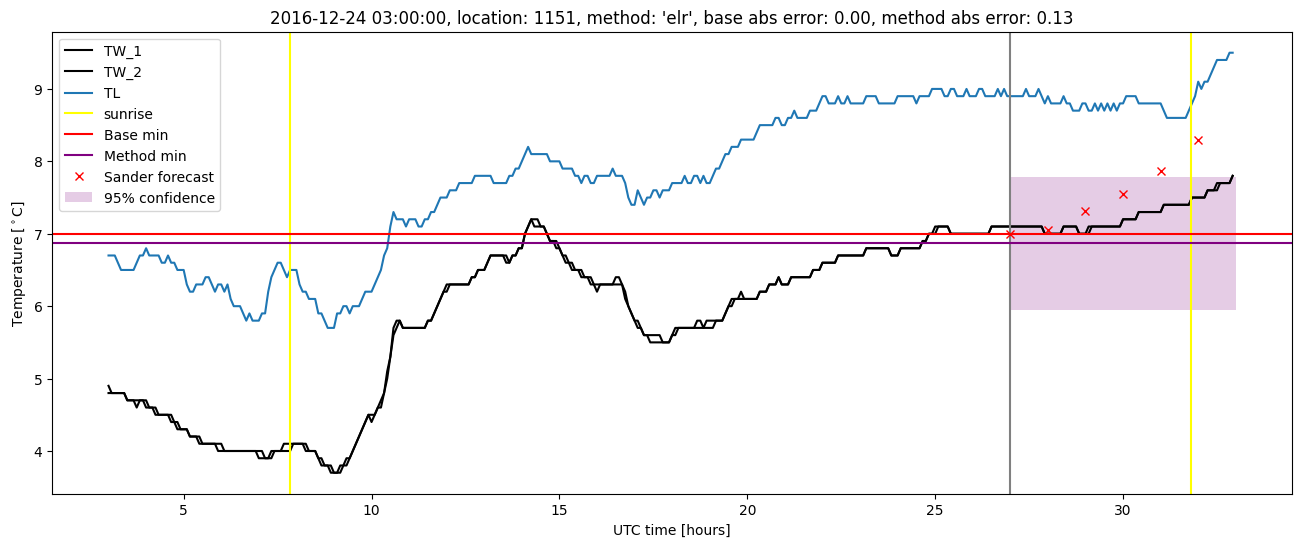
Extended logistic regression plots